1. Introduction
The current financial crisis has a different effect considering the last past times. The actuation of the European Central Bank has given liquidity to the financial market but the financial situation continued and the solution adopted which is based on the monetary policy doesn’t improve the real economy [1] -[3] . In this scenario the model to estimate the future of economic situation doesn’t allow to obtain an adequate solution to improve the economic situation and the government can’t make decisions to ensure the social rights of its citizens and the deficits of countries are being increased [4] -[6] . In this situation it is possible to take various approaches as applying a new value theory or adopting different forms to measure the economic activity.
According to the previous statement, this paper presents a different methodology based on accounting information of the Central Balance of Bank of Spain. Keynes said that the capitalist economy does not know how the balances occur but through accounting, firms always have a balance which has different economic and financial consequences. If you consider that companies are economic subjects which act in an economic market, the set of the information they provide about their financial statements is the result of a management. That is, their financial statements are their responses to the changes that occur in a market and, therefore, such effects can be measured. This management result will be measured through the Edgeworth’s box. The method by which this methodology is applied is exposed in first part of this article, the second part is to analyze the situation of the Spanish economy and the third part is dedicated to explain its future.
2. The Economic and Financial Significance of Accounting Information
An Enterprise has two types of relation with the markets. There are economic transactions when good are purchased or sold for its activity and the financial transaction are contra-account of the first. As a result of this relation the accounts have two distinct natures, economic and financial and this form measures the result of management in two ways. In order to select the economics account the asset of enterprise must be considered except those that have a financial nature such as financial instrument, client or treasure. That is to say, excluding all accounts that have a financial or monetary fund and so these accounts are deducted from the financial liability, except the treasure, and it obtains a financial position of enterprise according to the financial market. In this methodology the equity and the financial liability are funds obtained from the financial market and the management result is the accounting cash flow. This management result is obtained from the balance sheet when this is increasing for the accounts that represent an application of accounting politic e.g. the amortizations and depreciations also the contingencies.
The result of activity of the enterprise is represented on Equation (1).
 (1)
(1)
In the equation the variable represents:
MR: Management Result. The result obtained by subtracting the negative economic transactions (purchase or buy goods and fixes assets) from the positive economic transactions (sales of goods or alienate the assets involved in economic activity).
IA: Increasing assets. They represent the value of economic assets that the enterprise hasn’t transferred to the market at end of the economic year.
IT: Increasing treasure. It is the monetary saving or equivalent financial instruments.
IF: Increasing the financial position. This represents the variation of all financial instruments whether they are assets or liabilities.
Once it’s obtained the expression (1) a change of variables can be made according to its position in accounting situation of balance. The new expression is this:
 (2)
(2)
Now we are in position to obtain the situation of the enterprise in a Edgeworth’s box.
3. The Edgeworth’s Box in Accounting
The Edgeworth’s box is a simple square where there are two different positions of customers. This box can be applied to explain the Pareto’s equilibrium under several conditions playing over the demand and offer of two goods. But when a balance of an accounting position is applied in Edgeworth’s box, a display of the company is obtained as consequence of the decision making in a market that doesn’t have what is considered as the conditions of Pareto. That’s to say, in one position of accounting balance there is two customers that are the asset and liability of the balance and there are two goods that are accounting variables of expression (2). For example, in Table 1 there are the values obtained for several positions on the management in an enterprise.
In the Figure 1 it’s possible to measure each position achieved by enterprises on its activity. To obtain several measures is needed to compare the variables with the same economic or financial significance. The indicator L is represented on a continued line which has a financial significance. The indicator G has an economic significance and it is represented on Figure 1 as a dashed line. They can be obtained through the following expressions.
 (3)
(3)
 (4)
(4)
a Variables on principal axes IA and IF. Variables on secondary axes IT and MR. The values of this table are represented in Figure 1.
When indicators L and G take a positive value the enterprise has the right position of all possible. On this position the market gives credit to enterprises and there’s economic increase at the same time. This position is Year 2. In this position, the funds obtained allow to generate treasure with a short increasing of investment on assets. The management result is obtained because there is a continued activity, investment in the asset is held constant as its alterations don’t present elevated levels and treasure is generated.
The bad position is Year 3. In order to continue the activity the enterprises must give credit to the market and there is contraction in demand, thus the management result is high because the level of sale is maintained, but there are less purchases. Thus there are many assets not placed on the market and they remain on the balance sheet of companies, and the management result is materialized on them. The risk level is high in this situation.
Year 3 represents an intermediate position. In Table 2 there are different values obtained in Edgeworth’s box.
Once the position in the box’s Edgeworth is obtained the economic situation of enterprise can be analyzed. The Edgeworth position can be included in coordinate axes as shown in Figure 2; from this representation accounting variables have explanatory power with regard to economic and financial indicators of macroeconomics.
4. The Spanish Economy
The Spanish economy is represented in Figure 3. To explain the activity on Spanish economy, the

Figure 3. The position of Spanish enterprises.
information from Central of Balances of Central Bank of Spain has been used. Its information represent about 30% of Spanish entrerprises and the variable L & G have been obtained considering the increase of accounting variables on Table 3.
To obtain the Edgeworth’s box of the Spanish economy it is necessary to make two transformations. The first of them is to transform all negative increasing into a positive value, taking the high negative value and multiplying by two and after making all value referent to 100 respect the total amount of assets or liabilities. This form is applied to all values. In Table 3 there is an example regarding last years.
To transform all variables in a positive value it’s necessary to make an origin change which will be 60754. This value is obtained adding the values of the assets and the liability and then multiplying this amount by two, and thus a value never adopts a zero value in its transformation. Once all values are positive, it’s necessary to transform them into an equivalent measure to compare all them and measuring your position in a Edgeworth’s box. Table 4 contains the last transformation taking as value 100 the amounts of assets or liabilities.
Once that all values have been transformed it’s possible to represent the position adopted by Spanish enterprises in the Edgeworth’s box according to Figure 3.
To explain the positions in Edgeworth’s box the indexes L and G have been obtained. An example is presented in Table 5.
In Table 5 years 2008 and 2010 represent a good position because they are indicating that the market gives
a. Financial and economic variables

Table 3. The increasing of accounting value.
credit to enterprises, but only the index L of year 2010 takes a higher value than the index G. Opposed to these positions, the year 2012 represent a bad position because in order to continue the activity, the enterprises give or lend credit to the market.
The L and G indexes are represented in Figure 4 and can be differentiated into four zones. Zone A represents positive values of L and G. When values of L and G take negative values, they are in the C zone. As it has been said
Table 4. The value in Edgeworth’s box.
Table 5. The indexes of Edgeworth’s box.
above, enterprises obtain credit from the market in zone A and there is more monetary saving than that in other zone. At the same time, the Management Result doesn’t have an elevated level because the activity is maintained and the increasing of assets doesn’t take elevated levels. In zone C the L and G indexes are negative. Thus the assets are increased because there are disruptions on the market and the monetary saving decreases. At same time the management result is higher than in zone A due to the decreasing of the activity and the enterprise must give credit to the market to maintain the level of sales. The economic situation of Figure 3 can be presented in the following coordinate system of Figure 4.
Once the position of Edgeworth are represented on a coordinate axis, the evolution of the Spanish economy can be explained. In Table 6 there are the years when the Spanish economy has obtained the best position along time.
In Table 6 it can be seen that the years on zone A have the best position and they are located on Figure 4 on the first quadrant where all values are positive. On zone C there are the bad positions and the zone B and D are intermediate zones. Once the classification of different positions on Edgeworth’s box is obtained, the evolution of the Spanish economy and how the Spanish economy must evolve to obtain a position in zone A can be explained.
The Evolution of the Spanish Economy
To see the evolution of Spanish economy, the evolution of the unemployment is represented in Figure 5 to evaluate it according to the zones of Figure 4.
In Figure 5, the dashed line represents the unemployment series (SI_1_1.61) obtained from Bank of Spain and it’s referenced to the secondary axes. L and G indicators are referenced to the primary Y axis. The rectangular limited areas A are indicating the best situations in the Spanish economy and it can be seen how the financial crisis has its effects in 2008.
The situation of enterprises on several zones of Edgeworth’s box has its consequences. Between years 1998 and 2001 the indicator L evolves over the G indicator and the unemployment decreases. This situation is similar to the years 2005 to 2008 and 2010. This way, it’s confirmed that the analysis done above through the Edgeworth’s box, when the enterprises are located in zone A. But the year 2008 is an exception because it is located on zone A and the unemployment increase. In this year the L indicator are below G indicator, consequently, the unemployment has an increase that is not as high as when firms are not located in zone A.
One of the variables that is considered to measure the activity of a country is the Gross Domestic Product (GDP). In Figure 6 the variation of the GDP variable is represented on the secondary y-axis. On the principal-
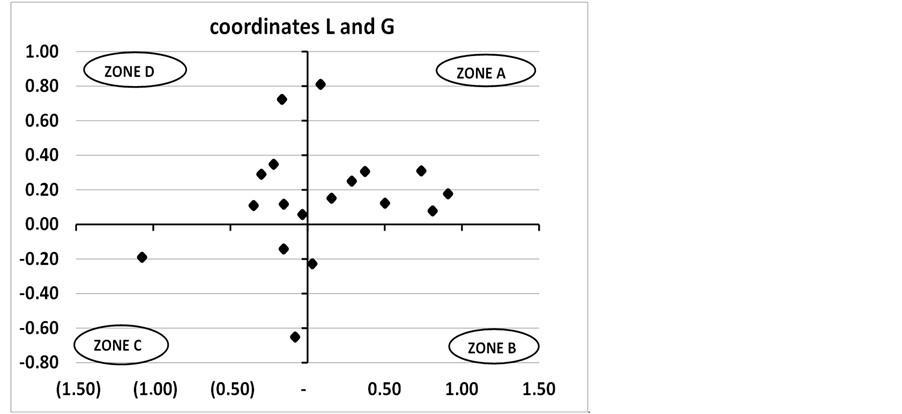
Figure 4. The position of Spanish enterprises.
Table 6. The position of Spanish enterprises.
ordinate axis are represented the L and G indicators. Rectangular areas are representing the Zone A of Edgeworth’s box and we know what happens when the enterprises are located in it.
The variation of GDP has the same tendency of L indicator. That to say, the activity of economy is conditioned by the financial position of enterprises, and they depend on their capacity for obtain credit from the financial market. The solution to overcome the financial crisis has been given according to the monetary theory of Milton Friedman if the indicator L takes the position of the umbrella over indicator G, and this position should allow the exit of the financial crisis.
5. Conclusion
The Edgeworth’s box explains us the situation of the Spanish economy by accounting information. In this methodology we have obtained how to explain the equilibriums in economy of Spain, and it has been chosen an estimation of the Spanish economy considering the response of enterprises as a random variable. When indicator L is an umbrella over indicator G the economy policy generates employment.
Acknowledgements
The author acknowledges Miguel Pérez Raga for his contribution to the English version of this paper.