Methodology for Evaluating and Monitoring of Waterworks Performance Efficiency —Part 1: Methods and Testing Procedures ()
1. Introduction
The methods currently used for the evaluation of waterworks performance are based on monitoring the quality of purified water, visual observation of floc formation and in some cases particle counting using different types of electronic counters. Generally, these methods are not particularly suitable for analysing the waterworks performance which is needed for the purpose of:
• optimising performance of existing waterworks;
• providing data and information for the upgrading of existing waterworks;
• identifying bottlenecks limiting the quality of purified water produced and/or the capacity of waterworks;
• providing comprehensive information needed for the design of new waterworks.
This is because they do not characterise the substance of single processes and do not allow assessment of the purification process in its overall complexity. These shortcomings are taken care of by the methodology described in the paper.
This paper deals with the methods and testing procedures for routine monitoring of waterworks performance as well as for providing the information required for optimization of the design and operation of the waterworks, including commissioning and acceptance testing. It also deals with testing procedures which were specifically developed for this purpose. Lastly, this paper provides a few examples of the practical application of the methodology.
A follow-up paper will deal with the determination of the filterability of flocculent suspension by the test of filterability. The purpose of the test of filterability is to establish the properties of the formed suspension with respect to its filtration characteristics. It should be noted that the property of suspension is influenced by the destabilisation agent as well as the physical-chemical conditions of the resulting formation of the flocculent suspension.
The methodology described in this paper was developed some 35 years ago [1] [2] . Regrettably it was never published in an English journal. Consequently, this methodology remains unknown to water purification engineers worldwide. It is therefore, the objective of this paper to remedy the situation by introducing this methodology to the water purification fraternity worldwide. The application thereof is now as relevant as it was three decades ago.
The methods and testing procedures of this methodology are founded on the study of the dynamics of the water purification processes and are based on the conception of the mechanisms of the formation of aggregates and their separation [1] [3] . These methods and testing procedures take into consideration the complexity of the purification process in its entirety and the mutual interdependence of the single processes in the units operation of the waterworks. The methodology was used extensively in the past [4] -[6] and was found to be an invaluable tool for the comprehensive evaluation of a waterworks performance, as it makes possible the following:
• Evaluation of jar tests to establish the optimised reaction conditions (most efficient destabilisation agent to be used, range of its dosage and expected process range of pH) under which the water is treatable to its best attainable quality.
• Comprehensive commissioning and acceptance testing of individual units operation and the waterworks in its entirety to verify whether all project objectives are met and complied with as well as the identification of possible bottlenecks.
• Evaluation of the waterworks performance under different chemical-physical conditions of operation including seasonal water quality changes and the effect of suspension formed on the actual quality of purified water and its settleability and filterability.
• Comparison of performance of different waterworks.
• Obtaining data required to inform upgrading of an existing works as well as for designing of a new waterworks. The purpose of such an investigation is for the design of optimised processes and reaction conditions which will ensure that water is purified to its best attainable quality in the most efficient and economical manner.
The term coagulation does not reflect all of the partial processes taking place during the transformation of colloidal impurities into readily separable flocs. This is due to the variety of mechanisms that may be engaged in the transformation of particles of impurities into separable aggregates with a hydrolysing coagulant. Therefore, it is more precise to call this process ‘aggregation’ and to call the flocs formed ‘aggregates’, as well as to refer to the hydrolysing coagulant as the ‘destabilisation agent’. It is for this reason that the terms aggregation, aggregates and destabilisation agent are used in this paper.
Floc Formation and Their Separation
It is common knowledge that the quality of purified water attained by an applied purification technology is often below that determined by jar tests which show the best attainable quality. There are a number of reasons for this, some of which are associated with the purification process that takes place under sub-optimal reaction conditions [3] . Other reasons however are associated with the shortcomings inherent in the unit operation design [5] [7] [8] . Theory assumes that the final products of the flash mixer, i.e. unit operation for dispersion and homogenisation of the added destabilisation agent with water, are destabilised particles. The theory further assumes that the final products of flocculation taking place at a high intensity agitation are micro-aggregates, whereas the products of flocculation taking place at a low intensity agitation are the macro-aggregates. However, these theoretical assumptions are seldom fully achieved under operational conditions and the individual processes for the formation of aggregates move into subsequent units operation, where optimum conditions for such a process do not exist.
2. Methods of Evaluation
The methodology for the evaluation of waterworks performance can be grouped into the following three categories:
• Evaluation of the treatability of the water;
• Evaluation of the separation characteristics of the suspension:
¯ Determination of sedimentation characteristics (settleability) of the suspension;
¯ Determination of filtration characteristics (filterability) of the suspension.
• Performance efficiency of the waterworks.
3. Evaluation of Treatability of Water
The treatability of water can be defined as a level of quality to which the water is treatable under applied conditions. The best attainable treatability of water is defined as the level of the best quality to which water is treatable. This is influenced by the character and concentration of impurities as well as the chemical-physical conditions of the purification process. The best attainable treatability of water is achieved under the optimised reaction conditions commonly established by jar tests. The optimised reaction conditions means the most efficient destabilisation agent, its optimised dosage and optimised reaction pH at which the best overall quality of purified water is produced [8] .
The determinants of water quality are differentiated as follows:
1) Qualitative-describe the quality of the raw water and the purified water;
2) Technological-describe the raw water quality parameters which are considered important with respect to the most effective water purification processes to be applied.
The treatability of water is evaluated by those determinants the concentration of which changes during the purification process. Such determinants are: cation of destabilisation agent (Al or Fe), acid neutralisation capacity (alkalinity), DOC, TOC or CODMn, colour, turbidity, content of suspended solids, pH, type and count of microorganisms, and other determinants the removal of which is the purpose of the purification process.
3.1. Degree of Destabilisation
The basic criterion of destabilisation of the particles of impurities is the degree of destabilisation δ [2] . It characterizes the state of destabilisation of the particles of impurities achieved by the system at any point in the purification process. It is defined as the ratio of the number of destabilised particles ND to the total number of aggregately-stable (non-separable) particles that are initially present in the raw water NS. In order to simplify calculation the number of particles is substituted with concentration of the relevant determinant. The degree of destabilization is calculated from the total concentration of all aggregately-stable particles in the raw water C0F from which the concentration of remaining non-destabilised particles measured at the point of investigation CF is subtracted and the initial total concentration of all aggregately-stable particles in the raw water C0F as follows:
 (1)
(1)
The degree of destabilisation is influenced by the state of the raw water at the moment of addition of the destabilisation agent. It is influenced by the composition of the impurities, destabilisation agent used and its dosage, reaction pH, water temperature and efficiency of dispersion and homogenisation of the agent with the water.
The value of the degree of destabilisation is dependent on the efficiency of chemical reactions resulting in the destabilisation of the particles of impurities. It may have a positive or negative value. δ = 0 always corresponds to the raw water. δ = 0 characterises the moment of addition of the destabilisation agent to the water when the destabilisation process has not yet commenced and when none of the non-separable particles has been destabilised.
The positive δ value varies between 0 and 1 and reflects the progress in destabilisation of impurities. The higher the value of δ the greater is the progress of destabilisation. δ = 1 corresponds to the state when destabilisation process is completed and all particles of the impurity are destabilised. When δ = 0 none of the initial aggregately-stable particles are capable of aggregation, and therefore not removable from the water. When δ = 1 all the aggregately-stable particles are destabilised and thus capable of aggregation and subsequent separation.
The negative δ value reflects the situation in which the process of destabilisation has been reversed by chemical interference, i.e. the extent by which the quantity of non-separable particles has increased in comparison to that of the raw water [9] . The higher the negative value of δ the more severe is the adverse effect of chemical interference in the system.
3.2. Degree of Aggregation
The basic criterion of aggregation is the degree of aggregation of particles αA [1] [3] . It characterizes the state of aggregation of particles achieved by the system at any stage and at any point in the purification process. It is defined as the ratio of the number of aggregated (separable) particles NA to the total number of all particles N0 that are initially present in the raw water. As already mentioned in the foregoing the number of particles is substituted by the concentration of the relevant determinant. The degree of aggregation is calculated from the total concentrations of all particles C0 in the raw water, from which the concentration of remaining non-separable particles measured at the point of investigation CF is subtracted and the initial total concentration of all particles C0 in the raw water as follows:
 (2)
(2)
The changes in the degree of dispersion are the result of the aggregation of particles. The degree of aggregation changes as the aggregation of particles progresses during the purification process. It is most significantly influenced by the degree of destabilisation and the conditions of agitation under which the aggregation process takes place.
The value of αA expresses the aggregation efficiency achieved by the system at the point of testing. As the aggregation of particles progresses the degree of aggregation increases from 0 to 1 over time. αA determined in the raw water expresses the extent to which the particles of impurities are capable of separation. αA = 0 means that none of the particles is aggregated and corresponds to the moment when the destabilisation agent is added and aggregation is not yet initiated. αA = 1 reflects the situation when all particles are aggregated, i.e. aggregation is completed. When αA = 0 no particles are separable and when αA = 1 all particles are relatively easily separable from the water with commonly used separation methods. It follows from the theory of the aggregation process that the number of particles decreases and the degree of aggregation αA increases as the aggregation process progresses. The higher the value of αA the higher is the aggregation efficiency attained by the system.
In calculating αA the efficiency of separation processes is not being considered because all particles capable of separation are removable also by centrifuging. Therefore, the magnitude C0 is always considered in Equation (2). The magnitude of C0 is always measured in the raw water. However C0 for the initial concentration of the cation of the hydrolysing agent (Al, Fe) is measured in the dosed water after homogenisation of the agent with the water. The concentration CF is measured at the point where the progress in aggregation of impurities is to be established.
The degree of aggregation is used for determining the effect of different conditions of agitation on the course of aggregate development. It can also be used for determining the effect of certain design features and arrangements of waterworks such as weirs, pipelines, flumes, etc. on progress of aggregation.
3.3. Determination of Quantity of Non-Separable Particles
To determine the degree of destabilisation and the degree of aggregation it is necessary to measure the quantity of non-separable particles of the determinant used in both the raw water and the purified water. For the determination of the quantity of non-separable of particles all separable particles must be removed from the water.
Sedimentation of all separable particles in a gravity field would require an extremely long period. Therefore, sedimentation in a gravity field is replaced with sedimentation is a centrifugal field. Using a Labofuge 1 laboratory centrifuge with an effective glass container capacity of 80 ml and not considering the influence of extreme water temperatures the tested sample is centrifuged at 4200 RPM for 5 minutes [9] . A sample of the centrate is then slowly pipetted out of each centrifuged sample for the measurement of concentration of the determinant. This is done in such way that the centrifuged sediment is not being disturbed.
The initial concentration of the aggregately-stable particles C0F is measured in the raw water and the concentration of the non-separable particles CF remaining in the purified water at the point of testing. The quantity C0F is measured in the centrate (the supernatant) of centrifuged sample of the raw water and the quantity of CF in the centrate of a centrifuged sample of water taken at the point of testing [2] [7] [10] .
4. Aggregates Formed
The removal of impurities from water necessitates change in their degree of dispersion. This is accompanied by changes in both their size and size-fraction distribution. These changes can be used as a measure of efficiency of the suspension forming processes. The changes in size-fraction distribution of aggregates formed are determined by the test of aggregation.
4.1. Test of Aggregation
Based on sedimentometric analyses of the aggregates formed four technologically significant size-categories are distinguished, namely [1] :
• Macro-aggregates (MA)
• Micro-aggregates (MI)
• Primary aggregates (PR)
• Non-aggregated particles (NA).
These size-categories of aggregates are correlated with their ranges of sedimentation velocities in Table 1 and are characterised and determined as follows:
Macro-aggregates (MA) are the aggregates of largest size and their diameter exceeds 10−3 m. They are formed from micro-aggregates (MI). The structure of the MA is loose, random and their density approaches that of the adjacent environment. Division of aggregates into MA and MI has a more technological than physical significance. The MA aggregates are separated by plain sedimentation within a period of 5 minutes. The portion of MA in the system is calculated as the ratio of the difference between the initial total concentration of determinant at the beginning of sedimentation C0 and that measured in a sample taken after 5 minutes of sedimentation C5 (C0 – C5) to its initial total concentration at the beginning of the purification process C0:
 (3)
(3)
Micro-aggregates (MI) are the aggregates resulting from aggregation of the primary aggregates. The MI represents the intermediate stage in the formation of macro-aggregates. Their diameter is between 10−4 < d < 10−3 m. In comparison to the primary aggregates the structure of MI is looser and due to that, their density is significantly lower than that of the particles of the impurity. They move only by orthokinetic movement. The MI aggregates reflect light beams and hence they produce turbidity of the water. The MI aggregates are separated by

Table 1. Size and sedimentation velocity for aggregates of different size-categories.
plain sedimentation during a period between 5 and 60 minutes. The portion of MI in the system is calculated as the ratio of the difference between concentrations of determinant measured in samples taken after 5 and 60 minutes of sedimentation (C5 - C60) to its initial total concentration at the beginning of the purification process C0:
 (4)
(4)
Depending on the purpose and the circumstances of testing, the fraction of micro-aggregates combined with macro-aggregates can be measured as MA + MI. In such a case the sample after 5 minutes sedimentation is not taken.
Primary aggregates (PR) are the aggregates resulting from aggregation of destabilised particles. Their diameter is between 10−6 < d < 10−4 m. Their size range places them at the boundary between perikinetic and orthokinetic aggregation and hence smaller PR are influenced by perikinetic motion and larger PR by orthokinetic movement. The structure of PR is relatively compact and their density does not differ too much from that of particles of impurities. The formation of PR is accompanied by changes in the optical properties of water. The PR aggregates deflect a light beam and produce opalescence of the water. The PR aggregates are separated from the system by plain sedimentation in a period longer than 60 minutes. The portion of PR in the system is calculated as the ratio of the difference between concentrations of determinant measured in samples taken after 60 minutes of sedimentation and that measured in the centrate of the same sample (C60F) obtained by centrifugation (C60 - C60F) to its initial total concentration at the beginning of the purification process C0:
 (5)
(5)
Non-aggregated particles (NA) are the non-destabilised particles of impurity and the destabilised but nonaggregated particles as well as particles of destabilisation agent. The size of NA particles does not exceed 10−6 m. These particles cannot be separated from the system not even during infinitely long sedimentation. The residual portion of NA in the system is calculated as the ratio of concentration of determinant measured in the centrate of the sample of water taken after 60 min sedimentation from which all aggregated particles were removed by centrifugation (C60F) to its initial total concentration at the beginning of the purification process C0:
 (6)
(6)
and
 (7)
(7)
The test of aggregation determines size-fractions of aggregates at any point throughout the waterworks. This enables one to evaluate changes in the size-fractions of aggregates as the development of aggregates progresses. Consequently, one can evaluate the influence of different chemical and physical parameters on the development of aggregates being formed. These influences include the effect of different velocity gradients, the duration of their action, the uniformity of distribution of the velocity field and various plant configurations on the breakdown of aggregates and their re-aggregation, etc.
The test of aggregation is also used for the evaluation of the effect of certain design features and arrangements of waterworks, such as weirs, pipelines, flumes, etc. on the formation of aggregates including the breaking-up of the already-formed aggregates and their re-aggregation.
The test of aggregation is carried out in beakers used for jar tests. The samples of water are pipetted out from a depth of 40 mm below water level in the beaker. This eliminates the effect of vertical aggregation.
The test of aggregation provides important data for evaluating the similarity of pilot and full scale operation. It is a decisive tool for the evaluation of tests aimed at determining the most suitable combination of velocity gradients and duration of high and low intensity of agitation.
4.2. Test of Sedimentation
The suitability of the formed suspension for separation by sedimentation and its efficiency with respect to the surface hydraulic loading of the sedimentation tank is evaluated by the test of sedimentation. In contrast to the test of aggregation, the test of sedimentation includes the influences of vertical aggregation [11] taking place during settlement of the aggregates in the sedimentation tank.
The test of sedimentation is carried out in a sedimentation column [1] . This column is 2000 mm long. It is equipped with an inlet flap valve for taking a sample of water at the testing point in the works, and with two sampling points located at depths of 900 and 1700 mm from the bottom of the column (Figure 1). The water samples are taken at preselected time intervals for measuring Al or Fe concentration. The content of suspended solids, turbidity, etc. can also be measured in these samples.
During the sedimentation test it is important that the formed suspension contained in the water is not broken up when the flocculated water fills the column. Therefore, the column should be very slowly and carefully submerged into the water at the point of testing in such a way that the suspension is not affected. Therefore, pouring of flocculated water is not acceptable and water must enter the column very slowly from the bottom. Detail A in Figure 1 shows a possible arrangement of the bottom valve.
The sedimentation velocity of the aggregates is calculated according to the following relationship:
 (8)
(8)
where us—sedimentation velocity, L—sedimentation trajectory, T—time period of sedimentation.
The dependence of the measured concentrations on the calculated sedimentation velocities is plotted graphically. From the graph so obtained for different aggregate-size fractions and their sedimentation velocities, the sedimentation efficiency is calculated from the law of surface loading [12] [13] as follows:
 (9)
(9)
where hs—efficiency of sedimentation, us—sedimentation velocity, u0—hydraulic surface loading, p—concentration ratio of the particles having sedimentation velocity lower than us to the total quantity of particles, p0—p for sedimentation velocity u0.
The efficiencies so calculated are then used to create curves illustrating the percentage of suspension present in narrow intervals of sedimentation velocities.
4.3. Evaluation of Filtration Characteristics of Suspension
1) Operational Evaluation of Deep-Bed Filtration
The performance of a filtration plant and the course of depletion of sludge holding capacity of a filter bed can be evaluated by recording changes in pressure loss and penetration of cation of destabilisation agent through the filter bed against filtration time. In the preselected time intervals (more frequent at the beginning and at the end of the filtration cycle than in the middle of the cycle) concentration of determinants measured in samples of water and changes in pressure loss are monitored.

Figure 1. Arrangement of sedimentation column for the test of sedimentation.
The efficiency of a filter is also evaluated by determining the quantity of suspension intercepted in the filter bed over a filtration cycle. Two of the following three methods are usually used at the same time:
a) Quantity of suspension retained in the filter bed over the filtration time. This is derived from the difference between concentrations of suspension measured at the inlet and outlet of the filter over the filtration time.
b) Quantity of retained suspension derived from measuring concentrations of suspension in backwash water at predetermined intervals over the backwashing time.
c) Quantity of retained suspension determined from samples taken at different filter bed depths before and after backwashing.
The method c) is also used for the evaluation of filter backwashing efficiency.
2) Test of Filterability
The filterability of suspension and its changes due to the changed conditions of its formation can be evaluated by the test of filterability using a filtration element with a thin filtration layer. This test will be more fully described in Part 2 of this paper.
5. Performance Efficiency of Waterworks
The evaluation of the waterworks efficiency is based on the evaluation of separation efficiency of the individual separation plants and the waterworks as a whole.
From the process point of view, two separation efficiencies are distinguished [1] [2] [7] , namely the attained (φ) and the attainable ( ) efficiency.
The attained separation efficiency φ expresses the efficiency of the separation plant that is achieved under chemical-physical operating conditions. It is defined as the ratio of the number of particles removed to the initial total number of particles initially contained in the raw water. Substituting the number of particles with concentration of determinant the attained separation efficiency is calculated according to the relationship
 (10)
(10)
where φ—the attained separation efficiency of the separation plant or process, C0—the concentration of the determinant measured at the beginning of the separation process or at the inlet to the separation plant, CE—the concentration of the determinant measured at the end of the separation process or at the outlet from the separation plant.
The attainable separation efficiency  expresses the efficiency of the separation plant that is achievable under optimum conditions. The value
  is influenced by the efficiency of the preceding suspension forming processes. It is defined as the ratio of the number of particles that is removable (capable of separation) to the total number of particles initially contained in the raw water. The attainable separation efficiency is calculated according to the relationship
 (11)
(11)
where —attainable separation efficiency of the separation plant, C0—the concentration of determinant measured at the beginning of the separation process or at the inlet to the separation plant, CEF—the concentration of the non-aggregated portion of the determinant measured in the centrate of the sample in which quantity CE was measured.
The difference between separation efficiency φ and  reflects inefficiency in the performance of the separation plant. This can be caused by the character and the quantity of the formed suspension, unsuitable design, inadequate operational conditions and other influences which are not compatible with the conditions required to optimise the purification process.
Comparison of Equation (11) with Equation (2) shows that the attainable separation efficiency  equals to the degree of aggregation αA reached at the outlet from the separation plant. This is because only the particles which aggregated are separable.
When the separation efficiencies φ and  are used to determine the efficiency of the separation plants, the value C0 is measured at the inlet to the separation plant and the values CE and CEF at the outlet from the separation plant.
When the separation efficiencies φ and  are used to determine the overall efficiency of the works, the value C0 is measured in the raw water. However, C0 of the cation of the hydrolysing agent is measured after homogenisation, and the CE and CEF values are measured at the outlet from the last separation plant.
The attained separation efficiency φ determined in jar tests reflects the process efficiency of the sedimentation process. The attainable separation efficiency  reflects the process efficiency after filtration. Since centrifugation does not simulate the full effect of the aggregation process taking place in the filter bed, the attainable separation efficiency
  is usually slightly lower than that actually attainable under operational conditions in the waterworks.
The ratio of the attained and attainable separation efficiencies is the measure of the separation efficiency of the plant or the system F. It is calculated according to relationship
 (12)
(12)
The measure of the efficiency of the separation unit or system F is defined as the ratio of the number of the particles which are separated by the system to the number of particles that are capable of separation under ideal conditions. Its value increases with increasing efficiency of the separation plant. The value of F = 1 corresponds to the optimum situation when separable suspension is totally removed.
6. Operational Monitoring and Evaluating of Waterworks Performance
The prerequisite for purifying water to the best attainable quality is to purify it under the optimised reaction conditions. Such conditions are determined by jar tests carried out daily.
The basic testing procedures include the following:
• Determination of degree of destabilisation at all significant process points of the works.
• Determination of degree of aggregation at all significant process points of the works.
• Determination of test of aggregation at all significant process points of the works.
During wider operational evaluation of waterworks performance, for instance during commissioning and acceptance tests, it is also necessary to establish data which is independent of raw water quality and type and dosage of destabilisation agent, such as [7] :
• Total flow rate through the works and accuracy of flow division to each process train of the works in accordance with design intention. This should be repeated for different total flow rates through the works.
• Hydraulic characteristics of individual units operation.
• Dispersion and homogenisation efficiency of the flash mixing units operation and distribution of concentration of agent added (such as cation of destabilisation agent) across and along the water profile in different time intervals. Evaluation should include the coefficient of variation from average.
• Mean velocity gradients of high and low intensity agitation – these can be calculated from data measured at waterworks [14] .
• Determination of efficiency of each separation plant.
• Evaluation of operation of filters.
• Efficiency of filter backwashing.
The plant commissioning should be carried out during different seasons to evaluate the effect of seasonal changes in water quality on the performance efficiency of the works.
In addition to the above data the following is required to provide information for the upgrading of a waterworks:
• The testing used for operational monitoring and evaluating of performance efficiency.
• Determination of the most efficient destabilisation agent and its optimized reaction conditions with respect to raw water quality.
• Evaluation of the effect of various conditions of agitation on the formation and properties of suspension formed.
• Determination of sedimentation characteristics of suspension by the test of sedimentation.
• Determination of the filtration characteristics of the suspension by the test of filterability.
A report on each operational evaluation must include full analyses of the raw water and results from jar tests. A report from a few days of testing must contain results from at least the jar tests carried out at the beginning and at the end of evaluation testing.
7. Examples of Practical Application of the Methodology
This methodology was used for comprehensive evaluation of performance efficiency of many waterworks in Southern Africa. Some of them are presented in [5] . A few examples are shown in Table 2 and Table 3 and in Figure 2.
From Table 2 [4] the following is evident:
• The treatability of water which can be attained using a polymeric coagulant was found to be poor in comparison with that produced with aluminium sulphate. Even though the sources of raw water are different both waters are of similar quality and contain the same quantity of non-separable turbidity producing particles (C0F = 1.8 NTU). Therefore, the results in Table 2 are compatible. When using a polymeric coagulant a higher concentration of the non-aggregated turbidity-producing particles of impurities was found in the purified water. This is evident from comparison of the degree of destabilisation δCPE = 0.58 and δAl = 0.94 achieved by these respective agents.
• The filtration plant filtering the polymeric coagulant formed suspension was not working efficiently as the filtrate contains a high concentration of the separable suspension ΔCF = CF − CFF = 1.03 NTU in comparison to ΔCF = 0.06 NTU attained with aluminium sulphate. This high ΔCF is the result of inefficient backwashing which is exacerbated by the use of polymeric coagulant [4] [15] .
The results in Table 3 compare the performance efficiency of different clarifiers installed at the same waterworks and purifying the same raw water. Each clarifier received a dosage of the same destabilisation agent which was adequate to purify water approximately to the same residual turbidity in the clarifier outlet. As can be seen from this Table the performance efficiency of individual systems differ quite considerably when comparing both the dosages and the residual turbidity produced only by the non-separable turbidity producing particles (CEF). The best results were obtained with the HR clarifier system even though it was operated at more than 10 times the hydraulic loading of the other clarifiers and about 13% lower dosage of destabilisation agent. The reason for this is the process design of the HR clarifier in which processes of both physical and chemical conditions of floc formation are optimised [6] [8] [16] -[19] .
The hydraulic jump (height of about 600 mm) improved the efficiency of the destabilisation process in the Pretreator clarifier system quite significantly even though the water that entered the hydraulic jump had already been flocculated for about 20 minutes in a hydraulically operated around-end-baffle (zig-zag) type flocculation plant.
Figure 2 [5] illustrates the results of the test of aggregation from jar tests using polyaluminium chloride (PACl) as the destabilisation agent. This Figure compares quantities of various aggregate size-categories formed and expressed by two different determinants namely cation of destabilisation agent and turbidity. The lowest concentration of the non-aggregated particles (NA) determines the optimum dosage of the agent with respect to that
Table 2. The effect of different coagulation agents on waterworks performance efficiency evaluated by turbidity (NTU).
Table 3. Comparison of performance efficiency of different type of clarifiers installed in the Bethlehem waterworks [6] [19] .
*Clariflocculator and HR clarifier outlets combined prior to filtration; **SF-A110 dissolved in tap water.
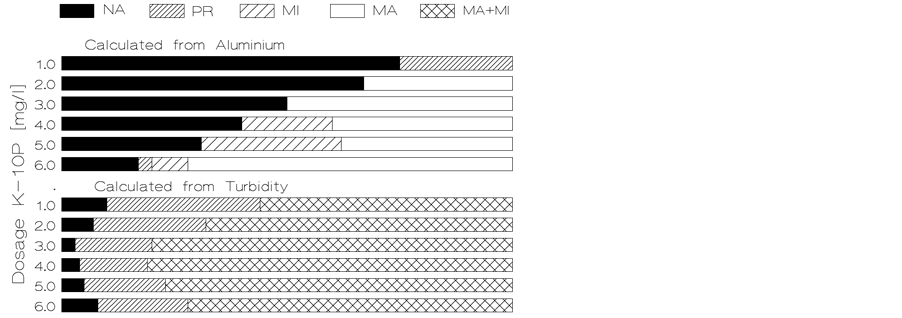
Figure 2. Comparison of optimum destabilisation agent dosage for different determinants of the same water.
determinant. In this figure, each of these two determinants has a different optimum dosage. For turbidity the optimum dosage is 3 mg/l. For residual aluminium its optimum dosage cannot be determined because its residual value continuously decreases with increasing dosage over the full range of dosages applied as pH is moving towards its optimum value. Its optimum dosage exceeds 6 mg/l.
It is evident from Figure 2 that using one determinant only for the evaluation of jar tests could result in the determination of inappropriate dosages. The use of one determinant can only determine optimum dosage with respect to that determinant. Figure 2 highlights the need to use more determinants for evaluation of jar tests in order to establish the optimised dosage at which all the undesirable pollutants are removed most effectively and remain within their permissible limits. The cation of the destabilisation agent, turbidity and dissolved organic matter are the determinants which are essential for determining the optimized dosage of destabilisation agent.
8. Conclusions
1) This methodology for the evaluation of the waterworks performance efficiency is based on the following:
Ø Evaluation of the treatability of water by:
v Degree of destabilisation (efficiency of the destabilisation process);
v Degree of aggregation (efficiency of aggregate formation).
Ø Evaluation of the separation characteristics of suspension by:
v Determination of sedimentation characteristics of suspension by:
§ Test of aggregation (size distribution of the aggregates formed);
§ Test of sedimentation (sedimentation efficiency for different surface loadings).
v Determination of filtration characteristics of suspension by:
§ Evaluation of deep-bed filtration operation;
§ Test of filterability (this test is dealt with in a follow-up paper).
Ø Performance efficiency of waterworks by:
v Attained separation efficiency;
v Attainable separation efficiency;
v Measure of treatment process efficiency.
2) The aggregation process produces separable aggregates and leaves a residual fraction of particles of impurities in the purified water which were not destabilised, aggregated and removed under the reaction conditions applied. The ratio of the residual non-separable particles to separable particles determines the efficiency of the separation processes. This affects the quality of the water produced by the technology installed and under the reaction conditions applied. The lower the residual fraction of the non-separable particles remaining in the purified water the higher is the efficiency of the destabilisation process attained by the works under the applied reaction conditions. This is evaluated by the degree of destabilisation.
3) The degree of destabilisation is a particularly suitable tool for evaluating the attainable treatability of water and for determining the effect of different agents and reaction conditions on the destabilisation process and on the re-stabilisation of the already destabilized particles, i.e. changes in the quantity of the non-separable particles present in the system. In principle, the value of the degree of destabilisation is a measure of the treatability of water attained by the system under the applied reaction conditions.
4) The degree of destabilisation δ is used for:
• the selection of the most efficient destabilisation agent;
• the optimization of the reaction conditions;
• the determination of attained and attainable treatability of water;
• the determination of the best attainable treatability of water.
5) The degree of aggregation αA is a parameter used for measuring progress in the formation of aggregates. It can be used in conjunction with the test of aggregation to optimise the design of the units operation for the formation of aggregates.
6) The degree of destabilization δ is proportional to the purification process efficiency whereas the degree of aggregation αA is proportional to both the aggregation and the separation efficiency of the system.
7) The degree of destabilisation δ and the test of aggregation αA are particularly useful indicators for the evaluation and comparison of waterworks performance efficiency and for the identification of bottlenecks inherent in the plant design as can be seen from Table 2, Table 3 and Figure 2.
8) Four different size categories of aggregates are distinguished, namely:
Ø macro-aggregates MA;
Ø micro-aggregates MI;
Ø primary-aggregates PR;
Ø non-aggregated particles NA.
The presence of these aggregate size-categories is determined by the test of aggregation.
9) The test of aggregation excludes the effect of vertical aggregation. It is used to:
Ø Appraise and compare the effect of the aggregation process taking place under laboratory conditions, in the pilot plant and under full scale operation.
Ø Identify bottlenecks in the process arrangement of the waterworks.
Ø Evaluate performance efficiency of separation units by determining the quantities of aggregate of different sizes-categories remaining in the water leaving the separation unit(s).
10) The test of sedimentation is used to assess the suitability of formed suspension for sedimentation and the efficiency of sedimentation with respect to hydraulic surface loading because it includes the effect of vertical aggregation. This test enables one to assess the effect of variations in the chemical-physical conditions under which aggregates are formed with respect to sedimentation. It is also used to enable the optimisation of such conditions in order to improve the efficiency of sedimentation.
11) The attained and attainable separation efficiencies are used to appraise the overall performance efficiency of the waterworks.
12) The measure of the treatment process efficiency is used to evaluate the overall efficiency of the waterworks and to compare the performance efficiency achieved by different waterworks.