Shallow Seismic Refraction, Two-Dimensional Electrical Resistivity Imaging, and Ground Penetrating Radar for Imaging the Ancient Monuments at the Western Shore of Old Luxor City, Egypt ()
1. Introduction
The old Luxor City is one of the famous archeological cities over the world. It is located on both sides of River Nile at about 60 Km from Qena city. The western side of this city contains famous temples, Kings and Queens Valleys and prospected uncovered ancient monuments and antiques. Egypt is considered as “Father of History and Mother of Civilization”, is the home to one-third of the world’s ancient monuments. The study area is the suggested location for establishing the area behind Memnon’s statuses in the west shore of the Luxor City; it covers an area of about 1200 m2. It is portrayed between latitudes 25˚43'13.35" to 25˚43'20.94"N and Longitudes 32˚36' 21.72" to 32˚36'37.42" E (Figure 1). The city, as one of the famous archeological one over the world, is supposed to be a subject of archeological survey missions.
During the last decade conventional geophysical methods are integrated with high-resolution techniques like ground penetrating radar, electrical tomography and seismic refraction (Tsokas et al., 1995; Vafidis et al., 1995; Pipan et al., 1996; Tsokas et al., 1997).
In this regard, the present geophysical survey at the suggested location of western shore of Old Luxor city, utilized two dimension electrical arrays (R2D), Shallow Seismic Refraction (SSR) surveys and Ground Penetrating Radar (GPR). Most probably, it will assist in the location of any probable interrupted or buried remains or statuses, structural features, and is capable of furnishing useful information to detect the characterization of the nature of different subsurface objects. They gave also interesting information about the geotechnical competent of the ground and some key control to the buried material with limited shape.
2. Geology Setting
2.1. Surface Geology
The study area is covered by Quaternary deposits in the form of alluvial sands, gravel, clay or silt and wadi deposits (Figure 2). In the western part of old Luxor City, which lies on the Nile bank, the sediments variety belongs to River Nile deposit sediments cover the Upper Cretaceous-Lower Eocene as well as the Pliocene-Recent sediments (El Hossary, 1994).
2.2. Stratigraphy
In dealing with the sedimentary succession present at the study area, Ahmed (1983) established the following lithostratigraphy, as compiled from the proposed lithostratigraphic classifications of Ghorab (1956), Youssef (1957) and Said (1961, 1962).
The age of the different lithostratigraphic units was assigned after Abdel Razik (1974) and Faris (1974). These beds overlie directly the peneplained surface of the basement complex. The Pleistocene and Plio-Pleistocene sequences of the Nile valley have been described in detail by Sandford (1929, 1934) and Ball (1939).
The Nile has passed through five episodes since the valley was cut down in late Miocene time. Each of these episodes was characterized by master river system. Towards the end of each of the first four episodes (the last is

Figure 1.General location map of the study area
still extent) the river seems to have declined or ceased entirely to flow into Egypt. These five rivers are termed as: (1) Eonile (2) Paleonile (3) Protonile (4) Prenile (5) Neonile (Said, 1961).
3. Electrical Resistivity Imaging Survey (R2D)
The greatest restriction of the resistivity sounding method is that, it does not take into description horizontal changes in the subsurface resistivity. The 2-D imaging survey conquers this problem, where the resistivity changes in the horizontal direction as well as in the vertical direction along the survey line. Therefore, the 2-D geo-electrical imaging technique was selected for the survey. While, the Wenner array gives the smallest number of possible measurements compared to the other common arrays (Griffiths & Barker, 1993), also it competent to work in noisy fields and when good vertical resolution is required. The resistivity data was interpreted using the computer software RES2DINV (1998), edited in 1998 (Loke, 2000, 2002), distributed over the area behind Mammon’s statues (Figure 3) of suspicion that might have archeological remains. The survey has been practiced using a 48 multi-electrodes system connected to SYSCAL R2 resistivity meter through a multi-core cable. A built-in microcomputer together with an electronic switching unit is used to automatically select the relevant four electrodes for each measurement.
(R2D) Data Interpretation
The resistivity data was interpreted using the computer software RES2DINV (1998), edited in 1998, (Loke, 2000, 2002) to estimate:
1) The different layer parameters such as (depth, and resistivity under each electrode).
2) The electric cross sections along each recorded profile in the study area.
According to the general view up of the constructed cross sections, two zones of layering could be defined in the study area. The first zone is notable by normal layering with two layers as in profiles 1, 2, 6, 7, 8, 9, 10, 11, and 12. Figure 4 shows the geoelectric cross section constructed over profile 1 as an example for this zone. Geoelectric profile No.1 with 48 electrodes and 3 m electrode spacing has been carried out to verify the anomalies found by SSR. We here found resistivities between 43 and 94 Ohm/m. From the beginning of the profile to 48 m and 84m relative low resistivities at 4 m depth and at 8 m depth are observed. This low resistivity may be due to clay bed or weathered clay bed. The second zone includes the three rest of the measuring lines 2, 3, and 4. Figure 5 shows cross section over profile 3 as an example of the second zone. Geoelectric profile No. 3 with 48 electrodes and 3 m electrode spacing has been carried in the study area. Relatively high resistivity value of 314 Ohm.m. observed at 3.8 m depth observed at a distance between 60 m and 87 m from the beginning of the profile. This highly resistive object is located between two low resistivities zones a. This profile is remarkable by appearing of a third layer. This third layer is attributed to a very high resistive body; since we think it can be bu-

Figure 3. Location map of the study area shows R2D cross-sections and SSR profiles.
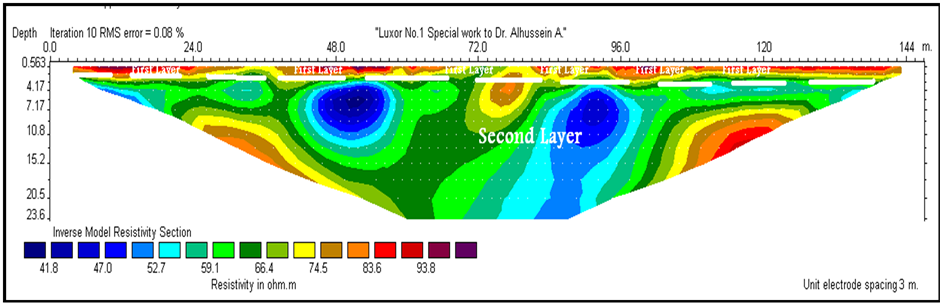
Figure 4. Geoelectric cross section along profiles 1 as an example for the two layers zone.

Figure 5. Geoelectric cross section along profiles 3 as an example for the three layers zone.
ried archaeological object. Therefore, it is referred to as body with a very high resistivity materials, sometimes comes invading between the first and the second layers.
4. Shallow Seismic Refraction Survey
Seismic exploration involves generation of seismic waves and recording the arrival times of these waves from the source to the series of geophones (Dobrin, 1976). According to the geometry of the wave propagation in the earth, the measuring techniques could be classified into reflection and refraction. Seismic refraction method is the most widely applied as a reconnaissance tool in newly explored areas, especially in archeological projects.
It mostly used in the mapping of the layers at shallow depth, layer thicknesses and some data about lithology can be obtained. Seismic refraction is used to evaluate the necessary parameters for sub-ground materials, or to solve the problems related to the geologic nature of sub-surfaces, mining works, and the environmental conditions overcame in the site (Sharma, 1974; Dutta, 1984). The seismic refraction data acquired along twelve shallow seismic refraction profiles spread over the same area proposed for the R2D resistivity imaging survey. The survey has been accomplished using 24 channels signal enhancement seismograph “GEOMETRICS SMARTSEIS” along 120 m length profiles (Figure 3). In the surface P and SH wave velocities have been specified. The vibration generator switched to provide the time break to the seismograph. The power of the vibration generator helping to avoid loosing of waves strength that may cause by blind layer in some condition. The low pass filter in the recording system has 7 - 10 MHz as frequency response, which is suitable for the recording condition, positioned before the analog-digital conversion circuit. Some special arrangement has done to create and detect un-noisy S-wave in the field (Figure 6), first step was to switch the vibration generator to S-wave position “To pulse in 45˚angle” in the shot point position, second step was to make hole between the first geophone and the shot point, this hole make the P-waves, which certainly will be created with S-waves, deploy in very high distributed material “air”. P-waves will be delayed and weak, so the most waves reach geophones will be S-waves

Figure 6. Velocity estimation using the slope method calculation with shot point and geophones array in field (after Basheer, 2003).
and geophones can only detect the S-wave. On the other hand, the S-waves less in values than P-waves, so it can be digitally separated by software program. The time, which was spent in the seismic survey, was 9 days (42 hours) to present twelve seismic profiles covered the spot area, which is located behind the Mammon’s statuses that lies in the western shore of old Luxor City.
The data has been treated using a computer program called SEIPEEDIT (2008) to construct the travel time curve, in which the time of the first arrival is plotted versus the geophone offset distance. The time of the first arrival and its velocity are functions of the depth of the refracted interface according to the equation
 (1)
(1)
While V is the velocity, D is the offset distance (the distance between shot point and the detected geophone), and T is the time that wave take from shot point to geophone.
The layer’s parameters (thickness, depths, and the different velocities under each geophone) have been estimated and used to construct geoseismic cross sections (Figure 4).
Seismic velocity in a geologic material is related to the low-strain dynamic modulus of the material. Soil modulus is influenced by density, confinement and cementation. Consequently, P-wave seismic velocity in a soil mass is influenced by density, confinement and cementation. Relationships between density, overburden pressure and modulus in cohesionless sands, dust, clay, and limestone have been studied and refined since at least the 1960’s. One of the older relationships (Richart et al., 1970) that results in velocity change of cohesionless soil with depth, based on changes in soil modulus that scale to the square root of the effective stress at a given soil density, is presented in Figures 11-16. The interpreted vertical velocity gradient presented in these figures matches very closely with that cohesionless soil relationship. Cohesionless material modulus manifested as seismic velocity is significantly controlled by the effective stress manifested as overburden pressure at subsurface depth. loosation is lessing material strength, and thus decreased modulus, at least partly independent of overburden pressure and subsurface depth. At shallow depths with relatively little-overburden pressure, loosation and variability can result in lower seismic velocities than would occur without variability. Seismic velocity at shallow depths can thus become an interpretation for the presence of variability and cementation (Rucker, 2000). The inspection of the constructed seismic cross sections could agree with the results obtained from the R2D results. The first zone with three seismic layers could be noticed over the seismic lines 1, 2, 6, 7, 8, 9, 10, 11, and 12. Figure 7 and Figure 8 represent the Time-Distance curve and the interpretive lithological reading respectively of profile 1 as an example of this zone. The same result for this zone could be noted too in Figure 11, Figure 13, and Figure 15) shows (P-wave velocity, S-wave velocity, and allowable bearing capacity “Qa”). The second zone with the additional a body as third layer could be seen over the measuring lines 3, 4, and 5. Figure 9 and Figure 10 represent the Time-Distance curve and lithological interpretation respectively of line 3 as an example of the second zone. Figure 12, Figure 14, and Figure 16 show the vertical distribution of (P-wave velocity, S-wave velocity, and allowable bearing capacity “Qa”) for profile no. 3 as an example of the same zone.
Last of all, a comprehensive interpretation of the R2D and the SSR data could lead to define two lateral zones (Figure 17). The first zone is marked as Zone A that covers the most of the study area. The materials at this zone are consisting of the same relatively competent material with no evidence for presenting of any buried remains underground or structures. The second zone marked as Zone B; it occupies the western portion of the area with massive and resistive material. This zone can contain archeological body or remain.
5. Ground Penetrating Radar (Gpr) Survey
A SIR-2000 (Subsurface Interface Radar) system was used with a 200 MHz antenna and survey wheel, manu-

Figure 7. Time-distance curves along profile “1”.

Figure 8. The lithological layers interpreted from the seismic data of profile 1.

Figure 9. Time-distance curves along profile No. 3.

Figure 10. The lithological layers interpreted from the seismic data of the profile 3.

Figure 11. The P-waves distribution along profile 1.

Figure 12. The P-waves distribution along profile 3.
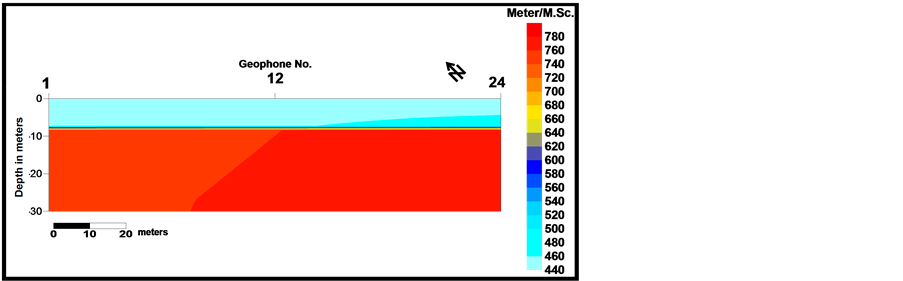
Figure 13. The S-waves distribution along profile 1.

Figure 14. The S-waves distribution along profile 3.

Figure 15. The distribution of the allowable bearing capacity (qa) along profile 1.

Figure 16. The distribution of the Allowable Bearing Capacity (Qa) along Profile 3.
factured by Geophysical Survey Systems, Inc. (GSSI). The 200 MHz antenna was chosen in order to have maximum detail/highest resolution in the uppermost 3 - 10 meters. A 40 × 30 Grid was chosen in the middle of the study area such that the anomalous feature detected from both resistivity imaging and shallow seismic refraction. Starting at the NE corner of the grid, the antenna was pulled in a north to south direction, alternating to a south to north direction. Survey lines were spaced every 0.5 m and 30 m in length. The data set for the study area was completed with 81 GPR survey lines with the survey parameter was a time windows of 120 ns, with 20 scans per meter, and 512 sample per scan.
5.1. GPR Data Processing
The radar data cannot be immediately used for interpretation and excavation. Typical GPR reflection profiles contain noise and clutter reflections that are produced by antenna “ringing”, differences in the coupling of energy with the ground, multiple reflections that occur between the antenna and the ground surface and also background “noise” (Conyers et al., 2002). The final steps in data processing involve transforming radar data into usable images. Quite often this requires considerable simplification of the complex mass of GPR data (Annan, 1999). The processing of the working areas has been conducted in two stages. The first stage was to emphasize the anomalous features which could be found on the GPR field sections. The complete GPR data set has been analyzed using REFLEXW software version 4.5 (Sandmeier, 2001) for post-processing operations. During this stage a number of processing steps have been applied including background removal to remove the horizontal lines resulting from surface reflections, band pass filter in order to eliminate high-frequency components, F-K filter and Automatic gain control.
Figure 18 shows an example of a B-scan along profile number (22). Inspection of Figure 18 shows that there is a hyperbolic reflector at a horizontal distance about 20 m from the starting point, this hyperbolic features corresponding to a depth of 2 m, and also agree with the location of the high resistive anomalous object detected on both 2-D resistivity imaging and Shallow seismic reflection.
5.2. Three Dimension GPR Images
Three-dimensional interpretations of ground-penetrating radar have been used to identify burials and other cultural features (Conyers & Goodman, 1997). In the past, the use of 3-D images has been restricted, because of the time required to conduct fieldwork over limited areas and the lack of satisfactory signal-processing software. The recent development of sophisticated software has enabled signal enhancement and improved pattern recognition on radar records.

Figure 17. Classification of the study area into two zones according to seismic velocities.

Figure 18. 2-D GPR profile along line Nr. (22).
Time slicing and topographic slicing of GPR data is relatively new, procedure in archaeology, routinely applied since the early 1990’s. GPR sections can be used to identify the structure of the subsurface objects yet we cannot easily see the plan shapes of the anomalies. By running many closely spaced parallel lines, no more than half the anticipated target width apart, we can accomplish this, obtaining a resolution both vertically and horizontally impossible with traditional techniques (namely resistance and magnetics). 3D GPR is the fastest way to accomplish complete mapping of the site.
Figure 19 shows the depth slices resulting from building three dimensional images at depth range from 3 m to 5 m. the inspection of Figure 19 shows the presence of a circular anomalous object, this object is continuously appeared in all depth slice sequences.
The position of this anomalous feature is in a good agreement with those detected by both resistivity imaging and seismic refraction.

Figure 19. GPR depth slice maps at depth range 3 m to 5 m.
6. Discussion
The present study has been conducted mainly to detect any present of ancient remnants in the area behind Memmnon’s statuses that lies in the western shore of Old Luxor City. The study involves the application of shallow geophysical techniques integrately; the first technique embrace executing 2D electrical resistivity imaging survey in the form of twelve parallel profiles using the Wenner electrode arrangement with maximum spread of 148 m, 3 m between the electrodes and 1 m interline distance using the SYSCAL R2 system. The second technique of the study depends on the analysis of the seismic refraction data acquired using twelve shallow seismic refraction profiles distributed over a suggested portion of the study area that may be contain remnants. In the survey, the velocities of the Pand S-wave have been specified. Most interpretation for seismic profiles has done on normal and middle shooting position type to avoid the effect of any blind layer that causes attenuation of waves. GPR survey was conducted to confirm the results obtained by the resistivity imaging and shallow seismic methods Through the R2D survey, the penetrated depth reached about 24 m while the penetrated depth reached with the SSR varied from 23 m under geophone no.12 of profile 3 to 27 m under geophone 21 of profile 2. The integrated results obtained from the interpretation of both of the R2D and the SSR records conducted over the suspected site in the study area could be classified lithologicaly into two zones; the first include two layers and the second zone includes the same model as the first zone invaded with a third layer. These layers arranged from the top to the bottom as Top soil layer consists of dry clay; its thickness varies between about 3.89 m and about 7.81 m, second layer consist of wetted clay and mud and finally, the third layer as a very massive body may consist of limestone or alabaster, the thickness of this layer could be estimated from profiles within 3.49 to 3.55 m.
Sometimes, its width can be guesstimate from its appearance in profiles as 3 m this layer invades between the first and the second layers. Depending of all above, and the most surprised detection that study sketched is the nature and the shape of boundaries of the hidden buried body under surface and the geotechnical characteristics of foundation material for these buried body and soil around it.
The result of inspection of the 2-D GPR profiles show that an anomalous object is buried at depth of 3 m, this anomalous feature confirm the results obtained with both the resistivity imaging and shallow seismic refraction.
7. Conclusion
Detection and localization of buried objects is one the most important target in application of shallow geophysical methods. In this work, 2-D resistivity imaging and shallow seismic refraction together with ground penetrating radar have been applied to localize buried archaeological objects in the western bank of the Nile Valley at Luxor. The results of interpretation of the integrated methods indicate that there is a buried object at a depth of about 3 m.
Following our interpretation and the probable detection of a buried object, the excavation and digging process started by the Egyptian General Authority for Antiquities with association of The European Commission working in the restoration project of Memnon’s and the Temple of Amenhotep III. They have found the body of Pharaonic statue in the form of a hippo, the statue has been known by the archaeologists as a statue of Queen Tie, wife of Amenhotep III and mother of Pharaoh Akhenaton unification, carved in Alabaster stone, with a height of 130 cm and width 73 cm and a length of 118 cm.
NOTES
*Corresponding author.