Observing the Middle Elbe Biosphere in Germany by Means of TerraSAR-X Images ()
The Elbe River Biosphere Reserve in Lower Saxony reaches from Schnackenburg in the south-east at Elbe-km 472.5 to Hohnstorf in the north-west at Elbe-km 569. The Elbe River kilometrage starts with zero at the Czech-Ger-

Figure 1. Major Rivers in Europe and the Elbe basin [1].
man state border, the numbers grow in the upstream direction on the Czech side, as well as in the downstream direction on the German side [1]. The terrain of the reserve ranges from 5 m to 109 m above mean sea level. It covers a total area of about 570 square kilometers. As a historically cultural landscape the floodplains are used in various ways with a predominance of agricultural land use [3]. The variation in the current land uses is shown in Figure 2. A big division of 68% is covered with agricultural fields and grassland areas. Numerous researchers have reflected on land use effects on the environment [4-6]. Regions around rivers, mainly the biosphere areas, must be monitored to avoid environmental problems that might affect the multiple ecological, economic and social functions of those areas [7]. Pasture land situated in the recent flood plain is affected by contaminated suspended sediment loads deposited during flooding which can cause soil, crop, and fodder pollution [8]. On the other hand arable land is a possible source for groundwater and soil pollution. This floodplain has suffered from major flooding such as the 2002 flood, which caused huge damage in hazardous areas of the Elbe catchment. Thus many studies have been conducted to improve flood risk management schemes for the Elbe basin [9-11].
Planning the development of sustainable forms of land use, the Biosphere Reserve Administration “Niedersächsische Elbtalaue” requires updated, comprehensive maps. Surveying costs and time make it difficult to produce land use maps in the field [12]. As an alternative, satellite images can be used to provide the necessary information. As countries in Europe are usually covered with clouds, RADAR images are widely used to overcome weather problems. These images attest to be functional in generating land cover maps [13]. One of the most recent effective image types is TerraSAR-X images (TSX) acquired by the German Earth observation satellite, launched 15 June 2007. It flies over the same location every 11 days. It uses an X-band SAR with 31 mm wavelength and 9.6 GHz frequency providing high-quality topographic information for commercial and scientific applications
as stated on DLR website: http://www.dlr.de/eo/en/Portaldata/64/Resources/dokumente/TSX_brosch.pdf. Farghaly et al. showed the effectiveness of TSX images in distinguishing between aquatic weed types over lake Kyoga [14]. Lohmann et al. also demonstrated the efficiency of these images in determining the different types of crops within agricultural fields near Hanover, Lower Saxony [15].
Previous studies investigated crop production and land use maps using ENVISAT imagery. Some studies recommended the use of an appropriate range of images within a time series according to the crop-calendar, to achieve better classification results than using all of the images [16]. Many fields are cultivated by more than one type of crop during the year. Thus, such succession is difficult to model because it is controlled by phenological and ecological courses. Tavakkoli et al. show that using all of the images without considering the crop calendar resulted in less producer accuracy [17]. ENVISAT images have a C-band signal which passes partially through vegetation cover. This might lead to classification errors where the signals are influenced by the soil surface under the vegetation cover [18]. Thus some studies recommend using higher frequency signals such as X-band where the signals are more reflected by the vegetation cover [16]. This enables better crop classification results where the classification process identifies patterns of similar characteristics according to the corresponding observed backscattering response and their temporal progress.
This study identifies the agricultural land uses within two study areas. These areas are located within the Lower Saxonian “Elbe River Valley Meadows” Biosphere Reserve in Germany, around two oxbows the Wehninger Werder, and Walmsburger Werder (Werder = oxbow) as shown in Figure 3. Spotlight TerraSAR-X images in dual polarization (HH, VV) are used to monitor the two
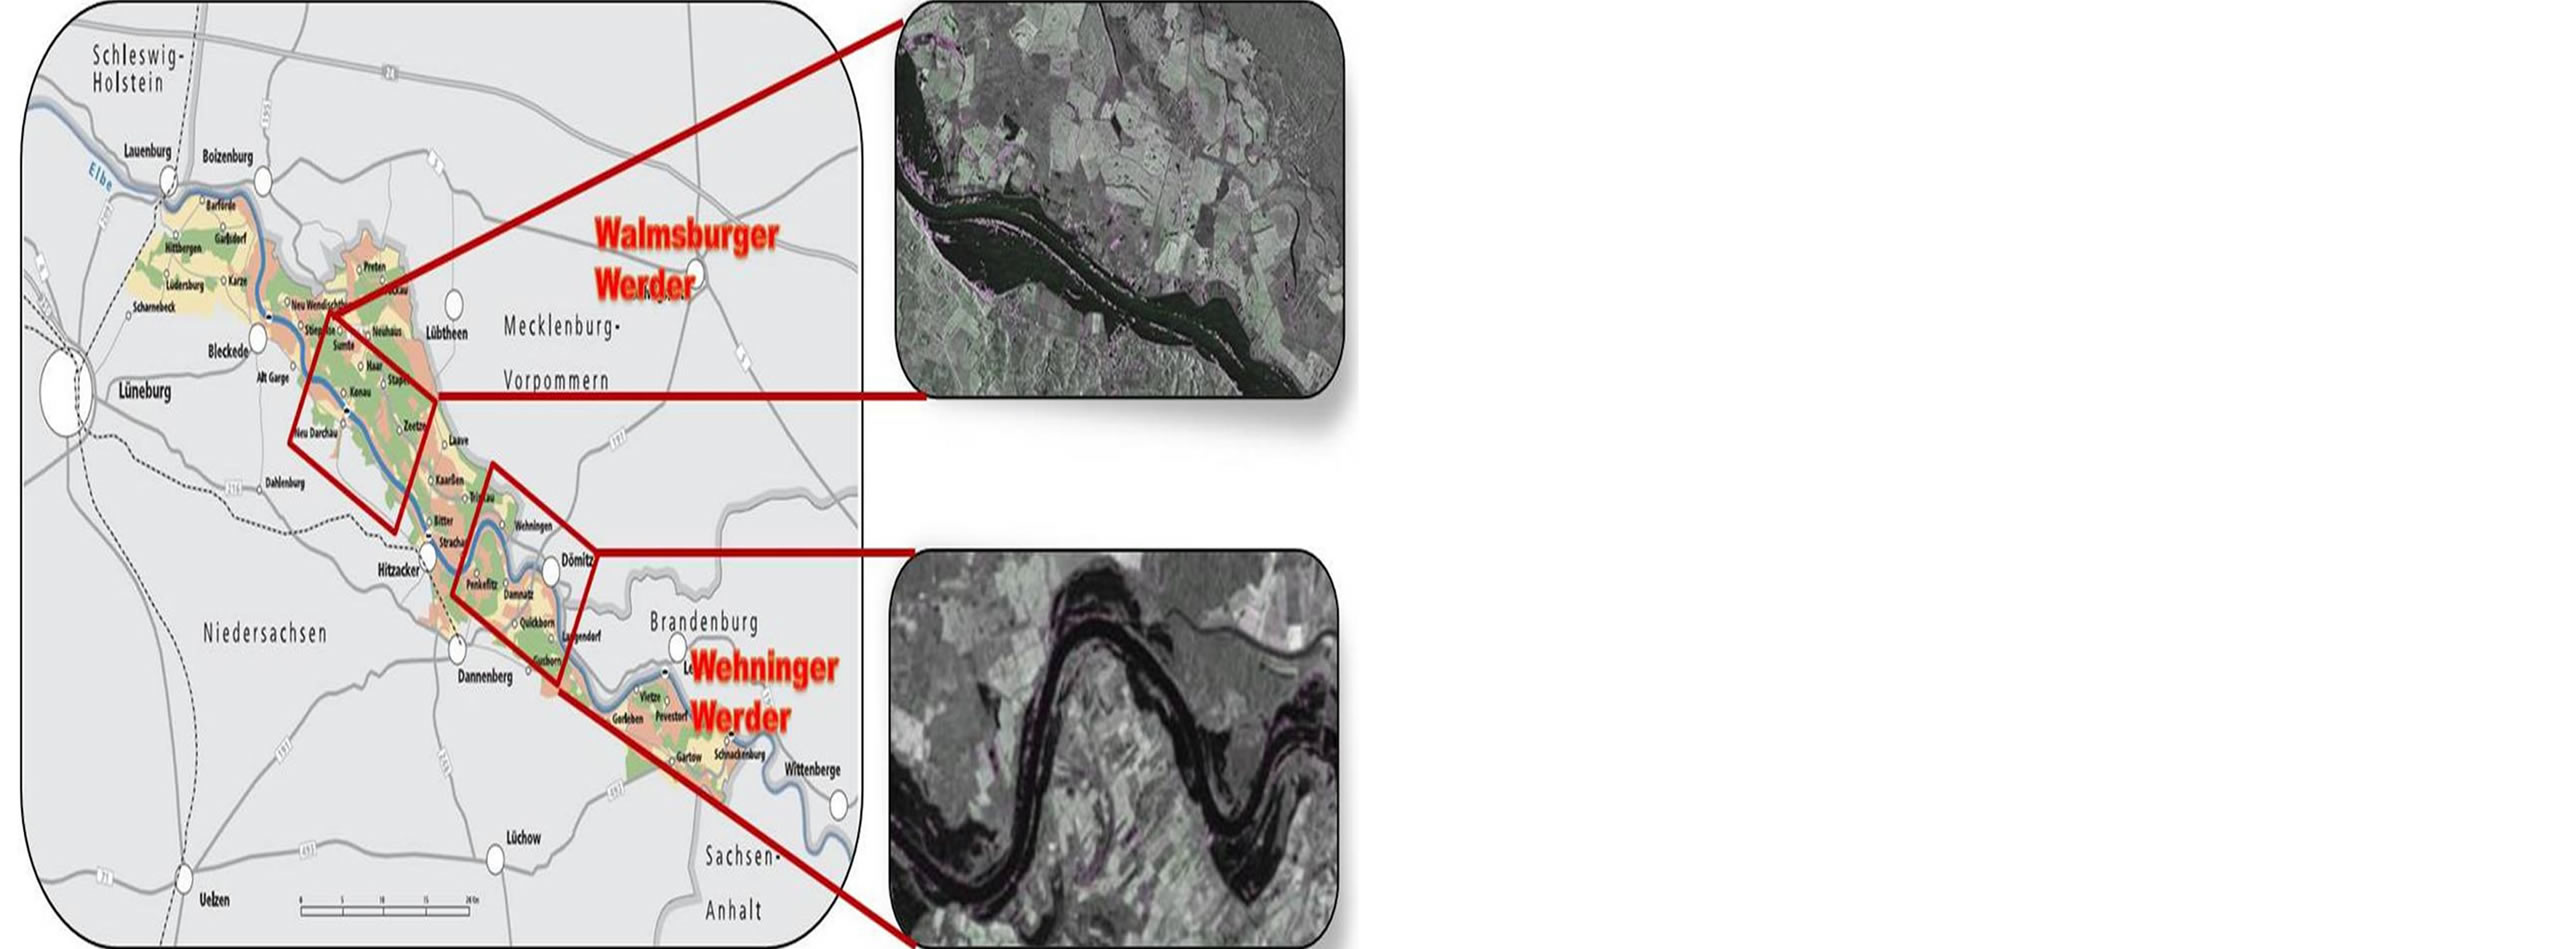
Figure 3. Location of study areas within the Lower Saxonian Elbe River Biosphere Reserve.
areas. HH means horizontal transmit and horizontal receive, while VV means vertical transmit and vertical receive. The images are used to produce several proper classifications which identify the crops cultivated in the investigated areas based on the field visits. The produced classifications are analyzed to evaluate the parameters which affect the producer accuracy of each crop in particular: polarization type, the number of manipulated images, image regularity, filter type, maintaining crop calendar, and the size of surveyed fields. The surveyed areas are large accessible fields. 50% of the surveyed area is considered as test fields. The test fields are assumed to be remote inaccessible areas.
2. Methods and Materials
2.1. Study Area
Two study areas are selected around the Wehninger Werder between Elbe-Kilometer (505 - 520), and Walmsburger Werder between Elbe-Kilometer (533 - 543) within the Lower Saxonian Elbe River Biosphere Reserve (Figure 3). Both areas are bearing several types of land use including urban and rural regions with agricultural land use dominant. The river floodplain produces high quality hay. Thus usually these meadows are mown once or twice a year, depending not only on weather conditions and flood events, but also on the Biosphere Reserve regulations to protect the fauna and flora within this particular environment [19]. The produced hay is used for feeding livestock if it is not contaminated or for Biogas production if it is contaminated [20]. 30% of this area is covered by forests, which must be maintained to ensure the sustainability of the flood plain environment. Over 65% of this area is covered by agricultural fields and grasslands which are considered the main possible sources of environmental pollution as well as they are possible sinks for flood borne contaminations. This study therefore focuses on this part of the Biosphere Reserve.
2.2. Data Collection
The used TSX images were acquired within the period from March 2010 to November 2011 as listed in Table 1. The images are Dual Polarization Spotlight Products. They are high resolution spatially enhanced images with a descending angle of 40˚ which leads to higher range and azimuth pixel spacing of 1 m. The incidence angle of 25˚ enables only 1.5 m range and azimuth pixel spacing. It was planned for this study to acquire images each 22 days, however, due to some operational reasons, some images could not be taken. Over Walmsburger Werder, there was a great gap of 66 days in 2010 during the growing period of most of the crops cultivated there, while in 2011 there were two gaps of 44 days. Over Wehninger Werder, the images had no gaps.
The accessible fields covered by these images were surveyed to determine the crops cultivated there. In year 2010, the fields were visited once in June. About 50 fields were surveyed around Walmsburger Werder. In year 2011, field visits were conducted monthly to several reachable and representative areas on similar dates to the acquisition times. Previous research had recommended surveying a greater number of fields in order to increase the validity of the obtained preliminary results [21]. Therefore, more than 150 fields were visited around Walmsburger Werder totaling 1550 hectares representative of 80% of the arable land within this area. In addition, about 300 fields were investigated around Wehninger Werder covering about 1860 hectares representing 70% of the arable land. Major crops cultivated during the period from March to October were barley, wheat, rye, rye-grass, maize, potato, sugar-beet root, rapeseed, and sunflower. Rye, wheat and barley have similar texture which causes similar back scatter values over the radar images; hence they are grouped together in the cate
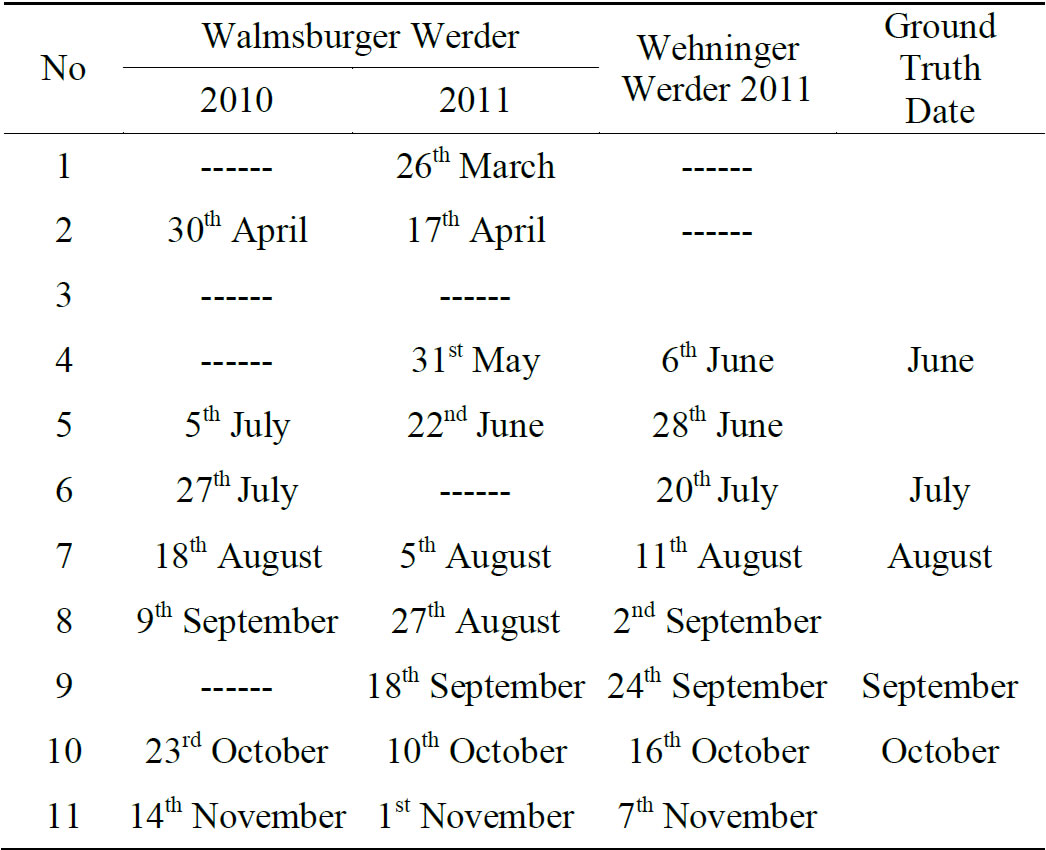
Table 1. List of acquired images and calendar date of land investigations.