Detection of Approximate Potential Trend Turning Points in Temperature Time Series (1941-2010) for Asansol Weather Observation Station, West Bengal, India ()
1. Introduction
In the background of global climate change and under local anthropogenic stresses many regions in the world have been suffering from different and frequent climatic problems. Atmospheric temperature is one of the major significant factors of weather and climate as it largely regulates the atmospheric phenomena irrespective of climate types. Thermal responses of global climate change constitute the most important component of climate assessment. The trend analysis and change point detection for any meteorological parameter owe to active lines of investigation that seek to identify the climatic change in a particular region. The assumption of stationarity, or timeinvariant characteristics of a climatological time series under consideration, seems to be invalid as a result of anthropogenic influences and the natural variability of the climate system [2]. Therefore, trend analysis and change point detection in temperature time series are crucial for understanding regional climate and planning resource management. There are several recent studies on climatologic temperature time series trends and detection of change points, which conclude about temperature related complex functions of the climatic environment [3]. Researchers have unfolded many harsh realities regarding global warming and its multifarious impacts, particularly on human society. This has instigated more and more studies in this field. In its Fourth Assessment Report, IPCC (2007) has pointed out that the mean surface temperature of the planet has risen by 0.74˚C over the 100 years between 1996 and 2005, 0.13˚C per decade being the rate during last 50 years. Between 1995 and 2006 the global communities have experienced 11 warmest years out of 12 since 1850 [4]. It has also been estimated that, by the end of this century Earth’s temperature will continue to increase between 1.4˚C and 5.8˚C. Similar results have been obtained from analyses of long term temperature time series at regional and local scale. During the last 100 years China has experienced a warming by 0.79˚C at the rate of 0.08˚C per decade with local level disparities in warming [5-7]. Large volume of literature has been produced on surface air temperature variation that includes research works to confirm global warming by use of a variety of methods [8-11]. It has been argued that daily minimum temperature exhibits more associations with global warming phenomenon rather than daily maximum [10].
The purpose of this study is to detect the change points and span of homogeneity in trends of temperature data set over the period from 1941 to 2010, for Asansol, India. Sequential version of Mann-Kendall test statistic has been adopted to identify the change point or break points in the considered time series data set. We think that, all the detected change points may be some outcome of potential trend turning points in time series. The serviceable data set has been employed according to forward temporal scale and at most four change points can be detected for a month.
2. Study Area
Asansol (23˚40'48"N and 86˚59'24"E), the second largest agglomeration in West Bengal, India, following Kolkata, is located between the rivers Ajoy and Damodar of Chottonagpur plateau fringe. The region sites on seams of coal. Asansol has a large history of coal mining and industrial activities related primarily to Iron and Steel production over more than 150 years. As such, the area has seen rapid experiencing urbanization with remarkable growth of population. According to Koppen’s classification (1884) the area belongs to Tropical Savanna Climate (denoted as “Aw”) sub type. Mean annual temperature of Asansol in slightly above 32˚C but in summer during April-May, the average daily temperature often goes beyond 40˚C while in winter months the lowest temperature goes even below 10˚C. During December to January, the average monthly minimum temperature remains around 12˚C. The area receives more than 1400 of mm rainfall annually much (80%) of which occurs during June-September, June and July being the rainiest and December being the driest month. In some years of the last decade Asansol and its surrounding weather observatories (e.g. Panagarh, Durgapur) have recorded highest summer temperatures and lowest winter temperatures within the last century. Expansion of large scale industries and installation of sponge iron factories in innumerable number may have been responsible for local temperature change that have bearing upon the local weather phenomena like smog, small scale thunderstorm, occurrence of Norwester etc. These observations really create research interest in temperature trend analysis of Asansol.
3. Data Base and Method
3.1. Data Base
This analysis has been carried on the lower atmospheric temperature data collected from Indian Meteorological Department (IMD), Kolkata (Alipore), recorded at Asansol weather observation station for the period from 1941 to 2010. Mean monthly maximum and mean monthly minimum temperature for each of the months over the 70 years has been considered. The data series is continuous and homogeneous without any gap in its sequence. Month-wise mean maximum and mean minimum temperatures are averaged to get mean monthly temperature year-wise. Finally, the monthly average data sets were employed for statistical analysis. In order to identify discontinuities and detection of change point thereby, sequential version of Mann-Kendall (Seq.MK) test statistic is applied. It is a valid method suggested by many investigators.
3.2. Method
Sequential Version of Mann-Kendall Test Statistic
The sequential version of Mann-Kendall test statistic [1, 12] when applied on time series , detects approximate potential trend turning points in long term data. The Sequential Mann-Kendall test is computed using ranked values
  of the original values
 , in analysis. The magnitudes of
  are compared with
 ,
, . For each comparison, the cases where
  are counted and denoted by
 . A statistic
  can therefore, be defined as [11].
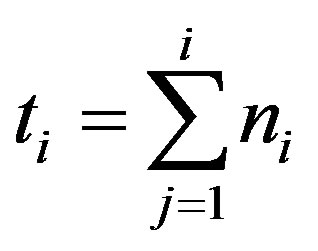 (1)
(1)
The distribution of test statistic  , has a mean as
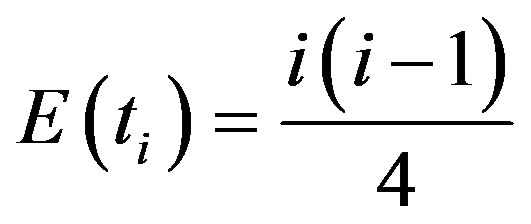 (2)
(2)
and variance as
 (3)
(3)
The sequential values of a reduced or standardized variable, called statistic  is calculated for each of the test statistic variable
  as follows:
 (4)
(4)
While the forward sequential statistic,  is estimated using the original time series
 , values of the backward sequential statistic,
  are estimated in the same manner but starting from end of the series. In estimating
  the time series is resorted so that last value of the original time series comes first
 .
.
The sequential version of Mann-Kendall test statistic allows detection of approximate beginning of a developing trend. When 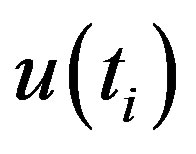 and
and  curves are plotted, the intersection of the curves
  and
and 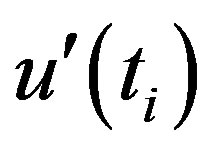 locates approximate potential trend turning point. If the intersection of
  and
and  occur within
  (5% level) of the standardized statistic, a detectable change at that point in the time series can be inferred. Moreover, if at least one value of the reduced variable is greater than a chosen level of significance of Gaussian distribution the null hypothesis (H0: Sample under investigation shows no beginning of a new trend) is rejected.
4. Results and Discussion
Sequential Version of Mann-Kendall test statistic calculated for monthly average temperature data set of Asansol station clearly detects the statistically significant turning points in yearly trend of monthly temperature. Yearly plots of  and
and 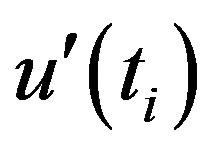 values for each of the months of a year have been shown in Figure 1. In case of the month of January, an apparently decreasing trend from 1957 to 2010 is observed. Though the curves intersect each other at 1973 but it cannot be recognized as a significant turning point as the associated probability value is much higher than the accepted level of significance (p < 0.05) in Table 1. Furthermore, although the
  and
and  do not clearly cut each other but are closer to each other in 1992 where from they begin to diverge, indicating a starting point of an abrupt change in Figure 1(a). For the month of February,
 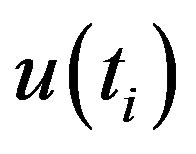 plot (Figure 1(b)) shows an increasing trend during 1945 and 1957, and 1980-2003, and a decreasing trend during 1941- 1944, and 1958-1979, then the curve gradually rises upward to indicate an increasing trend. Though less significant, 2003 can be identified as a turning point in the temperature trend of February.
 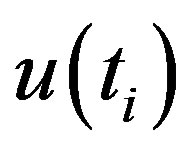 and
and  plots for the month of March in Figure 1(c), intersect each other for several times which indicates that there is no recognizable trend in the March temperature data set [11]. Sequential Mann-Kendall plots for April temperature has been given in Figure 1(d). It shows that, the
  and
and  curves diverge since 1953 where they have taken

Table 1. Change points detection by sequential version ofMann-Kendall test for Asansol observatory (values significant at p < 0.05*).
a value of 0.387. Hence, for the April data set a less significant turning point can be detected at 1953. The 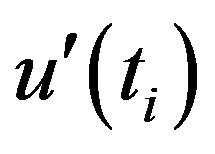 plot also helps to understand that April temperature at Asansol has increased since 1954 and afterward it has stabilized.
 plots for the month of May in Figure 1(e) and June in (f), indicates less significant trend turning point at the beginning of the 6th decade of the last Century. The May temperature had a decreasing trend prior to the abrupt change and slightly increasing trend after that change. On the contrary, the June temperature had a decreasing trend before the abrupt change and has almost stabilized after the change.
Most significant turning points in month wise temperature time series over the period from 1941 to 2010 for Asansol station have been found for the months of July in Figure 1(g) and August in (h) in 1962 and 1969 respectively.  plots for those two months alsoexhibit an initial spell of uniformity in average temperature up to1962 and 1969, respectively and increasing trends thereafter. The temperature series for the September and October shows increasing trend over the period considered in Figures 1(i) and (j), abrupt changes for these two months have been found to have occurred since 1986 and 1989, respectively.
  and
and 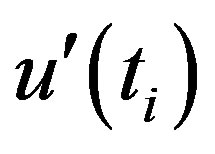 statistic values for the month of November converge gradually to intersect each others in 1998 and they diverge thereafter indicating a turning point at 1998, though at considerably low level of significance in Figure 1(k).
  plot for the December temperature time series indicates a turning in the temperature trend since 1957 in Figure 1(l).
5. Conclusion
The sequential version of Mann-Kendall test statistic has been employed, in this analysis on year wise data of
mean temperature for the each of months for the period from 1941 to 2010, in the case of Asansol Weather Observation Station, West Bengal, India. The study reveals that mean monthly temperatures for most of the months have increased since different time points within the time period considered. Though all such turning points in the temperature time series have been found to be statistically significant but highly significant changes have occurred in the case of July and August. It is important to note that these two months fall within the monsoon season and increase of average temperature may have significant bearing on the functionality of monsoon weather system over this area. Hence, findings of the present study invite initiatives for further investigation on effect of increase in mean monthly temperature during monsoon season in modifying pattern of rainfall over the area under study.