1. Introduction
The response of human skin to ambient temperature depends on many meteorological parameters other than temperature alone [1]. There are various approaches to quantifying comfort levels in terms of temperature and other meteorological variables. The American Society of Heating, Refrigeration and Air-Conditioning Engineers (ASHRAE) developed the concept of “effective temperature” as “an empirically determined index of the degree of warmth perceived on exposure to different combinations of temperature, humidity and air movement” [2]. Different bioclimatic indices have been proposed to integrate the effect of environment on the human thermal comfort. These indices can be categorized into three different groups viz. “rational indices”, “empirical indices”, and “direct indices” [3,4]. Rational indices are based on heat balance equation of the human body which accounts for the environmental variables such as ambient temperature, radiation temperature, humidity and air movement as well as metabolic processes and clothing insulation for human body. Most commonly used such recent indices are physiological equivalent temperature (PET) [5] and Universal Thermal Climate Index (UTCI) [6]. Empirical indices are based on objective and subjective strain re sponse data obtained on individuals and group of individuals exposed to various levels and combinations of environmental and metabolic heat stress factors [4] e.g. Effective Temperature [7] and Wet Bulb Globe Temperature [8]. Direct indices are based on direct measurements of environmental variables. Popular direct indices include Discomfort Index (DI) of Thom [9], which defines proportional effect of dry bulb temperature and wet bulb temperature (in ˚F) over human thermal comfort, Humisery of Weiss [10], Wind Chill Index which was created by Siple and Passel [11] and later on refined by Steadman [12] and the apparent temperature of Steadman or heat index [13]. Giles et al. [14] revised the work of Thom [9] and proposed an alternative version of DI defined in terms of temperature in degree Celsius and relative humidity in percentage. Thom’s DI and its alternative version in degrees Celsius (thermohygrometric index) have been suggested as universal heat stress indices by Epstein and Moran [3] and Chronopoulos et al. [15], respectively.
Epstein and Moran [3] argued that while rational and empirical indices are more comprehensive, they are also difficult to implement as they evolve many variables and some of them require invasive measurements. Direct indices, on the other hand, are more practical and applicable to indicate thermal stress as they require simple monitoring of environmental variables which makes them user-friendly. This study deals with the assessment of direct indices for different megacities in India and addresses a methodology to represent the thermal comfort conditions of a given city in terms of this assessment. This could help compare the climatic conditions of various cities broadly for the purpose of tourism, health and energy resource management. Here thermal comfort index is adopted to demonstrate the proposed methodology that includes cumulative representation of all indices including uncomfortability to assess the overall local climate and for relative ranking of the cities. This methodology is chosen due to the fact that the routine meteorological parameters such as temperature, wind speed and relative humidity are adequate and readily available.
All these indices signify that essentially, wind and relative humidity play pivotal role in determining how cool or warm it might appear for a given temperature level. This is because the rate at which heat is dissipated from the human body through skin determines how warm one feels in summer season or how cold one feels in winter. Thus, there can be a difference between the actual ambient temperature and one that the human body feels. It is important to have knowledge of this “apparent temperature” as it often aids in scheduling outdoor activities and deciding optimum temperature levels in many workplaces. This can be quantified in terms of a “Comfort Index” [16].
Comfort index simply means that during those hours which fall under comfortable class, temperature, humidity and wind speed conditions are optimum for people to carry out light to moderate physical activities without the constraints of weather (excluding rainfall). In other words, under the temperature conditions requisite for “comfortable” class, one feels naturally comfortable without the aid of any anthropogenic support system. Thus when it is said that certain months or periods of time include most hours under comfortable class, it implies that in these months or periods one feels comfortable in natural ambient surroundings and does not require temperature altering mechanisms such as fans, coolers or air conditioners. The concept of comfort index is most relevant to people who spend a substantial time outdoors during a day. These include pedestrians, cyclists, vendors, shopkeepers near roadside and most people from the lower strata of society who live in makeshift houses i.e., a significant proportion of the population. Increasing ambient temperatures have been observed to be strongly related to mortality [17]. It also directly affects the environmental pollution as “uncomfortable” conditions will require more usage of air conditioners in vehicles on roads which in turn leads to increased fuel consumption and increased emissions. Consequently, cooling energy demand in cities and towns are also dependent on this index [18].
India is a large country with varying geographical and climatic features. There are wide varieties of terrains like mountains (the Himalayas) in the north, delta region (the Ganges delta), desert (the Thar Desert) in the west, plateau (the Deccan plateau) in central India, coastal line (Eastern and Western) in the southern part of the country, and islands located off the mainland India (Lakshadweep and Andaman and Nicobar Islands) etc. Indian climate and size can be equivalent to what would be when various European countries put together would form. India is also varying in its culture and has always been successful in attracting a large number of tourists. Tourist comes here throughout the year and from various parts of the world. Tourist activities are sensitive to weather information which is expected to influence tourist destination selection, tourism activity participation, tourism demand, and tourism seasonality [19]. Comfort indices could broadly help in estimation of cooling energy requirements of the mega-cities of India and also assist in knowing the best periods of the year from a tourism point of view. The ever increasing urbanization in megacities of India like Delhi has led to increase in ambient temperatures over past few decades [20]. In such scenarios, comfort indices are an important tool to analyse impact of changing climate on human population.
The aim of the present study is to quantify the Comfort Index for different megacities of India. This comfort indicator can be defined in different ways and this study has chosen the two broad premises for this assessment 1)
based directly on comfortable hours and 2) based on assessing the weightages of different comfortable classes. Method based on 2) is a conventional method while method 2) is being proposed in this study. The present study aims to estimate Comfort Index for a period of five years (January 2004-December 2008) in five megacities of India i.e. Delhi, Mumbai, Hyderabad, Kolkata and Chennai.
2. Heat Index and Wind Chill: Concepts and Underlying Assumptions
2.1. Heat Index
Heat Index and Wind Chill are the two indices, for hot and cold weathers respectively, which act as indicators for the temperature actually felt by an average human subject or the so called apparent temperature. Heat Index can be considered as a contribution of high temperature accompanied with humidity effects in reducing a body’s ability to cool itself that in effect governs our ability to cope up with the severity of the summer season and intermittent monsoon periods. Wind Chill, on the other hand, combines the effects of high wind speed with low temperature conditions which enhances rapid heat loss from the skin that in turn governs how severe the winter season would appear to us [18].
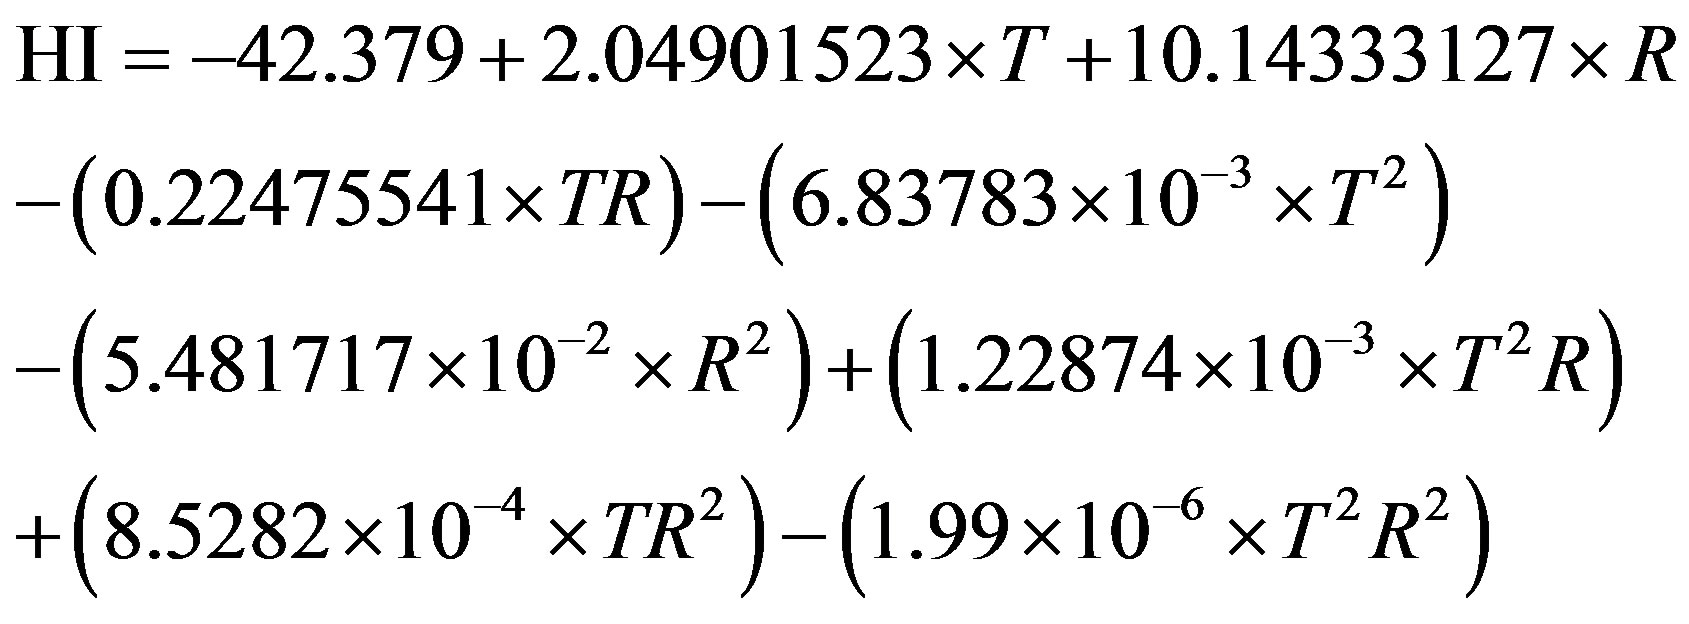
The metabolic processes in human body generate excess heat which needs to be transmitted away to maintain internal thermal balance. This process majorly takes place through skin. Up to a certain temperature level, the excess heat can simply be lost from skin through radiation and thus the human body feels comfortable. However, as the ambient temperature continues to increase further, the surface area of skin becomes insufficient for heat loss by simply radiation, and thus sweat glands of the body are activated. Sweating makes heat transfer from body to surroundings feasible though evaporative cooling. On a hot, dry day, sweat evaporates quickly and cools the skin. However, as the moisture levels in surrounding air increases, the process of evaporation is retarded. Thus heat is removed from the body at a lower rate causing it to retain more heat than it would in dry air making one feel warmer for a given temperature in humid conditions as compared to dry weather [18]. The heat index (HI) is the index that combines air temperature and relative humidity in an attempt to determine the human-perceived equivalent temperature i.e., how hot it feels, termed often as apparent air temperature. The expression for estimation of heat index is derived from work carried out by Steadman [13] and was subsequently improved upon by meteorologists. The expression was determined keeping in consideration, the response of human skin to varied temperature and humidity levels. Naturally, several assumptions are used in calculating heat index. The heat index is calculated for a typical situation in which a person who is 5 feet 7 inches tall and weighs 147 pounds (67 Kg) walks in shade at about 3.1 miles per hour (~5 Km/h) in a light breeze of 6 mph (~9.7 km/h), wearing long pants and a short-sleeved shirt. A change in any of these factors will result in a different heat index for the same or a different individual. Thus, different individuals at the same time may perceive the weather differently. Hence reported heat index values should not be taken as a strict benchmark for deciding one’s own response to weather. The expression used to calculate heat index (with all the above assumptions) is [21]:
 (1)
(1)
where HI = Heat Index (in ˚Fahrenheit)
T = ambient dry bulb temperature degrees Fahrenheit R = relative humidity (%).
Heat index has been used in many studies for temperature impact assessment in human morbidity, heat waves and urban heat island effect [22-25].
2.2. Wind Chill
Sweat evaporation, which is high in hot and dry weather, helps in removing excess heat from the body. The bare human skin is covered by a thin boundary layer of air which acts as insulator in perfectly calm conditions. This causes the skin temperature to be slightly higher than that of the ambient air temperature. Moving air blows away this layer reducing its thickness and thereby removing heat from the body more effectively than still air. The skin temperature then gets closer to the air temperature. Thus in cold windy conditions, a person might feel colder than what he would actually feel at the same temperature in calm conditions. This apparent temperature is given by the Wind Chill Factor [26]. The Wind Chill Temperature index is the measure of the relationship between temperature and cooling effect of wind. It is a calculated temperature that represents the “feel” of a wind on exposed human skin in terms of an equivalent temperature in still air. Wind chill can make a fairly moderate winter day equivalent to a much colder one.
In year 2001, National Weather Service (NWS), National Oceanic and Atmospheric Administration (NOAA), US Dept. of Commerce, implemented an updated Wind chill Temperature (WCT) index. The change improves upon the former WCT Index used by the NWS and the Meteorological Services of Canada, which was based on the 1945 Siple and Passel Index. The improved expression for wind chill was determined by iterating a model of skin temperature under various wind speeds and temperatures. The model used standard engineering correlations of wind speed and heat transfer rate. Heat transfer was calculated for a bare face in wind, facing the wind, while walking into it at 3 mph (1.37 m/s). The model corrects the officially measured wind speed to the wind speed at face height, assuming the person is in an open field [27]. The results of this model may be approximated, to within one degree, from the following formula:
 (2)
(2)
where WCT: wind chill temperature (in ˚C)
T: Temperature (in ˚C)
V: Velocity in m/sec.
Wind Chill Temperature is only defined for temperatures at or below 50˚F (10˚C) and wind speeds above 3 mph (4.8 km/h). In this calculation, the worst case solar radiation situation is assumed, e.g. clear night sky. Bright sunshine may increase the wind chill temperature by 10 to 18˚F [27].
2.3. Comfort Index
Comfort experienced by a human is determined by the temperature as well as corresponding heat index value or wind chill value. As stated in Section 1, there are different indices that are used to classify the thermal comfort. These indices are based on several assumptions and are formulated based on different geographical domains and their relevant climatological features. Thom’s Discomfort Index [9] has been used extensively in many studies including a wide range of areas such as Turkey [28], Greece [29] and Hungary [30]. Thom’s discomfort index considers temperatures ranging from 24˚C - 27˚C as uncomfortable which seems more suitable for midlatitude countries with cold climate. However in tropical countries like India population is more susceptible to experience higher temperatures with a greater degree of comfort. Hence classification of comfort has to be relevant to the region under study. There are no established ambient thermal comfort standards in India. For indoor environments, the national building code of India specifies a temperature range of 21˚C - 26˚C for air conditioned buildings in any of the climatic zones in India [31]. However this range is based on ASHRAE standards and not on any empirical studies conducted on local population. There have been only a few studies based on thermal comfort in India and these are focused to indoor environments. Chandel and Aggarwal [32] utilized a range of 18.5˚C - 21.7˚C as comfortable temperature based on relations obtained during survey in an earlier study in Pakistan which has similar climatic conditions as India. Singh et al. [33] carried out a field study which included survey of numerous vernacular dwellings, field tests and thermal sensation vote of several occupants on ASHRAE thermal sensation scale in North-East India. Their survey revealed an overall comfort temperature range with wide variations of 19.0˚C - 29.1˚C. The present study utilizes the classification based on comfort index defined by Saskatchewan Weather Station, Canada [16] that considers ambient temperatures from 15˚C - 25˚C as comfortable and from 25˚C - 32˚C as warm as can be seen in Table 1. Thus, this classification is in line with earlier studies in India and relevant to tropical/sub-tropical conditions of India. This comfort index is a combination of eight classes ranging from severe danger in the extreme cold to severe danger in extreme hot weather based on temperature, wind chill and heat index conditions. These conditions are listed in Table 1. In the present study, the hours of the entire study period have been classified in terms of eight classes listed in Table 1. The first three classes in this table corresponding to extremely low sub zero temperature conditions are nonexistent in the study area. The classification of hours in remaining five classes is Cool, Comfortable, Warm, Uncomfortably hot and severe danger due to heat.
The meteorological data used in the present study have been obtained from the online database archive of Weather Underground. The data sources for this website are typically stations which are owned by government agencies and aeronautical weather stations at international airports of the respective cities which are often used to report their representative weather conditions. The website collects weather conditions of Delhi from Indira Gandhi International Airport (ICAO code: VIDP) [34]. The data have been processed as hourly averages of temperature, wind speed and relative humidity. Altogether, meteorological data for 5 years (i.e. from January 2004 to December 2008) has been analyzed to demonstrate the comfort indices from different approaches in the five major metropolitan cities, i.e. Delhi, Hyderabad, Kolkata, Chennai and Mumbai, of India. For Delhi, Chennai and Mumbai the data availability was more than 90% and for Kolkata and Hyderabad the data availability was more than 70%.

Table 1. Classification of Comfort Index [16].
WC: Wind Chill; T: Temperature; HI: Heat Index.
Based on the Equations (1) and (2), computation of heat index was performed for only those hours where the temperature was above 25˚C and relative humidity was greater than or equal to 40%.
The wind chill was calculated for hours with temperatures less than or equal to 10˚C and wind speeds greater than or equal to 1.33 m/s. It implies that for the temperatures greater than 25˚C and relative humidity less than 40%, apparent temperature is same as the ambient temperature and similarly if wind speed is less than 1.33 m/s, the temperature is not affected by the wind speed and hence wind chill temperature is same as the ambient temperature.
3. Climatic Conditions of the Selected Megacities
Five megacities (Delhi, Mumbai, Kolkata, Chennai and Hyderabad) of India (Figure 1) have been considered in the present study. Delhi, the capital city of India, is located in the Indo-Gangetic plains of northern India on the banks of Yamuna River. Mumbai is located on the western coast of the country while Chennai is situated in the south eastern coast. Kolkata is placed on the delta of the Ganges in the Eastern part of the country and Hyderabad is situated in the Deccan plateau which lies in the central and southern interiors of the country.
3.1. Delhi
The climate of Delhi is a monsoon-influenced humid subtropical climate. Summers start in early April and peak in

Figure 1. Geographical location of Delhi, Mumbai, Kolkata, Chennai and Hyderabad on the physical map of India.
May, with average temperatures near 32˚C, although occasional heat waves can result in air temperatures close to 45˚C on some days. The monsoon starts in late June and lasts until mid-September, with about 800 mm of rain. The average temperatures are around 29˚C, although they can vary from around 25˚C on rainy days to 32˚C during dry spells. The monsoons recede in late September, and the post-monsoon season continues till late October, with average temperatures sliding from 29˚C to 21˚C. Winter starts in November and peaks in January, with average temperatures around 12˚C - 13˚C. Although winters are generally mild, Delhi’s proximity to the Himalayas results in cold waves that regularly dip temperatures below freezing point. Delhi receives heavy fog during the winter season. Overall extreme temperatures have ranged from −0.6˚C to 47˚C [35].
3.2. Mumbai
Mumbai has a tropical savanna climate with dry winters. Mumbai’s climate can be best described as moderate temperatures with high level of humidity. The city’s coastal nature and tropical location ensures moderate temperatures throughout the year, average of 27.2˚C and average precipitation of about 2430 mm. The temperatures average to about 30˚C in summer and 18˚C in winter. Mumbai’s experiences 4 distinct seasons: Winter (DecemberFeb.); Summer: (March-May); Monsoon (June-Sept.) and Post Monsoon (Oct.-Dec.) [36,37].
3.3. Hyderabad
Situated on the Deccan Plateau, Hyderabad has an average elevation of about 500 meters above sea level (1640 ft). Most of the area has a rocky terrain and some areas are hilly. The city of Hyderabad lies on the southern bank of the river Musi. Like Mumbai, Hyderabad too has a tropical savanna climate with dry winters. Hot summers prevail from late February to early June followed by the monsoon season from late June to early October which further gives way to a pleasant winter from late October to early February. Over the course of a year, the temperature typically varies from 16˚C to 39˚C. The highest temperature ever recorded was 45.5˚C on June 2, 1966, while the lowest recorded temperature was 6.1˚C on January 8, 1946. Hyderabad gets about 810 mm of rain every year, almost all of it concentrated in the monsoon months [38].
3.4. Kolkata
Kolkata has a subtropical climate, with summer monsoons. The annual mean temperature is 26.8˚C (80˚F); monthly mean temperatures range from 19˚C to 30˚C and maximum temperatures can often exceed 40˚C during May-June. Winter tends to last from Mid-November to early-February, with the lowest temperatures hovering in the 12˚C - 14˚C range during December and January. The highest recorded temperature is 43˚C and the lowest is 5˚C. Monsoon is the most notable phenomenon in the climate of the city. Maximum rainfall occurs during the monsoon in August (306 mm) and the average annual total is 1582 mm. Early morning mists and evening smog occur often due to temperature inversions. Summer is dominated by strong southwesterly monsoon winds [39].
3.5. Chennai
Chennai is situated in the tropical climate zone. It is due to this reason that the city experiences a hot and humid weather. The city also experiences all the three major seasons of summers, winters and monsoons. However, there is very slight variation amongst all of them. This is due to its location near equator. Chennai city experiences hot climate throughout the year. During the summer months, which are between March and October, the climate is extremely hot. April and May are the hottest months of the year, with mercury crossing 40˚C mark. The places near the sea coast remain warm and humid, cool breeze flows during the night time. During the monsoons, which means during the months of June to September, Chennai receives high rainfall. Monsoon arrives with the advent of the Northeast Monsoon Winds. Moreover, as the city is located near the sea side; it receives moderate rainfall of about 1300 mm throughout the year [40].
4. Methodology
4.1. Method 1
In this method the percentage of number of hours having temperature in the comfortable range (i.e. temperatures between 15˚C and 25˚C) as per Table 1 are calculated for each month of the five year period of 2004-2008. Monthly averaged percentages of comfortable hours are estimated for each of the twelve months and five cities. Figure 2 presents annually averaged percentage of hours in each of the five classes based on Table 1 for all the five cities. Based on this, the cities with more comfortable hours in the descending order are Hyderabad, Kolkata, Delhi, Chennai and Mumbai.
4.2. Method 2
Method 1 delineates the most comfortable city and provides relative ranking of the cities based on comfortable class alone. These cities have comfortable hours of about 30% or less. Therefore when cities are graded for comfortability using this method, the majority of hours which lie in the non-comfortable classes are not accounted for. For example, it is clear from Figure 2 that Delhi has more percentage of comfortable hours than Mumbai but

Figure 2. Percentage distribution of total number of hours in different categories of comfort index class for five megacities during the years 2004-2008.
it also has more percentage of hours lying in “uncomfortably hot” and “Severe danger due to heat” classes. These hours should affect negatively the overall comfortability of the climate of Delhi as compared to Mumbai. Also, the region of study in India mainly has tropical climatic conditions and hence majority of the hours correspond to warm/hot classes. Thus, an appropriate strategy needs to be conceptualized to represent both comfortable and non-comfortable hours in a more meaningful way. Therefore, it is proposed to consider the severity of all the non-comfortable classes while giving due weightings to both comfortable and non-comfortable hours and ascertaining overall comfortability of a place. In this methodology, a new term namely, Effective Comfortability (EC) is proposed in a manner that it would accommodate the above shortcoming. Such a scheme can provide better quantitative estimates about comfortability of a place that can also be helpful in relative rankings. This methodology covers the following three step procedure to calculate Effective Comfortability (EC).
4.2.1. Calculation of Effective Comfortability Ratio (ECR)
In this step monthly averaged Effective Comfortability Ratio in each of the twelve months and five cities is calculated. For this purpose, all the temperature measurements for each class of comfort index (excluding severe danger due to cold which is absent) of same month for all five years on an hourly basis are grouped together and averaged to obtain the average temperature for each class of a given month. These classes will be represented by TEC, TUC, TC, TCO, TW, TUH and TSH for extreme cold, uncomfortably cold, cool, comfortable, warm, uncomfortably hot and severe danger due to heat classes of comfort index respectively. In this manner, we obtain average temperature of each class for all twelve months. Based on these estimations Table 2 describes the “Effective Comfortability Ratio” (ECR) for all the six comfort classes (severe danger due to cold class is not included here because temperatures less than −35˚C are unlikely to occur in the cities considered here). It may be noted that temperature data and study area represent more of the tropical and warm regions and will not cover all the comfort classes shown in Tables 1 and 2.
1) ECR for Extreme Cold and Uncomfortably Cold Classes It includes in the numerator the difference of average monthly temperature for a given class as outlined above with that from the lower limit of the temperature in the cool class i.e., 0˚C (LTC) and represents deviation in observed average temperature from the cool range. Similarly, the denominator is the maximum possible deviation in temperature from the cool range i.e., the difference in temperature between LTC with that from the lowermost limit of the temperature in case of extreme cold and uncomfortably cold classes.
2) ECR for Cool and Comfortable Class Similarly ECR for the Cool class includes in the numerator the difference of the average monthly temperature for Cool class of hours with that of from the lower limit of the comfortable class, i.e. 15˚C and denominator is the maximum possible deviation in the temperature from the comfortable range. As obvious, ECR for the comfortable class is taken to be +1.
3) ECR for Warm Class It is calculated on the similar basis as for the Cool class, the numerator is the difference of the average monthly
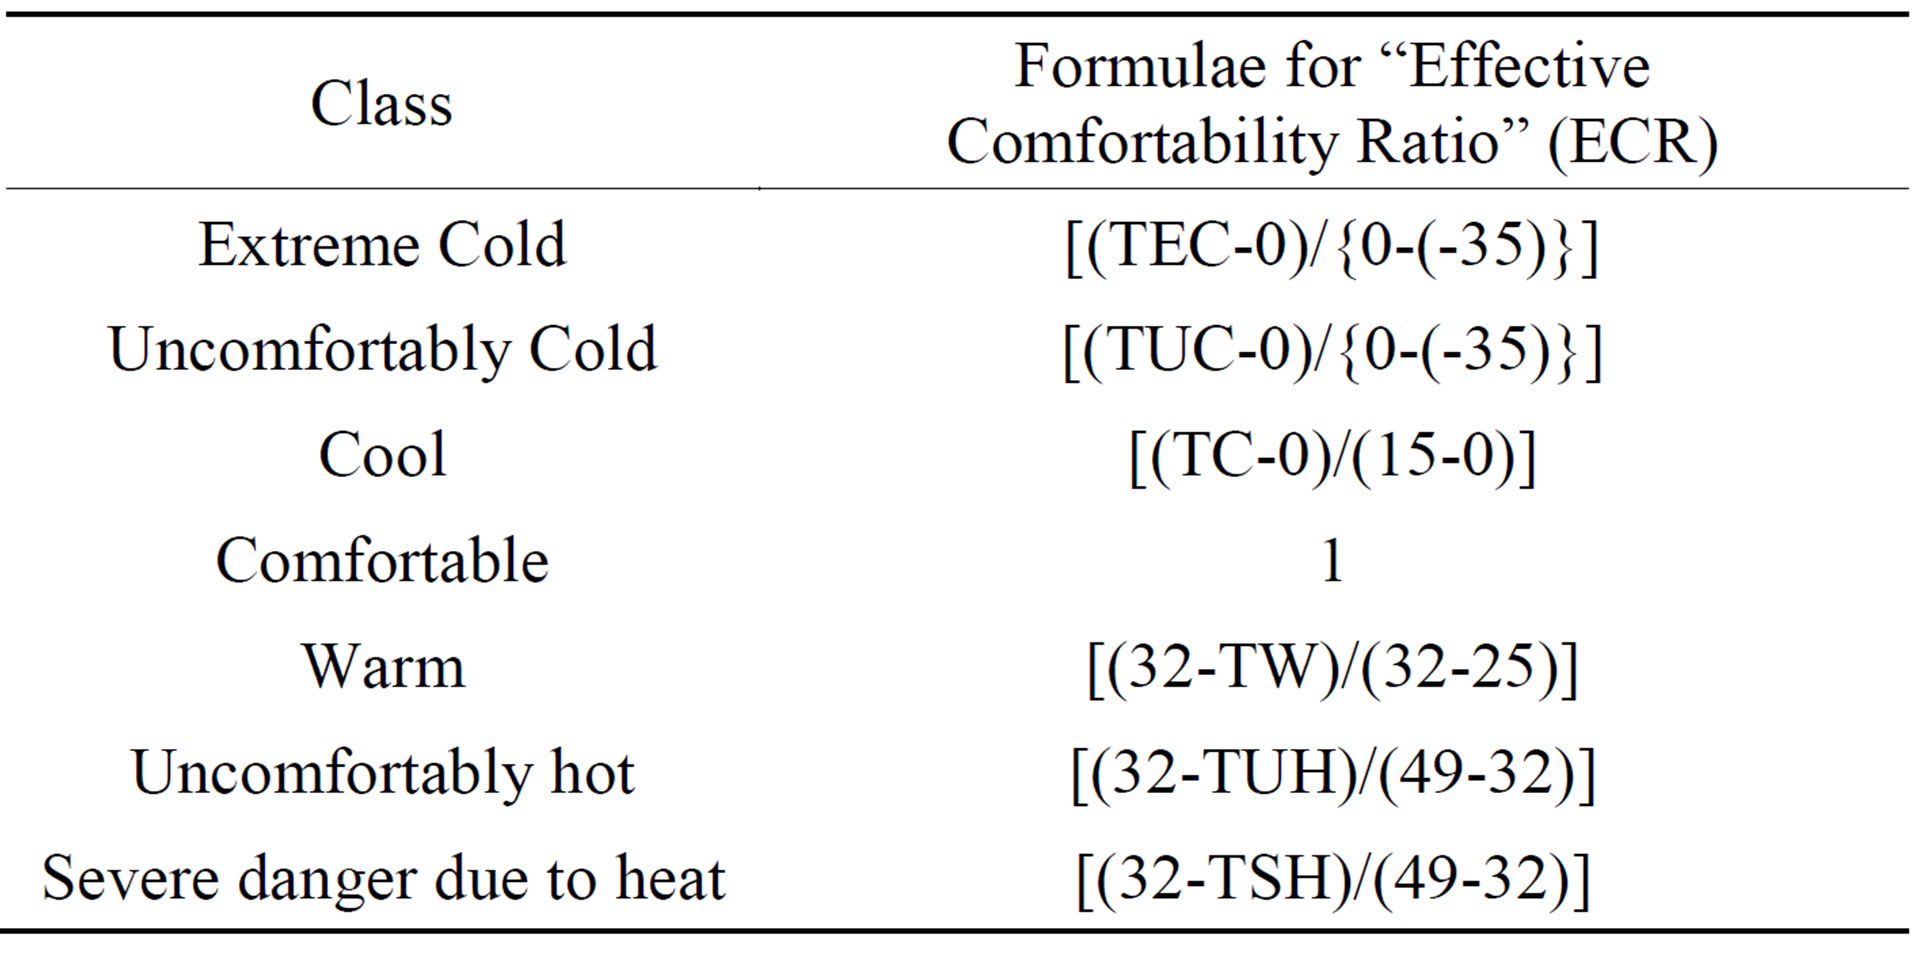
Table 2. Proposed formulae for the estimation of “Effective Comfortability Ratio” for different categories of comfort index classes.
temperature for warm class of hours with that of from the upper limit of the temperature in the Warm range (UTW) i.e. 32˚C and the denominator is the maximum possible deviation from comfortable class.
4) ECR for Uncomfortably Hot, Severe Danger Due to Heat Classes It is calculated on the basis of upper limit of the warm class, i.e. the numerator is the difference of the average monthly temperature for a given class (as outlined in the preceding paragraphs) with that from the upper limit of the temperature in the Warm range (UTW) i.e. 32˚C and represent negative deviation in calculated average Temperature from the warm class. Similarly, the denominator is the maximum possible deviations in temperature from the warm class i.e. the difference in temperature between UTW with that from the lowermost temperature as observed in the study domain, i.e. 49˚C observed at 5 PM on Saturday June 9, 2007 in Delhi.
ECR calculated for each of the class as described above is designated as ECRclass and will be used subsequently to calculate effective contribution to comfort level for any given comfort index class or ECnclass as described in following sections.
4.2.2. Effective Contribution to Comfort Level for Any Given Comfort Index Class
Effective contribution to comfort level for any given comfort index class, ECnclass involves calculation of ECRclass and PHclass. ECR or “Effective Comfortability Ratio” for each class defined here as ECRclass has been estimated previously in Section 4.2 (a) above. PHclass is monthly average percentage of hours in each class during entire number of years considered for the study for a given month i.e., each of the twelve months of a year can be defined to have a PHclass value for all the categories. Equation (3) describes the estimation of ECnclass which is calculated for each of the twelve months separately for all the classes.
 (3)
(3)
We will illustrate the calculation of ECnclass for the month of January in Delhi. During the January months of the years 2004-2008 (31 × 5 × 24 observations), the comfort index classes were assessed and the average temperature for hours corresponding to cool (TC), comfortable (TCO) and warm (TW) were found to be 10.6˚C, 18.8˚C and 27.3˚C respectively. Temperature data corresponding to remaining four categories of Table 1 were not reported in Delhi. Based on Table 2, the estimated values of ECRcool, ECRcomfortable and ECRwarm are 0.707, 1 and 0.671 respectively. PHcool, PHcomfortable and PHwarm were 62.65%, 35.59% and 1.74% respectively for the month of January in Delhi that subsequently leads to the estimated values of ECncool, ECncomfortable and ECnwarm as 44.42, 35.59 and 1.17 respectively.
4.2.3. Calculation of Effective Comfortability (EC) and Its Components
Effective Comfortability (EC) is calculated as per Equation (4) which involves summation of Effective Contribution (ECn) from each class as described in previous section. The EC can be divided into two components, i.e. the positive contribution (PC) and the negative contribution (NC). Here cool, warm and comfortable weather is considered tolerable requiring small amount of heating and cooling energy and clubbed as PC. The negative contribution is considered due to extreme weathers either hot i.e., negative contribution to hot weather (NCH) or cold i.e., negative contribution to cold weather (NCC). These are described as follows
 (4)
(4)
Where i = 1 to 8 refers to the index numbers as per Table 1 that corresponds to a comfort index class mentioned therein.
 (5)
(5)
 (6a)
(6a)
 (6b)
(6b)
 (7)
(7)
 (8)
(8)
EC, PC and NCH and NCC values for the month of January for Delhi are calculated to be 81.18, 81.18, zero and zero, respectively. It clearly shows that extreme weathers were altogether absent from this particular month.
Method 1 utilizes only comfortable hours and does not incorporate the fact that while predicting the comfortability of cities, the uncomfortable hours also have noticeable impact and these ought not to be neglected. For a city to be classified having comfortable climate, the percentage of comfortable hours should be high or severity of the uncomfortable hours should be less or both. With the new methodology proposed here i.e. methodology 2, the analysis is not restricted to only data concerning comfortable hours but we can also use the data sets of the hours corresponding to other classes as explained in the following paragraph.
According to Table 1 we consider a range of temperatures to lie in one class. For example in the “warm class” of Table 1 the temperature varies from 26˚C to 32˚C. Once categorized, all these hourly datasets are considered to be identical and correspond to warm class. But within one class of categorization the range of temperature variation is significant which cannot be neglected while comparing the two scenarios. All the hours corresponding to “warm class” cannot be considered similar e.g. any two months can have same percentage of warm hours but average temperature of hours lying in warm class of one month could be different. Then as per the system of classification corresponding to Table 1 and methodology 1 (assuming that data pertain to only comfortable class in this case), both months are similar, which is clearly not true. The second month should be warmer as compared to the first one. Methodology 2 can distinguish this clearly. The methodology 2 considers the average temperature, for the hours corresponding to a specific class, and then derives weighted contribution from each class which is leading towards a more holistic assessment in terms of Effective Comfortability.
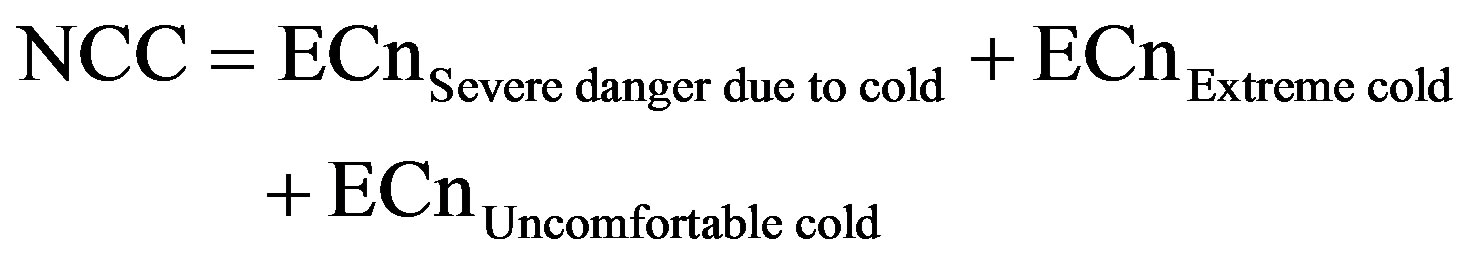
5. Qualitative Representative Indicator of Cooling and Heating Energy Requirement
A qualitative estimate of cooling energy requirement in a city depends on the hours corresponding to the uncomfortably hot and severe danger due to heat class. As “Effective Comfortability” considers all classes of hours, it cannot serve the purpose of qualitative estimation of cooling energy demand. Similarly, the heating energy demand of any given place would depend upon the hours corresponding to extreme cold and uncomfortably cold categories. Thus cooling energy demand could be represented in a qualitative manner through NCH and heating energy demand through NCC. In the megacities considered in this study NCC is negligible and hence only relative cooling energy requirements are considered in this study based on NCH of each of these cities. Thus NCC and NCH could be helpful to serve as a qualitative representative indicator (QRI) of heating and cooling energy requirements respectively.
6. Results and Discussions
Figure 2 shows the percentage distribution of total five years of observations as per the comfort index classification shown in Table 1 for the five metropolitan cities, i.e. Delhi, Hyderabad, Kolkata, Chennai and Mumbai. The figure illustrates comparison of five cities based on the percentage of comfortable hours in each city. If we set the percentage of comfortable hours from method 1, as the only criterion to judge the comfortability of one city then the most comfortable city is Hyderabad and least comfortable city is Mumbai. It is explicit from the figure that the majority of hours that is more than 70% in all the five cities, does not even correspond to comfortable class. Assertions based on comparison of such narrow section of data and completely neglecting other majority seems fallible.
When the cities are compared only on the basis of comfortable hours according to methodology 1 the decreasing order of Comfortability is Hyderabad, Kolkata, Delhi, Chennai and Mumbai. As Figure 2 demonstrates, in Hyderabad almost half of hours correspond to warm class. Delhi and Kolkata are showing similar distribution of hours, only comparable difference is that the former has more cool hours whereas the latter has more percentage of warm hours. Both cities have high variation in climatic conditions with percentage of hours in uncomfortably hot class or severe danger due to heat class along with considerable hours in cool class (Figure 2). In Chennai the climate is predominantly hot with about 41% of hours in warm class and about 39% in uncomfortably hot or severe danger due to heat class. In Mumbai the climate is again predominantly hot, but lesser as compared to Chennai, with about 80% of hours in warm or uncomfortably hot class and almost all of the rest in comfortable class (Figure 2).
As per Figure 2, significant percentages of hours for each city correspond to non comfortable classes of Table 1. Therefore the analysis of these majority hours is important in comparison of climate of the different cities. Method 2 is proposed in this study which incorporates all the classes with due weightage to the temperatures of each class. Method 2 combines the comfort caused by hours corresponding to each class in terms of Effective Comfortability Ratio, which depends upon the average temperature of these hours as clearly mentioned in Table 2.
Some hours are expected to cause comfort whereas some are expected to be moderately comfortable or uncomfortable. As defined in method 2 Comfortable, Warm and Cool class give positive contribution (PC) whereas Uncomfortably hot and Severe danger due to heat class give negative contribution (NC) towards the Effective Comfortability (EC) of each city. Figure 3 depicts the PC, absolute value of NC, EC (= PC-NC) and percentage of Comfortable Hours (CH) for five yearly averaged data of the five cities. Figure 3 explains why the results obtained by the two methods are at times dissimilar; it is the considerable contributions from non comfortable hours which alter the results of method 2. For example, in the month of May or June CH is negligible (except the anomaly of Kolkata in May), therefore the method 1 would fail to differentiate these cities and answer them equally comfortable whereas method 2, by the analysis of other non comfortable hours, clearly explains the difference in the comfortablility of the five cities.
As per Figure 3 January witnessed zero negative contribution (NC) to EC from any city and specifically for Chennai, the relatively low PC from hours corresponding to non-comfortable classes resulted in shifting it to least comfortable city as per method 2. In February there is no NC to EC from any city and specifically for Delhi, the relatively high PC from hours corresponding to noncomfortable classes resulted in shifting it to most comfortable city according to method 2. In March the climate of Delhi is far more comfortable as compared to other

Figure 3. Positive Contribution (PC), Negative Contribution (NC), Effective Comfortability (EC) and Comfortable Hours (CH) for Delhi (Del), Hyderabad (Hyd), Kolkata (Kol), Chennai (Che), and Mumbai (Mum) for all months of the year.
four cities. In April high NC to EC resulted in negative EC for Kolkata and Chennai. In May and June high percentage of hours in uncomfortably hot and severe danger due to heat classes resulted in either negative or zero EC for all the cities. In July and August the climate of Hyderabad is far more comfortable as compared to other cities, which have either negative or zero EC. In September all the cities improved in terms of comfortability as compared to earlier four months. As illustrated in Figure 3 from October to December all the cities improve progressively in terms of EC, PC and CH resulting in overall high comfortability for all the five cities.
Table 3 shows the comparison of the comfortable months (EC ≥ 50 or CH ≥ 50%) and uncomfortable months (EC ≤ 30 or CH ≤ 30%) calculated by method 1 and method 2. The months not shown in either of these two categories are in moderate range of EC between 30 to 50 or CH between 30% - 50%. It demarcates which months are comfortabe for each city in descending order of comfortability and which months are least comfortable with descending order of uncomfortabilty. The values in the bracket shown are the CH for method 1 and EC for

Table 3. Comparison of Comfortable and Uncomfortable months in each city.

Table 4. Months with high values of “Effective Uncomfortability” for each city in decreasing order of EU, the values shown in brackets are the EU for that specific month.
method 2. Method 1 fails in comparing the comfortability of May, June, July and August for Delhi since all of them have negligible CH for effective comparison; whereas method 2 differentiates them by analyzing the hours corresponding to non comfortable classes and evaluating their positive or negative contribution to EC. As shown in Table 3 similar differences are clarified by method 2 for Hyderabad while differentiating between June and April; for Chennai while differentiating between April, May, June, July, August and September; and for Mumbai in the case of May and June.
Finally, the qualitative representative indicator of heating and cooling energy requirements is shown through NC or negative contributions in Figure 3. NC incorporates the uncomfortability caused by the uncomfortably hot and severe danger due to heat category hours as all the cities mostly contributed through NCH and also it is a measure of the excessive hot climate as experienced by these cities. Thus, NC here also shows effective uncomfortability (EU), which basically is the absolute value of the negative contributions recieved fromthe the ECnclass which are mostly from uncomfortably hot and severe danger due to heat hours. Table 4 shows the EU for each month of each city in descending order and thus gives a qualitative measure of the variation in the excessive heat observed by these cities. EU can be viewed as a qualitative measure of the cooling energy requirement in relative terms of each city for each month.
As shown in Table 4 EU, in Delhi, increases from April to July and then decreases till October. Rests of the months, i.e. September to March have negligible EU. In Hyderabad months with significant EU are April and May whereas in Mumbai May and June have high values of EU as compared to other months. Kolkata has overall higher values of EU relative to all the four cities. In Kolkata and Chennai months with significant EU are April to September, where May is the month with highest EU.
7. Conclusion
A new method for comparing the climatology of various places for the analysis of the meteorological data in terms of comfort index class has been proposed which has advantages over the conventional method that represents only the comfortable hours. The proposed method incorporates both the non comfortable hours and comfortable hours in its analysis. It sums up the weighted contribution from different hours categorized in different classes, namely cool, warm, comfortable, uncomfortably hot and severe danger due to heat. Some hours contribute negatively whereas some positively towards the quantification of total comfortability for each city. The new method has the benefits of incorporating complete data set against the conventional method that is based on comfortable hours alone and considering the entire spectrum of comfort indices that is demonstrated for the examined five cities in India through the estimated Effective Comfortability and its comparison with the conventional method. The proposed method also depicts Effective Uncomfortability (EU) to get in relative terms a qualitative indicator for the estimation of the cooling load requirement for each city and for each month. Various methodologies are discussed and it is concluded that approximations and merits and demerits for each of these will affect the outcome in similar manner and hence relative rankings proposed here are representative. The methodology using comfort index proposed and demonstrated here could be applied to any other kind of thermal stress index and a way forward to initiate cumulative representation of comfort indices of cities for various societal applications such as tourism or energy demand planning.
NOTES