A Study on the Cause Analysis for the Wall Thinning and Leakage in Small Bore Piping Downstream of Orifice ()
1. Introduction
Carbon steel components placed on the secondary system in nuclear power plants gradually get thinner because of aging mechanisms such as FAC (Flow Accelerated Corrosion), Cavitation, Flashing, and LDIE (Liquid Droplet Impingement Erosion). These mechanisms induce wall thinning of the components and finally lead some components to be burst [1,2]. The damages are closely related to fluid such as water or wet steam inside the components. Main steam line is generally known to be insensitive to thinning because of its highly dry-conditioned flowing inside the line.
However, in April 2013, one inch small bore piping connected to the main steam line was leaked due to thinning in a 1000 MWe Korean PWR nuclear power plant. The piping is designed to transport extracted steam from the main steam line to the auxiliary feedwater pump turbine. During normal operation, the extracted steam goes to condenser through the piping. The leak occurred near the downstream area of an orifice. A similar case was that one inch small bore piping was ruptured in Arkansas Nuclear One Unit 2 [3], the United States, in February 2009. The piping was designed to serve the extracted steam from the high pressure turbine to the 1st stage reheater. The rupture occurred near the downstream of an orifice plate. There is difference between those two cases. In case of Arkansas Nuclear One Unit 2 event, one of the high pressure extraction steam pipes flowing relatively high moisture fluid was ruptured. In the case of the Korean PWR event, however, one of the main steam extraction pipes flowing relatively low moisture fluid was leaked.
This paper describes the review of UT thickness data, SEM images, and numerical simulation results in order to analyze the extent of damage and the cause of leakage in the small bore piping in a Korea nuclear power plant.
2. Design and Operating Conditions
The leaked 1 inch pipe was designed to serve extraction steam during abnormal or emergency operation from the main steam line to the auxiliary feedwater pump turbine. During normal operation, the extracted steam goes to condenser through the pipe. Dotted circle in Figure 1 shows the leaked point, which is right behind orifice plate. A control valve is placed on in front of the orifice. The design and operating conditions for this line are as follows:
1) OD and Thickness: 1.315 inch, Sch. 80 (4.547 mm)
2) DP, DT: 80.6 atm, 315.6˚C
3) OP, OT: 76.3 atm, 293.3˚C
4) Steam quality: 0.975
5) Flow rate: 90.72 kg/h at full open.
3. Wall Thinning Analysis
Visual inspection, UT thickness measurements, and SEM images were taken to analyze the thinning on the pipe after its cutting at a laboratory.
3.1. UT Data Analysis
In total, 24 pipe thickness measurement data were obtained in the laboratory. Equally spaced 6 points were marked around the circumference at 2 cm intervals along the length of the pipe. The thickness measurement is conducted using UT measuring device. As presented in Table 1, point (2B), adjacent area to orifice, has the minimum thickness 0.94 mm. The point is located in the bottom side of the pipe. Behind circumference point 4, thinning is not found as all thickness data have more than nominal thickness 4.547 mm. The leak-occurred point is between longitudinal points 1 and 2 and between circumference points A and B. The crack size is about 2 cm. Figure 2 shows the UT inspection points and leak occurred point on the component.
3.2. Image Analysis
Optical and SEM images are used to observe the damaged surface. Figure 3 shows the inner surface of the axially sectioned pipe by optical image and close surface images by SEM. Adjacent area to the orifice has significantly worn-out surface in optical image. The leaked area has smooth surface in optical image, yet tiny craters are found in SEM images. Damage is hardly found in the downstream area of the pipe. Most wears are found close to the orifice, in which significantly worn-out surface is found as well, although leak has not occurred in the area. It is highly probable that the welding bead between the orifice and the pipe is considerably thick.
4. Numerical Analysis
In view of fluid flow, numerical analysis is performed to

Figure 2. UT inspection and leak points.
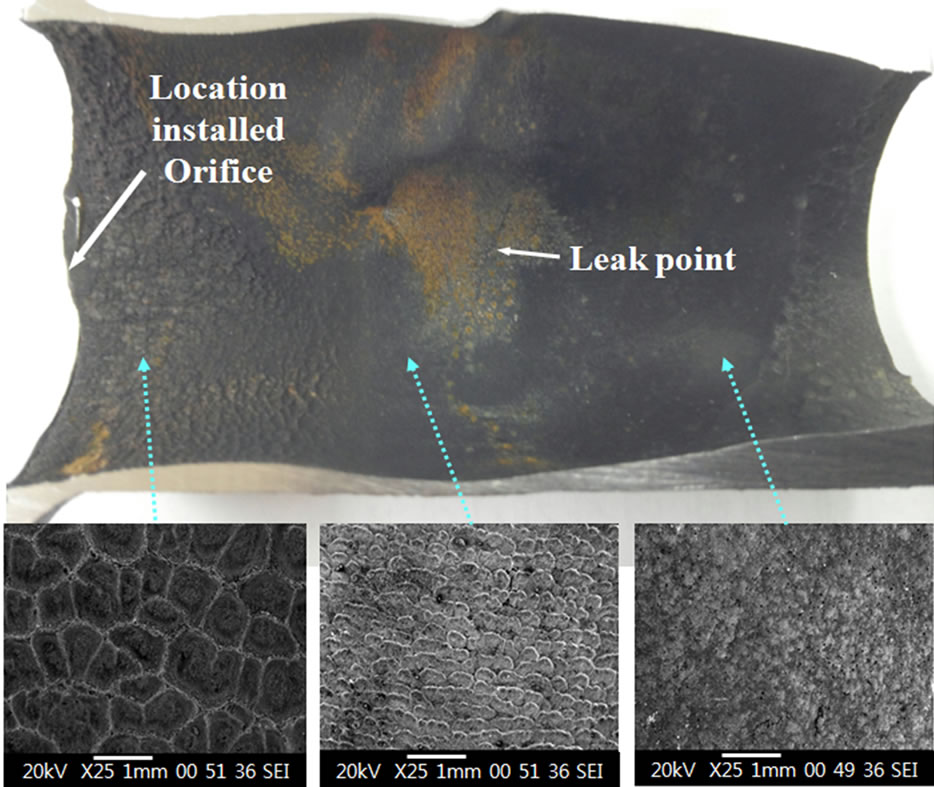
Figure 3. Optical and SEM pictures of leaked pipe.
analyze why the extent of damage is different depending on the area of the pipe. Fluent Code is employed for the numerical analysis.
4.1. Model Construction and Analysis Conditions
A valve, an orifice, and downstream part of the orifice are considered for the numerical analysis. Figure 4 shows the valve configuration. A control valve, placed in front of the orifice, is modeled as simplified feature with incoming flow from the top side for the analysis. Figure 5 shows the configuration of the analysis model. 5.5D downstream from the orifice is incorporated, and approximately 1.1 million tetrahedral meshes are applied for the analysis.
Normal operation condition is adopted for the analysis. Two-phase flow, steam-liquid, is considered for the flow running into the orifice. The flow inside the piping is assumed to be incompressible with Reynolds number about 6.88E + 04. Standard k-e Model is employed to address turbulent flow behavior. Also, Eulerian Model is employed to address the multi-phase flow behavior. Eulerian Model shows relatively high-quality convergence even though secondary phase has over than 10% volume fraction. Besides, Eulerian Model is available when bubble or droplet size is greater than mesh size. This is because Eulerian Model does not distinguish boundaries between flow phases. Yet, in case of too large bubble or droplet size, the convergence has potential to cause problems as inter-phase drag coefficient increases [4].
Table 2 shows operating conditions around the orifice for the analysis. Table 3 shows steam and liquid proper-
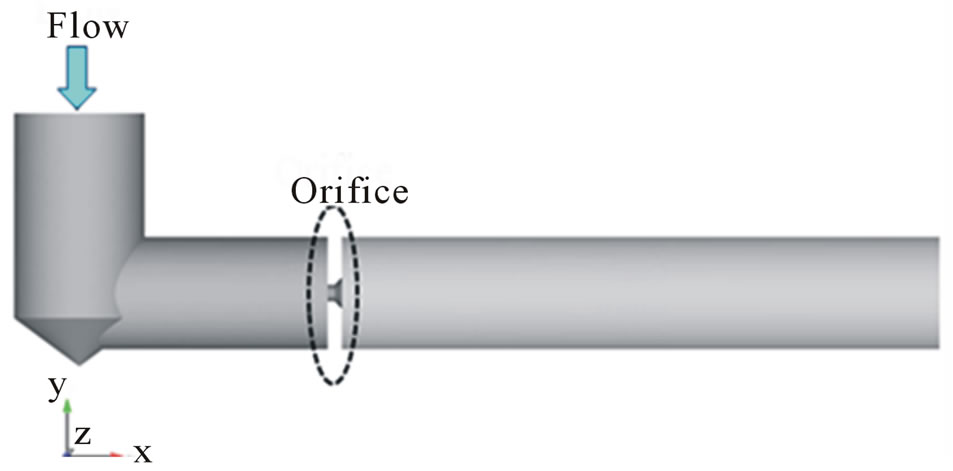
Figure 5. Configuration of analysis model.
ties in the piping for the analysis. Droplet sizes of 1 mm, 10 mm, and 20 mm are simply employed for the numerical analysis. This is because the droplet size inside the piping is unknown. Droplet size over 20 mm is not considered. This is because droplets will pass through along the pipeline without collision to the wall as they possess their inertia when their size is over 20 mm.
4.2. Numerical Analysis and Findings
Figures 6-8 show the liquid droplet stream lines for droplet sizes of 1 mm, 10 mm, and 20 mm. Stream lines are similar for droplet size 1 mm and 10 mm. Flow coming from the orifice shows high speed jet behavior. Recirculation zone is formed around the high speed jet area. As the flow goes downstream farther from the orifice, the width of the steam jet is gradually broadened, and the intensity of the steam jet is gradually weakened. Flow reattachment point appears approximately 2D downstream from the orifice. Unlike the cases of droplet sizes of 1 mm and 10 mm, a great vortex flow is generated for the case of droplet size of 20 mm in the upstream area of the pipe, and a relatively small vortex flow is generated in the downstream area of the pipe. It is highly probable that a vertical flow path in the valve and grown inertia force by the large droplet size make the flow run differently depending on the droplet size.
Figures 9-11 show the steam velocity vector for droplet sizes of 1 mm, 10 mm, and 20 mm. The flow through orifice seems all similar in Figures 9-11.
Figures 12-14 show the liquid droplet volume fractions with their velocity vector for droplet sizes of 1 mm, 10 mm, and 20 mm. For droplet size at 1 mm, it is seen that droplets disperse approximately 2D downstream from the orifice. As the droplet size grows larger, droplets have tendency to go straight forward from the orifice. For droplet size of 20 mm, droplets have tendency to go upwards approximately 2D downstream from the orifice.
From the above droplet behaviors, two findings are indicated. For droplet size less than 10 mm, droplet beha-

Figure 6. Liquid droplet stream line of size 1 mm.
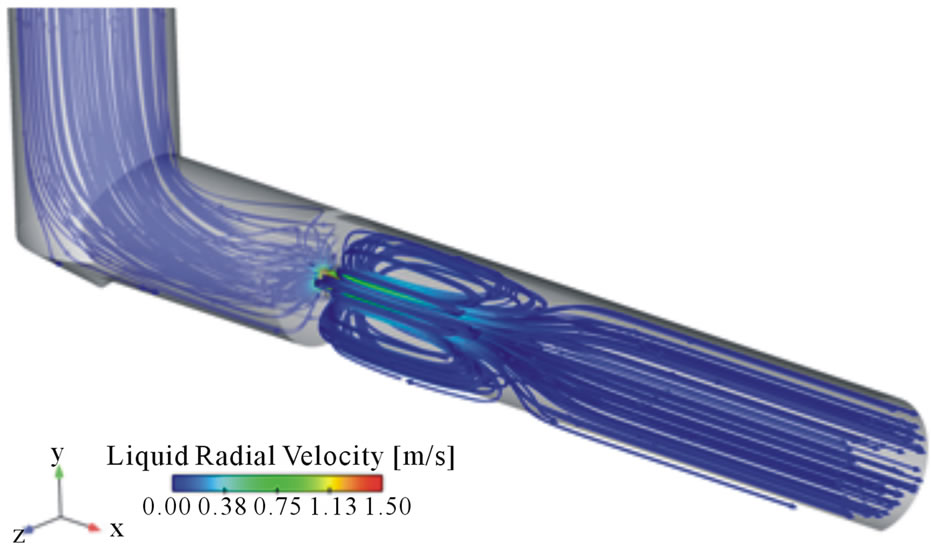
Figure 7. Liquid droplet stream line of size 10 mm.
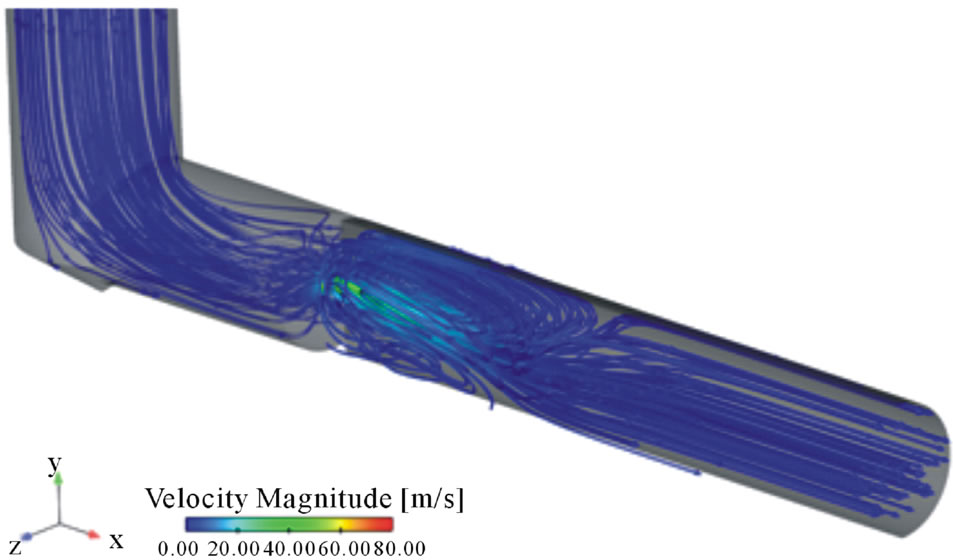
Figure 8. Liquid droplet stream line of size 20 mm.
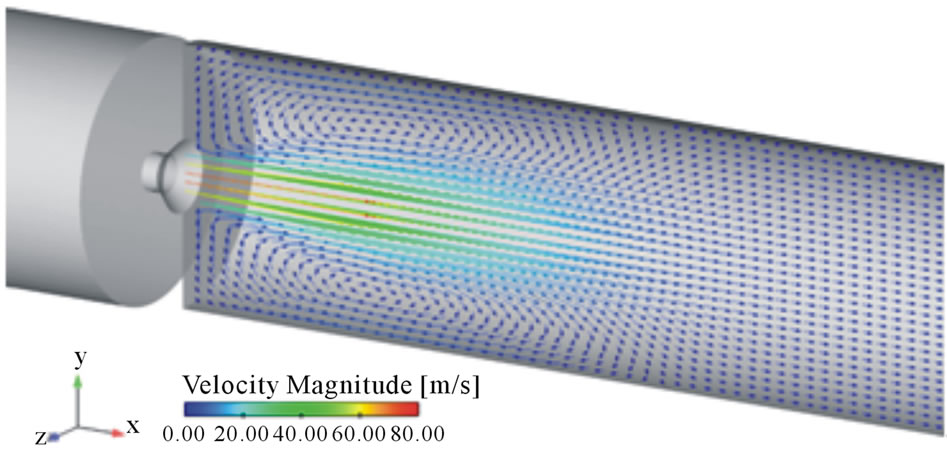
Figure 9. Steam velocity vector of size 1 mm.
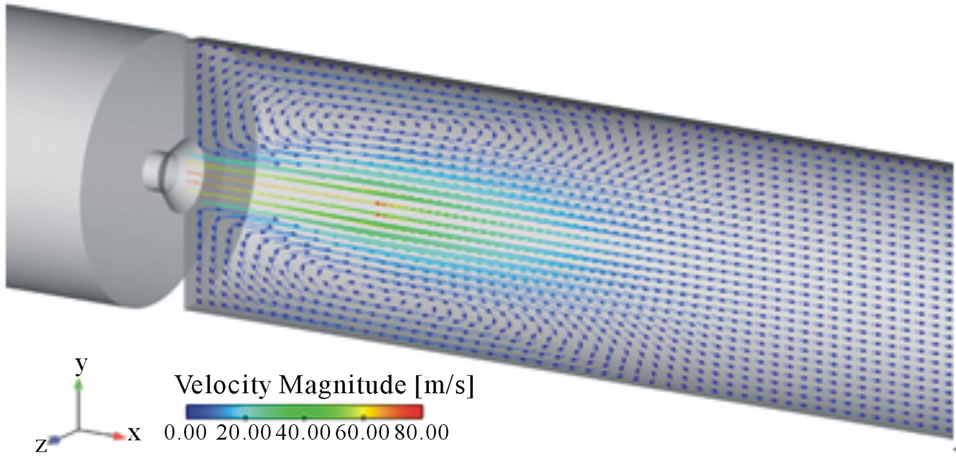
Figure 10. Steam velocity vector of size 10 mm.
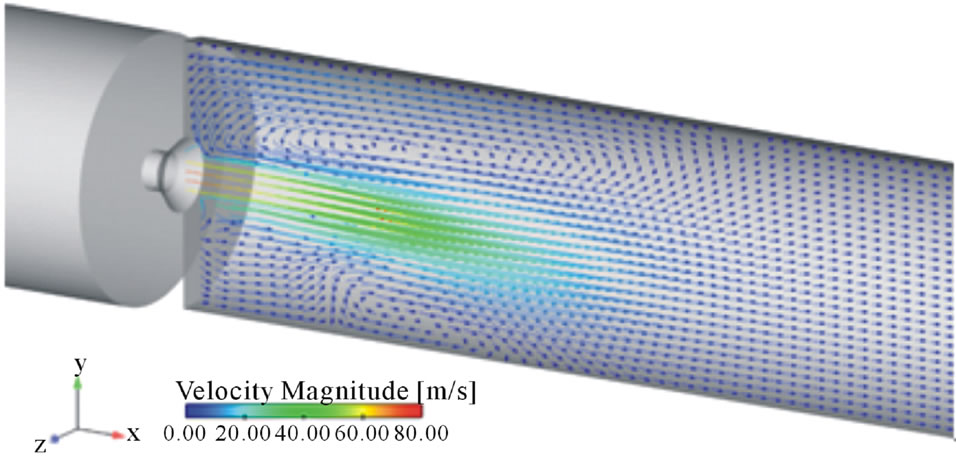
Figure 11. Steam velocity vector of size 20 mm.
vior is entrained to steam flow. For droplet size of 20 mm, droplet behavior is somewhat independent with steam flow.
It is known that liquid droplet impingement erosion rate is proportional to 3.6 to 5.2 power of droplet velocity [1,5,6]. Using droplet density distribution and radial velocity, droplet impulse can be calculated along the length of the downstream pipe behind orifice. The impulse is calculated at 95% diameter area from the pipe center. This is because droplet velocity on the wall is 0 m/s. Figures 15-17 show the comparison between the impulse and the thickness data along the length of the pipe for droplet sizes of 1mm, 10 mm and 20 mm. The thickness data are acquired from the area underneath the leak occurred in the pipe. The lowest thickness data is measured from area around the leak occurred (A2).
As shown in Figures 15-17, it is found around leak occurred (A2) that the larger droplet size has, the bigger droplet impulse has. As shown in the Figure 3, erosion occurred most frequently immediate behind the orifice.
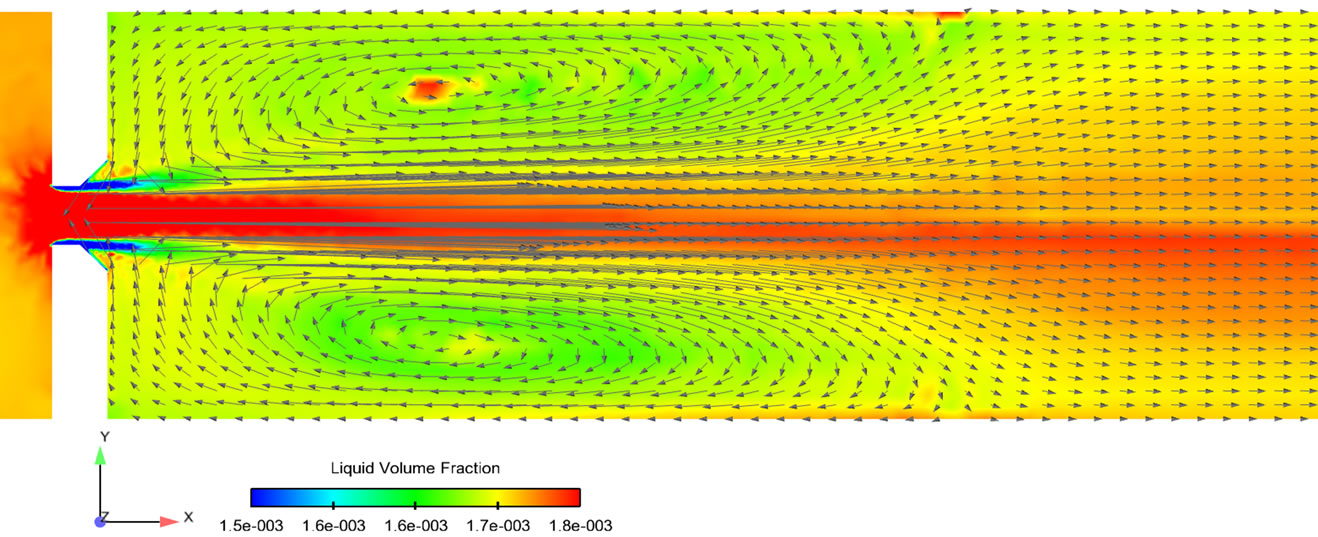
Figure 12. Liquid droplet volume fraction and velocity vector of size 1 mm.
Figure 13. Liquid droplet volume fraction and velocity vector of size 10 mm.
Figure 14. Liquid droplet volume fraction and velocity vector of size 20 mm.
Yet, thickness measurement cannot be conducted due to welding bead. Those things are represented in Figure 17. The impulse right behind orifice end, where the orifice is installed, is larger than the impulse in approximately 0.04 m distance from the orifice.
As mentioned in the previous section 4.1, for droplet size over 20 mm, droplets will pass through along the pipe without collision to the wall as the droplets possess its inertia. In case of droplet size under 20 mm, there are less findings to clarify what sort of things has caused the erosion right behind the orifice and what sort of things has induced wall thinning at the immediate area where the leak occurred. Consequently, it is highly probable that droplet size around 20 mm has induced wall thinning and leakage in the small bore piping connected to the main steam line.
5. Conclusions
In April 2013, 1 inch small bore piping branched from the main steam line was leaked due to thinning in a 1000 MWe Korean PWR nuclear power plant. The leak occurred near downstream area of an orifice. A control valve with vertical flow path was placed in front of the orifice.
To analyze the cause of pipe leakage in this study, UT thickness measurement, visual inspection, SEM image analysis, and numerical analysis were carried out on the small bore piping. As a result, it becomes apparent that the cause of thinning is mainly induced by numerous

Figure 15. Comparison of impulse & thickness of size 1 mm.
Figure 16. Comparison of impulse & thickness of size 10 mm.
Figure 17. Comparison of impulse & thickness of size 20 mm.
liquid droplet impingements to the pipe wall. The liquid impingements most frequently occurred right behind the orifice. Yet, leak did not occur on that area. This is because the welding bead between the orifice and the pipe is considerably thick. The leak was induced by liquid droplet impingements approximately 2D downstream from the orifice where vortex flow reattachment point is located.
The above findings indicate that wall thinning can be induced by liquid droplet impingement erosion in the main steam line, even though it contains relatively dry steam. Moreover, it is analyzed that droplet size around 20 mm has caused the leakage on the small bore piping connected to the main steam line.