The Contribution of the GIS and the Principal Component Analysis in the Study of the Cement’s Dusts Impact on the Top Soils in the Central Part of the Oujda-Taourirt Corridor (Eastern Morocco) ()
1. Introduction
The cement dust that produced by cement manufacturing process is considered as one of the most hazardous pollutants, which affects the surrounding environment. These dusts can be emitted at every stage of the manufacturing process of the cement: extraction of the raw material crusher, rotary kiln, cranes, mills, storage silos and packing sections, etc. [1]. The deposit of the cement particles is complex and it is controlled by the atmospheric stability, the roughness of the surfaces as well as the diameter of the particles [2]. These cement particles get deposited on top soil and vegetation as well as enter into the soil as dry, humid or occult deposits and can affect its physiochemical properties [3]. Certainly, the dry deposit of the atmospheric particles is a longer process than the two other types of deposits [4]. Indeed, it is relevant to mention that in the arid regions, the dry deposits are particularly more important [5]. The suspension particles emitted by the factories of cement lead to the modification of the receiving grounds properties. They increase their pH and salinity and also enrich them in metallic and mineral pollutants [6].
In eastern of Morocco, Holcim-Oujda cement factory is located in a rural area in the Oujda-Taourirt corridor and surrounded by seven rural districts whose residents are based their activities on agriculture. This cement factory emits annually enormous quantities of fine particles rich in ashes of coal and some free lime (CaO), accompanied with some gases and oxides of nitrogen (NOx) [7].
The main objective of this research is to assess the impact of the dusts given out by a cement factory on the physicochemical characteristics of the soil at the vicinity of the Holcim-Oujda cement factory using Geographic information system and principal component analysis.
2. Study Area
The zone of survey is part of the corridor Oujda-Taourirt that is located in North-East of Morocco, (Figure 1). It situated in township Ain Lahjar that presents an arid climate [8] and geology to chalky dominance [9].
The winds in the corridor are constantly present, even low-speed and exercise considerable influences on vegetation and soil. Among these winds we distinguish: 1) The North winds which are of Mediterranean origin, wet and characterized by a very low speed. 2) The western winds which are of Atlantic origin and rainy. These winds dominate with 70% in the total average especially in winter and in spring. 3) The East and South winds which are of continental origin, these winds are hot and dry, especially in summer.
3. Materials and Methods
A total of 41 soil samples were collected from the six rural townships surrounding the cement factory (Figure 2). Tree soil samples were collected from inside of the factory, 13 soil samples were taken from township Ain Lahjar, 9 soil samples from township Rislane, Four samples were collected from each of the following township: Sidi Bouhouria, Bsara, Mestferki. 3 soil samples from Sidi Moussa Lamhaya and one sample from Ain Sfa District. The samples were most densely collected near the cement plant and became less densely collected with increasing distance from the cement plant. Bulk samples of 2 kg of top soil samples were collected within 0 - 3 cm depth. The soil samples were homogenized by coning and quartering, dried at 100˚C - 110˚C oven during 24 h and then finely powdered and sieved to 2 mm and further crushed in the crusher mark Hezog for analysis [10].
The pH was determined with a glass electrode in a soil solution with a report soil/water equal to 1/2.5 and electrical conductivity (EC) was determined with an electrical conductivity meter in a 1:5 soil/water suspension [11]. Mineralogical analysis (oxides of calcium, aluminum, iron, potassium, magnesium, sulphur and silica) of the soil samples were carried out by fluorescence through X rays [12].
To well present the spatial distribution around the factory of various measured parameters, Geographical information system (GIS) was used. The software surfer 8 permitted us to draw maps of isovalue. For identifying patterns in data and expressing the data in such a way as to highlight their similarities and differences, the principal component analysis (PCA) was used. PCA can provide information on the source contribution of particle composition. It was applied to quantify the source contribution [13]. Concentrations of mineralogical elements were compared using One-Way analysis of variance (ANOVA) to compute the statistical significance of the mean at various distances from the factory site. The difference for each element concentration was significant at P < 0.05 [14]. Statistical analyses (ANOVA) were performed with XLSTAT 2013 for windows.
4. Results and Discussions
The composition of cement dust is extremely variable and depends on the kiln type, cement type, source of the raw materials, and fuels being used [15]. Table 1 sum-

Figure 2. Position of sampling points at the vicinity of the cement factory (Soil samples collected inside the factory are labelled AL13, AL14 and AL15, and outside of the factory are labelled according to the initials of the townships names of sampling).
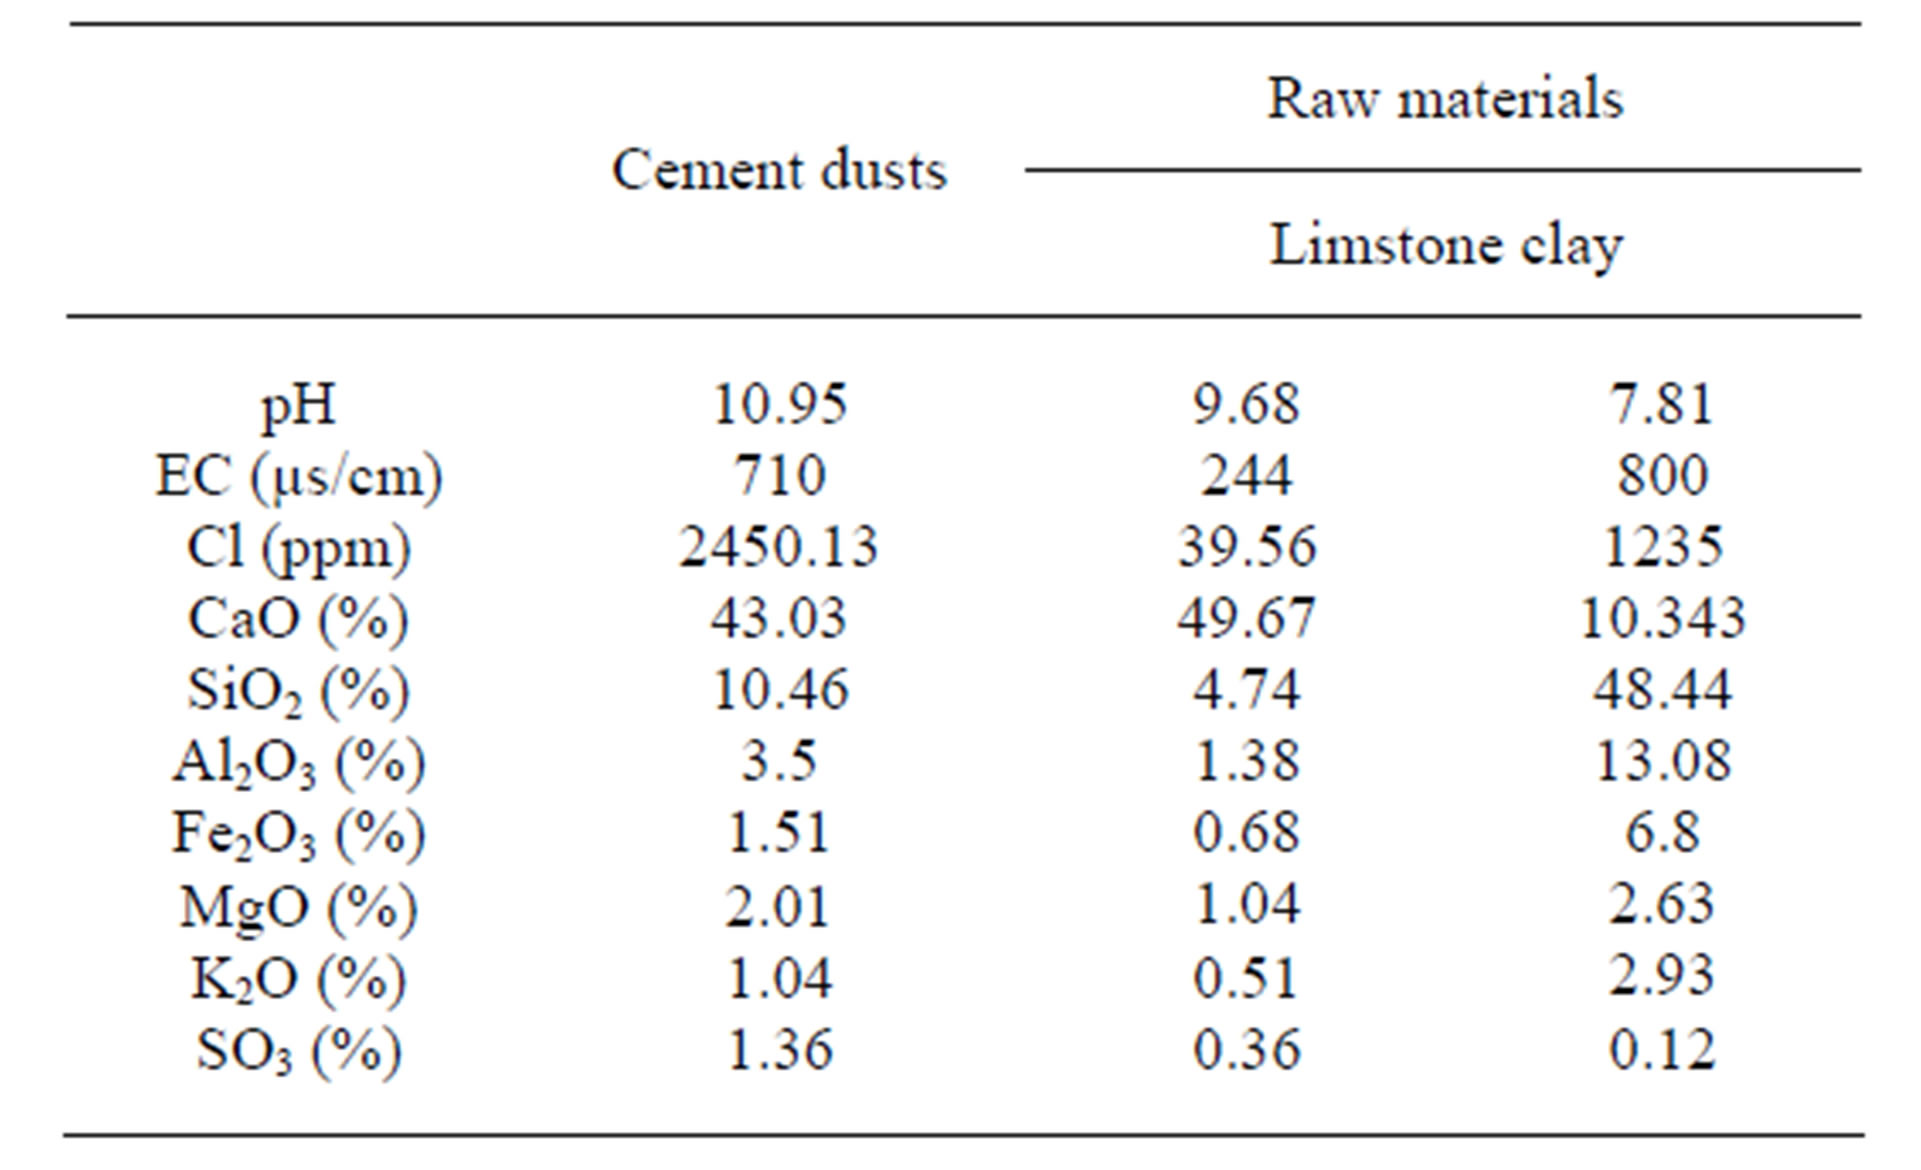
Table 1. Physico-chemical characteristics of the cement dusts and raw materials.
marize the concentrations of chemical elements in cement dusts samples collected in the chimney of cement factory and raw materials samples collected in the extraction quarries of clay and limestone. The dusts have a very basic pH (10.95). Moreover, they are characterized by an elevated salinity (710 µs/cm), and they are rich in oxide of calcium (43.03%) and chlorides (2450.13 ppm). On the other hand, they are poorer in the oxides of aluminium (Al2O3), iron (Fe2O3), potassium (K2O), magnesium (MgO), sulfur (SO3) and the silica (SiO2). These results are similar to those found by Zerrouqi and et al., [6] in the same study area.
It is necessary to note that the content of the dust in SO3 is superior to that of the raw materials. High SO3 content in cement dusts is due to removal of sulphur by alkaline materials [16].
To assessing the impact of dusts emitted by the factory on the characteristics of neighbouring top soils, we considered useful to follow the spatial variation of pH and conductivity of soils as well as their content in chlorides, particularly CaO and SO3 using geographical information system (GIS) and principal component analysis (ACP).
The first principal component has a variance (Eigen value) of 4.304 and is 61.48% of the total variance (Table 2), the second principal component has a variance of 1.205 and is 17.22% of the variability of data, the third principal component has a variance (value own) of 0.807 and is 11.541% of the total variance. The first three factors account for 90.25% of total inertia.
The chemical elements were separately planned in the factorial plan F1 × F2. We will limit our observation projection variables and samples in the circle formed by the axes F1 and F2, since they present a significant threshold superior to 15%. The inertia of these two factors is of 78.70%, at the rate of 61.48% for the F1 axis and 17.22% for the F2 axis. Figure 3 showed that PCA differentiated three groups of which each one represents an assembly of chemical elements that characterizes the issuing source:
1) Group one stands on the negative plan of the F1 and F2 axis, is represented by the characteristic elements of soil Al2O3, Fe2O3, K2O and MgO.
2) Group two stands on the negative pole of the F1 and on the positive plan of F2 axis, opposing the first group. It is represented by silica (SiO2). This is represented by RN1, RN5, RN7, BH2 and SM1. These samples have a clayey origin.
3) Group three stands on the positive plan of the F1

Figure 3. Projection of the variables (chemical compounds) on the plan factorial F1 × F2.

Table 2. Initial eigen values and variance of factors.
and on the negative plan of F2 axis. It is formed by the two elements SO3 and CaO, which are two main indicators of the pollution induced by the cement industry. This is represented by AL15 sample collected inside the factory and by MK2, MK4, RN9, AL2 and AL16 samples (Figure 4).
The F1 axis indicates the influence of local anthropogenic activities on soil samples; it opposes the 1st and 2nd groups to the 3rd group. To this axis contribute the elements Al2O3, Fe2O3, K2O, negatively MgO and CaO, SO3 positively. The F2 axis is defined by the second group of the SiO2 that opposes to the first group.
The spatial distribution of F1 factor which is achieved with the help of the geographical information system permits to determine the area impact of the cement factory The spatial distribution of this factor (dust pollution axis) (Figure 5) shows that the positive values of this factor (CaO and SO3) are concentrated inside the factory (AL15, AL13) and in its immediate neighbourhood, until 2.5 km far from the factory, particularly in the direction of west. The positive values are also observed in the soil samples resulting from de Ain lahjar and Rislane Township, because these soils have a calcareous origin. A strong concentration in CaO is also noted in BS3 sample which is collected in the neighbourhood of a career deprived for the extraction of building materials. These results are similar at those obtained by statistical analysis one-way ANOVA. Indeed, ANOVA at P < 0.05 showed that the differences observed between all chemical elements at various distances from the factory are significant, except Fe2O3 at 5 km, AL2O3 at 10 km and CaO at 15 km (Table 3). Generally at 2.5 km far from the factory, the differences are highly significant.
The CaO spatial distribution is similar to that of the SO3 (Figures 6 and 7). CaO values ranged from 6.98% to 39.19%. The SO3 was low in soil samples and they ranged from 0.14% to 1.57%. The CaO and SO3 distributions showed that the highest values were observed inside the factory, notably AL13 and AL15 and beside the careers clay (AL16). Such results were stood in agreement with the results reported by Zerrouqi and et al., [6]. CaO and SO3 Pollutants propagate around the factory and the limestone quarry at a distance approximately of 2.5 km, especially in the direction of west. Indeed, the factory is situated in Oujda-Taourirt Corridor oriented East-West. Prevailing wind in this corridor are East winds which are of continental origin, these winds are hot and dry, especially in summer. In AL8, MK1, MK2, BS3 and AS1 soil samples, the CaO values exceed 17%, because the soil of these regions is calcareous.
The relationships between pollutant elements can provide important information on their sources [17]. In this study, a significant correlation (R = 0.656) are found among CaO and SO3, suggesting that these pollutants may originate from a common pollution source (cement dusts). Taylor, [18] showed that the free lime (CaO) are formed in cement dust when limestone is heated during cement manufacturing. However, the CaO may change to CaOH and then to CaCO3 the longer the dusts are in equilibrium with the atmosphere.
The sulfur oxide in soil can have an organic or mineral origin. The accumulation of SO3 in the dust deposit collected inside the factory confirms the entropic origin of the elevation of the percentages of this element in soils inside the factory and those of its immediate neighbourhood. Karbassi and et al., [16] showed that de High SO3 content in cement factories is due to removal of sulfur by alkaline materials. It is important to underline that the SO3 present in soil can have another entropic origin, which is the combustion of the fossil fuels (coke of oil) used by the factory and which generates the SO2 [19].
The isovalue map of the pH created by the Surfer 8 software (Figure 8) showed that the soil pH for all the samples was found greater than 8 which indicated that the soils are alkaline. It averaged between 8.13 and 9.08. The isovalue map showed also 4 main pits:
1) The first is noted inside and in immediate neighbourhood of the factory. It includes the AL13, AL15 and AL14 points. The elevation of the pH in these zones can be linked easily to an important deposit of the cement dusts in these zones. The change of pH in soils to alkaline range is mostly caused by the dominant component of cement dust calcium carbonate [20].
2) The second pit, which is less important, is recorded to immediate neighbourhood of limestone quarry.
3) The third and fourth pits, in AL10 and AL7 samples respectively. The pH values upper to 8.8 propagate in the East direction towards Mestferki township and in the West direction towards Ain Lahjar township. Indeed, the soils of these tow township is calcareous. They are rich in calcite (CaCO3) and dolomite (CaMg)CO3 [21]. This rise of the pH can have fatal effects on the vegetation. As

Figure 4. Projection of the sample soil variables on the plan factorial F1 × F2.

Figure 5. Spatial distribution of the score’s samples regarding the F1 factor.
the soil pH increases, the solubility of many nutrients is reduced. As a result, these nutrients are precipitated as solid materials that plants cannot use [22].
Generally, the highest values of pH have soil samples taken from the closest neighborhood of the cement plant, and the lowest in the outermost soils. Similar relation between soil pH and the distance from the cement plant was observed by other authors [20,23].
The electric conductivity values of the soil samples vary between 78.25 and 784 µs/cm (Figure 9). These values which are lower than 800 μs/cm testify that these soils are low in salinity (<0.25 mS/cm) to moderate (0.25

Figure 6. Spatial distribution of SO3 percentage in soil.

Figure 7. Spatial distribution of CaO percentage in soil.
and 0.8 mS/cm) [22]. The upper values were registered inside the factory and in agricultural soils of Rislane township. Inside the factory and in its neighbourhood (until 2.5 km surrounding the plant), the elevation of EC is attributed at a strong content of chlorides in cement dusts (2450.13 ppm). In the soils collected from Rislane, the elevation of EC may be result of massive use of fertilizers in agriculture.
5. Conclusion
The data obtained with PCA in this study allow us to deduct that CaO and SO3 are the element tracers of the pollution led by the cement industry. It also permitted us

Table 3. Soil parameters and the variance analysis in relation to distance from the factory.
to detect the soil samples affected by the particular pollution. The use of the geographical information system is allowed to value the spatial distribution of the polluting particles to the level of soil and to determine the surface impacted by the dust deposit which is estimated to a zone of 2.5 km of beam around the factory.
NOTES