Fault Isolation of Light Rail Vehicle Suspension System Based on D-S Evidence Theory and Improvement Application Case ()
1. Introduction
With the rapid development of economy, the efficiency and safety of transportation are paid much more attention than ever before. Nowadays, urban subway has already been one of the most important means of transportation, especially, in Beijing, Shanghai, New York, London and some other big cities all over the world. However, as the urban subways’ speed increasing, a higher requirement for vehicles’ reliability and security has been put forward. The fault isolation system for the Light Rail Vehicles (LRVs) plays an important role in guaranteeing that trains run safely with high speed.
Suspension systems for light rail vehicles (LRVs) are used to support the car body and bogie, to isolate the forces generated by the track unevenness at the wheels, and to control the attitude of the car body with respect to the track surface for improving ride comfort. As a very important part of railway vehicle, the reliability of the suspension system is directly related to the whole vehicle security. Although the suspension systems are reliable, they are subjected to some modes of unexpected faults.
As we all know, some small but key components of suspension system, such as springs and dampers, the performance will significantly degrade in performance after one or two years. Once faults which are even very small and insignificant in LRVs suspension system occur, it can lead to serious accidents when the train is traveling. Therefore, it is very imperative to immediately detect and isolate the faults of vehicle suspension system after the faults occur.
Fault diagnosis for LRVs suspension system has received some attention in recent years. Some studies on the condition monitoring of railway vehicle and suspendsion systems have been reported in [1-3] and the references therein. In [3], the fault detection and the isolation issue of railway vehicle lateral suspension system are concerned, where a Kalman filter-based method has been proposed for detecting and isolating faults in railway vehicle suspension system based on the derived vehicle dynamic model. The method is computationally efficient and responses to the abrupt fault rapidly, thus suitable for applying online to detect and isolate the abrupt or hard faults, which usually need to be drawn immediate attention. However, the paper assumed that the vehicle parameters are known precisely and the simulation is still based on a simple linear model.
Sensors are used extensively in condition monitoring and diagnosis system by providing information of the systems. However, due to the complexity of environment, limitation of sensor performance and imperfection of information acquisition technique, partial information acquired by single sensor is usually uncertain. As a result of these shortcomings, a single sensor has limited capabilities to resolve uncertainties and ability to provide consistent isolation results. In [4], many effective methods in preprocessing data have already discussed. In addition, five methods for combining this uncertain information commonly used in fault diagnosis are those presented by Bayesian, Fuzzy, Dempster-Shafer (D-S) evidence, Neural Network (NN) and Integrated information fusion theories [5]. Moreover, the characteristics and limitations of these information fusion methods for fault diagnosis are analyzed.
In this paper, isolate issue of fault of suspension system in LRVs based on multi-sensor information fusion is investigated. Nine sensors are equipped on the three rolling stocks. At first, an innovative approach for the fault isolation of Light Rail Vehicle (LRV) suspension system based on the Dempster-Shafer (D-S) evidence theory is studied. This approach mainly uses the Eros, which is applied for similarity measurement in the fault feature database. In the first step, a fault feature database for the LRVs suspension system is built. By using the fault detection method in our precious work [6], a Kalman filter is applied to generate the residuals for fault isolation, and then a fault feature database in the frequency domain is built in which some typical suspension system failures are included. When there is a fault detected, Fast Fourier Transform is applied to the residuals to obtain the amplitude-frequency fault feature. The second step is to determine the belief function assignment of each sensor corresponding to every fault in the fault feature database using Eros similarity measure for frequency spectrum. Finally, belief function assignment fusion by using Dempster-Shafer evidence theory is carried out.
In order to increase the accuracy, we put forward the other effective approaches based on D-S evidence theory. In the first step, the data information of time domain and frequency domain, acquired from these sensors, are used for obtaining the feature information, which includes mean, standard deviation, skewness and kurtosis in time domain and frequency centre, root mean square frequency and root variance frequency in frequency domain. Similarly, a fault feature database in the time and frequency domain is built in advance in which some typical suspension system failures are included. Secondly, the Basic Belief Assignment (BBA) for each fault feature is determined by using the norm distance measurement. It is applied to obtain the similarity between the fault feature of the new occurred fault and the one recording faults in the database. Finally, the obtained seven fault features (BBAs) are combined by D-S evidence theory for enhancing the isolation accuracy.
2. LRV Suspension System
The conventional railway vehicle suspension systems are depicted in Figure 1 [7]. There are 2 degrees of freedom (DOFs) for each car body associated with bounce and pitch motions and one DOF for each bogie associated with its bounce motion. Consequently, a 9-DOF dynamic model is built.

Figure 1. Multi-body dynamic model of the LRV.
The dynamical equations of the suspension system for a vehicle moving on a straight track are derived as follows:

Here,  and
and  are the vertical displacement of the center of gravity (c.g.), pitch angle of the c.g. of the first power car body and the vertical displacement of the c.g. of the first power bogie, respectively.
  is the track vertical profile (track irregularity) for the first power bogie. The rest symbols have the similar meanings to the relative vehicles.
The state-space of the suspension systems are as follows:

where

As the space is limited, the more details about the state-space can be found in [6], as well as the vehicle parameters. The problem considered in this paper is that how to isolate different faults in damping and spring and different fault magnitudes between 0% and 100% coefficient reduction of LRVs suspension system.
3. Fault Isolation Algorithm
The main task for the fault isolation in this paper is to isolate different faults and magnitudes based on D-S evidence theory. Nine sensors equipped on three rolling stocks are used to acquire information for detecting the cause of malfunction. In order to isolate different faults and magnitudes effectively, the following four processes are required. These processes are database foundation, similarity measurement, information fusion and decisionmaking. The proposed fault isolation algorithm for LRVs suspension system is shown in Figure 2.
In the first step, two databases are built. The residual is generated by a fault detector (an observer or Kalman filter, etc.). The second step is to determine the BBAs of D-S evidence theory by using the Eros and norm distance measurement respectively. Thirdly, the obtained BBAs are combined by D-S evidence theory for enhancing the isolation accuracy and the fusion BBA m is obtained. Finally, based on the principles of decision making, the fault isolation decision is made. The one in the fault database which has the biggest belief function assignment is the most possible occurred fault.
3.1. D-S Evidence Theory and Principles for Decision Making
3.1.1. Belief Function Assignment and Belief Function
Define the frame of discernment  as domain of evidence theory, and it includes finite basic elements
 . These elements are defined as basic fault model in the fault detection. In addition, events of
  are mutually exclusive. When the frame of discernment
  is determined, the belief function
  is defined as a mapping of the power set
  to a number between 0 and 1 [8], i.e.
 (1)
(1)
where,  is a null set,
  expresses the degree of confidence for the subset
 . In this fault isolation of LRVs suspension systems, it can be considered as a belief function value with respect to a certain fault.

Figure 2. Flowchart of the proposed fault isolation algorithm.
3.1.2. D-S Evidence Combination
Based on the rules of D-S combination, suppose  are two belief function assignments responding to the same frame of discernment
 ,
,  and
and  are their focal elements respectively, we have
 (2)
(2)
 (3)
(3)
where C represents a basic probability belief associated with conflicts among the sources of evidence. It is determined by summing the products of belief function assignment of all sets which their intersection is null. The denominator 1 - C in Equation (2) is a normalization factor. The larger the value of C is, the more conflicting are the sources, and the less informative is their combination.
The produced belief function m(A) is the value of belief function responding to all fault models through D-S evidence combination. Note that , which represents the combination of m1 and m2, and carries the joint information from the two different sources. The above rule of evidence combination also satisfies the following relationship:
 (4)
(4)
 (5)
(5)
3.1.3. Principles for Decision Making
Getting the fusion belief function assignment m, the following is to make decisions for isolating faults based on obtained combination values. The basic principles for decision making are shown below [8-10].
1) The target type of decision should have the maximum belief function assignment;
2) The difference between the target type and other types of belief function assignment should be larger than a certain threshold.
3.2. Eros: Extended Frobenius Norm for Similarity Measurement
The singular value decomposition  of a matrix is the factorization

where U and V are column-orthonormal matrixes,  is a diagonal matrix of the eigenvalues
  of A. The eigenvalues and the corresponding eigenvectors are sorted in non-increasing order. V is called the right eigenvector matrix.
Now we introduce a similarity measure of fault feature datasets. Let A and B be two fault feature items of size  and
and , respectively. Let
  and
and  be two right eigenvector matrices by applying SVD to the covariance matrices,
  and
and , respectively. Let
  and
and ,
,  and
and  are column orthogonal vectors of size n. The Eros similarity of A and B is then defined as
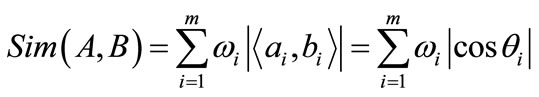
where  is the inner product of
  and
and ,
,  is a weight vector which is based on the eigenvalues of the fault feature dataset. Recall that by applying SVD to the covariance matrices, we obtain not only the principal components but also the eigenvalues that represent the variances for principal components. For example:

where


 can be obtained by performing the following equations:


 is the angle between
  and
and . The range of Eros is between 0 and 1, with 1 being the most similar.
This algorithm measures the similarity between two fault feature applying the right eigenvector matrices that contain the principal components and associated eigenvalues. Using the right eigenvector matrices for similarity computation has the following advantages: the size of the right eigenvector matrices are fixed at  and it is significantly small compared to the number of variable, n, for fault feature items.
3.3. Feature Extraction
The feature extraction of the information is a critical initial step in fault isolation. Its accuracy directly affects the final isolation results. In this paper, the statistical information of time domain data and frequency domain data are used for obtaining the feature information from the sensors. Seven features are considered. They are mean, standard deviation, skewness, kurtosis in time domain and frequency centre, root mean square frequency and root variance frequency in frequency domain.
3.3.1. Features in Time Domain
These feature described here are termed statistics because they are based only on the distribution of signal samples with the time series treated as a random variable. In most cases, the probability density function (pdf) can be decomposed into its constituent moments [11]. If a change in condition causes a change in the pdf of the signal, then the moments may also change; therefore, monitoring these can provide diagnostic information. The moment coefficients of time-waveform data are calculated by
 (6)
(6)
where xi is the ith time historical data, and N is the number of the data points.
The four time domain features, mean C1, standard deviation C2, skewness C3 and kurtosis C4 can be computered using the following relationships:
 (7)
(7)
The above four time domain statistical features index, which can’t be considered in isolation, need to confirm each other in fault diagnosis.
3.3.2. Features in Frequency Domain
Frequency domain is another description of a signal. It can reveal some information that can’t be found in time domain. In this paper, frequency center FC, root mean square frequency RMSF, and root variance frequency RVF are introduced as follows.
 (8)
(8)
where s(f) is the signal power spectrum. FC and RMSF show the position change of main frequencies, RVF describes the convergence of the spectrum power.
3.4. Distance Measurement
Let
 (9)
(9)
where A presents the ith feature vector of one fault in the fault feature database; B presents the ith feature vector of the new occurred fault. 9 is the number of sensors.
Intuitively, the more similar is A to B, the more probable is the measuring fault in the database. Conversely, the dissimilar is A to B, the less probable is the measuring fault. There are many measurements for quantifying the distance between the occurred fault features and the fault prototypes. We propose to use the following method to measure the distance:
 (10)
(10)
where dim is the distance of the ith feature between A and B. 16 is the number of the faults in the database, and A is the one of that. The distances of features in the feature database between all faults and new occurred fault can be captured in a matrix D:

Each row in matrix D represents the distance of a feature between the new occurred fault and all recorded faults in the database; each column of D is the distance of seven features between one fault in the database and the new occurred fault. M is the number of the considered faults in the database. The smaller is the distance  in the matrix D, the more probable is the mth fault. Define
  as the similarity of features and expressing in a matrix P after normalizing, we have:
 (11)
(11)

where pk can be seen as the BBAs of the kth features to all the recorded faults in the database. Therefore, the bigger is the similarity pim in the matrix P, the more probable is the mth fault.
4. Case Study
In this section, the application of the D-S evidence theory to the fault isolation for the LRVs is presented. Firstly, in order to test the effectiveness of information fusion, the same fault magnitude between the fault database and test fault database are tested in the application. However, in reality, an arbitrary fault magnitude between 0% and 100% coefficient reduction can come forth. So the different fault magnitudes are studied in the improved application case.
4.1. Former Application Case
As presented in section 2, the considered LRVs suspension system has nine outputs from nine sensors. A Kalman Filter is applied to generate the residuals. When a fault occurs in the system, the residuals have some obvious changes in the time domain. These changes (fault feature in the time domain) are more obvious in frequency domain. Therefore, in this paper, the datasets with amplitude-frequency information in 9 dimensions, which obtained by performing Fast Fourier Transform on the residuals, are utilized as the multivariate fault signature series for similarity measure. In this case, the Eros is applied for similarity measurement.
4.1.1. Fault Feature Database
Eight representative component faults are considered in this paper and their fault feature database in the frequency domain are built as shown in Table 1. They are the secondary damper  failure in the former power car, the secondary damper
  failure in the later power car, the secondary damper
  failure in

Table 1. Fault classification.
the trailer car, the primary damper  failure in the former power car and all the spring

failures related to the same vehicles. In addition, as shown in Table 1, two cases about the fault magnitude, which are 33% and 100% coefficient reduction in these components, have been considered. Moreover, in this fault feature database, the normal condition is concluded. So there are 17 faults in this database in total. In addition, the faults and fault magnitudes in the test fault database are the same with the ones in the fault feature database.
4.1.2. Fault Isolation Based on D-S Evidence
After applying the Eros algorithm, the similarities between the new fault in the test database and all faults in the fault feature database can be obtained. Note that, it is necessary to calculate the similarity three times in terms of nine sensors in the same vehicle. Let the new normalized similarities between the new fault and all faults in the fault feature database be the belief function assignments . To improve the accuracy of fault-identification, the obtained belief function assignments are fused by using D-S evidence combination theory. Next, let’s analysis and calculate the fusion belief function assignment of fault
  as an example.
Here, fault  is selected as the new fault so that it is convenient to verify the accuracy of the results. Based on the obtained normalized similarities of three groups of sensors in Table 2, according to Equation (5), firstly, the former two rows of information are combined to achieve a new belief function value
 , and then by using the

Table 2. Fusion results based on D-S evidence theory of the new occurred fault F1.
same method, fusing the last row and the obtained  is to acquire the final fusion belief function assignment
 . Therefore, in the first step, C can be obtained using Equation (3):

Then using Equation (2), the following fusion result can be obtained:
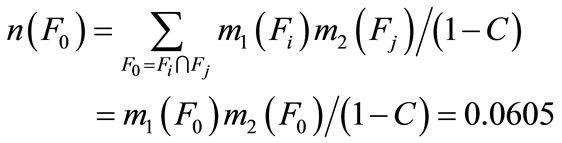
In the second step, the third row and the new obtained are fused according to the Equations (2) and (3) in the same way, and then the final fusion results can be obtained:

Finally, based on the principles of decision making, the decision about the isolation result is made.  is the maximum of the belief function assignments. So the fault
  is considered as the most possible occurred fault. Hence, this obtained result agrees with the fact and the accuracy of the method is verified. For other types of fault, the same method is applied to obtain the results. As space is limited, only one fault is showed in Table 2.
From the final results, some conclusions are given following. Firstly, the isolation results, obtained by single group of sensors, are consistent with the fusion isolation result, such as faults . Moreover, they achieve exact isolate fault. However, the values obtained by single group of sensors are close to each other so that they can’t isolate faults effectively. Secondly, for example,
  faults the fusion isolation results are accurate to isolate fault, while the results from single group of sensors cannot achieve this result. Finally, for the three faults
  the fusion isolation results are not consistent with the actual occurred faults due to uncertainty and incompleteness of information, and the error of the Eros algorithm. However, the next possible occurred fault in the fusion isolation results is the actual fault among these inconsistent faults. In general, this method, multi-sensor information fusion based on the D-S evidence theory and Eros, is effective and accurate on fault isolation that not only reduces the uncertainty of fault isolation substantially, but also effectively improves the accuracy of recognition to the fault model.
4.2. Further Application Case
From the point of reality, it is imperative to build the other test fault database, which is different from the magnitudes in the fault feature database, since an arbitrary fault magnitude between 0% and 100% coefficient reduction can come forth. In addition, in order to improve the accuracy of the Eros algorithm, in this further application case, the norm distance is applied for similarity measurement.
4.2.1. Fault Feature Database
The types of fault in the database are the same with the faults in the former case, as shown in Table 3, two cases about the fault magnitude, which are 25% and 50% coefficient reduction in these components, have been considered. However, in reality, an arbitrary fault magnitude between 0% and 100% coefficient reduction can come forth. They are classified as small fault (<25%), middle level fault (<50% and >25%) and sever fault (>50%). For demonstrating the effectiveness of the D-S evidence theory to the LRVs system, here, the considered new occurred fault types are the same with the recorded faults in the database, while the fault magnitudes are different, which are 40%, 60% and 80% coefficient reduction. Due to the space is limited, only isolation results of the one case which is 40% coefficient reduction are listed in Table 4.
4.2.2. Fault Isolation Based on D-S Evidence
From the whole final results, all fusion results can get exact isolation results. Therefore, this fault isolation method,

Table 3. Fault classification.

Table 4. Fusion results based on D-S evidence theory of the new occurred fault c1p1_40.
based on the D-S evidence theory and distance measurement, is effective and accurate on fault isolation.
In addition, as the space is limited, other two cases aren’t listed, which are 75% and 100% coefficient reduction in these components; besides, for the occurred faults, two cases about the fault magnitude, which are 60% and 80% are corresponding. The smaller range interval is chosen, the more precise isolation results are obtained. In summary, the results show that the isolation method can overcome the uncertainty of information and improve the accuracy of fault isolation in the fault type and fault pattern for LRVs suspension systems.
5. Conclusion
This paper proposes a new method to isolate faults of LRVs suspension system and its further case. A Kalman filter is applied to generate the residuals for fault isolation. A fault feature database is built based on the fault features in the time domain and frequency domain. The Eros and norm distance measurement are used to acquire the similarities between the fault feature of the new occurred fault and the one recording faults in the database. These calculated similarities are converted in the form of BBAs, which are then combined using D-S evidence theory. In general, this method, multi-sensor information fusion based on the D-S evidence theory and distance measurement, is more effective and accurate on fault isolation in the fault type and fault magnitude for LRVs suspension system, which not only reduces the uncertainty of information, but also effectively improves the accuracy of recognition to the fault type and fault magnitude when compared to the former application case, in which the similarity of features is obtained by using Eros method.
6. Acknowledgements
This work is partly supported by Chinese 863 program (Contract No. 2011AA110503), State Key Laboratory of Rail Traffic Control and Safety (Contract No. RCS 2011ZZ005) and Ph.D. Programs Foundation of Ministry of Education of China (grant number: 20110009120037).