A Bioenergetic-Redox Approach to the Effect of Live Yeast on Ruminal pH during Induced Acidosis in Dairy Cow ()
1. Introduction
The yeast Saccharomyces cerevisiae has been used as an alternative to antimicrobial feed additives for over 10 years in ruminants. Production responses showed an improved live weight gain in beef cattle [1,2] and an increased milk yield and fat production in dairy cows [3,4]. However, responses were highly variable and apparently influenced by the composition of the diet and the animal’s physiological stage [5,6].
The yeast is generally available in two different directfed microbial (DFM) forms: the yeast culture products and the live yeast cells products. The yeast culture products are the result of fermenting selected milieu with baker’s yeast and drying the whole culture medium. They contain some viable yeast and the entire culture medium on which it was grown. Live yeast products are obtained by drying live yeast cells under special procedures, without the culture medium, maintaining a higher live cell count. Although these two DFM forms differ in their preparation and in their composition, Lynch and Martin [7] detected only some small differences in their effects on in vitro mixed ruminal microorganism fermentation.
Most of the in vivo and in vitro research has focused on yeast culture products. Their effect was mainly attributed to the supply of growth factors such as dicarboxylic acids, amino acids and vitamins [8] that stimulate lactate uptake and cellulose digestion by pure cultures of ruminal bacteria [9]. However, during the past few years, the use of live yeast products gained an increased interest but few studies have been conducted to explain their specific mode of action.
Beneficial effects of live yeast on volatile fatty acids production and profiles have been found in vitro and in vivo [10]. They were generally non-significant but with high concentrate diets, the propionate production was increased. Other studies showed a better utilization of ammonia thereby contributing to an increase in ruminal bacteria [11-13]. Indeed, the main effect of live yeast appears to be the stabilization of ruminal pH by preventing lactate accumulation, a feature of sub-acute ruminal acidosis (SARA). The result is similar to those obtained with yeast culture products [14] despite the fact that the supply of growth factors by live yeast is unlikely.
It has been suggested by Wallace and Newbold [15] that the effect of live yeast on ruminal pH is central to the action of this DFM in improving ruminant productivity. But what causes this stabilization in ruminal pH is not clear as the mechanisms involved have not yet been fully elucidated. Among different hypotheses suggesting the effects in ruminants, the ability of live yeast to scavenge oxygen in the rumen was proposed by Newbold et al. [16] and Mathieu et al. [17]. Oxygen enters the rumen at various times during daily feed cycle [18] and since it is toxic to anaerobic rumen bacteria, it inhibits bacterial growth and adhesion of cellulolytic bacteria to fiber. This observation was confirmed by Newbold et al. [19] who showed that a live yeast respiration-deficient mutant failed to stimulate the total and cellulolytic bacterial populations under conditions in which the parent strains were effective. Due to undetectable level of oxygen in the rumen, even with an oxygen electrode [20], thermodynamics have been employed in the present study to calculate the partial pressure or fugacity of oxygen 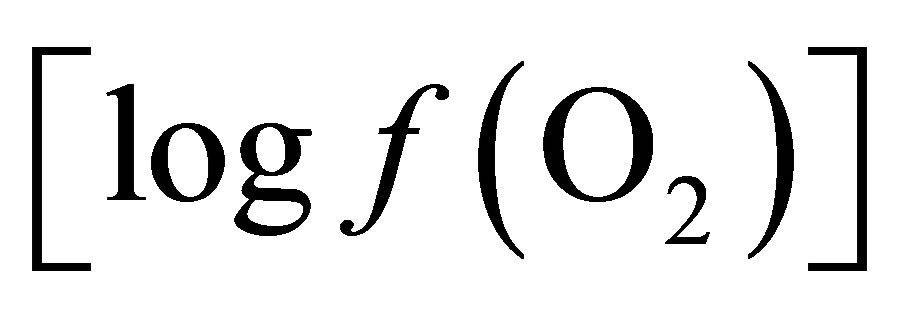 in the liquid phase and to apply the concept formerly proposed by Kohn and Boston [21] to explain the mode of action of the active live yeast.
The objectives of this work were a) to confirm the effect of live yeast (ActisafÒ) on ruminal pH and redox potential during induced SARA in dry cow, b) to explain the live yeast effect on ruminal fermentation by calculating values of oxygen fugacity 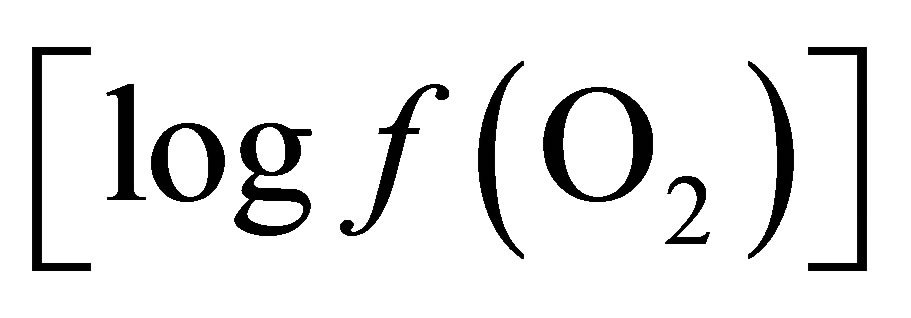 from O2- H2O and lactate-propionate redox couples and their relationship with pH stabilization.
2. Materials and Methods
2.1. Animals, Diets and Experimental Design
Two non-lactating Holstein cows, fitted with permanent ruminal cannulas, were randomly assigned to 2 treatments: control (CD) and live yeast (LYD) diets, in a 2 ´ 2 Latin square design. The control diet consisted of a total mixed ration (TMR) offered twice daily (0900 and 1700 h). This diet was composed of 50.9% corn silage, 23.9% ground corn, 15.8% ground wheat, 8.1% soybean meal and 1.4% mineral premix, on a dry matter (DM) basis. The premix consisted of 7% P, 21% Ca, 6% Mg and 1% Na. The cows were each fed 8 kg DM per day. The LYD included CD plus 4 g of live yeast (ActisafÒ, 1010 cfu/g DM). The LY was offered daily in two equal proportions as top-dressing on the total mixed ration. For each treatment, four kinetics of pH and redox potential (Eh) were established per cow per period with simultaneous sampling of ruminal fluid.
2.2. Sampling and Measuring Devices
The sampling device used in this experiment for the measurements of pH and Eh, was described by Marden et al. [22]. It consisted of a ring-shaped lead filter, covered on both sides with a sieve cloth. The filter was placed in the ventral side of the rumen to benefit maximum ruminal contractions. Ruminal fluid was pumped out of the rumen by a peristaltic pump (Gilson, Minipuls 2, Viliers Le Bel, France) into a thermostatic vessel (39˚C) for pH and Eh measurements. This system allowed continuous anaerobic measurements and the collection of representative ruminal samples for analysis. The animals rapidly became accustomed to the instrument and ate, ruminated, and behaved normally so that measurements could be taken 1 h after introduction of the device.
The pH, Eh and temperature measurements were made by means of three electrodes connected to a digital pH meter (Metrohm model 713 CH-9101, Herisau, Switzerland): a glass pH electrode (combined electrode with diaphragm DG SC and with Ag-AgCl as reference), an Eh platinum electrode (Pt SC) and a platinum thermoelectrode (Pt 100 RNEA911-Pt100). Electrodes were placed in the collected rumen fluid at a depth of 4 cm. Measurements were taken at 1 h intervals from 1 h before feeding to 8 h after feeding. After each 9 h period, the electrodes were rinsed with distilled water, then dipped in NaOH (1 N) and washed again with distilled water.
Samples (10 ml) were collected at 2 h intervals during the measurement period. One ml of mercuric chloride (2%) was added and the samples frozen at −15˚C for subsequent volatile fatty acids (VFA) and lactic acid determinations.
2.3. Calculations
2.3.1. Redox Potential
The redox potential (Eh) is the potential difference between a platinum electrode and a standard hydrogen electrode. Since the latter was replaced by an Ag-AgCl reference electrode, all records were corrected using the formula:
Eh = E0 + C where E0 (mV) is the potential of the platinum electrode and C is the potential of the Ag-AgCl reference electrode relative to the standard hydrogen electrode, i.e. +199 mV at 39˚C [23].
2.3.2. Oxygen Partial Pressure
According to Dalton’s Law of Partial Pressures, the partial pressure of a particular gas is the pressure exerted by this gas in a gas mixture if all the other gases were removed.

2.3.3. Thermodynamic Calculation of the Oxygen Fugacity
In a chemical reaction, the profile of products formed depends on the concentration of the reactants and enzymatic activity. When the concentration of the precursors becomes insufficient relative to products, the reaction will not be able to proceed. In the rumen there are numerous redox reactions in which oxygen intervenes. From reactant and product concentrations in the milieu, a 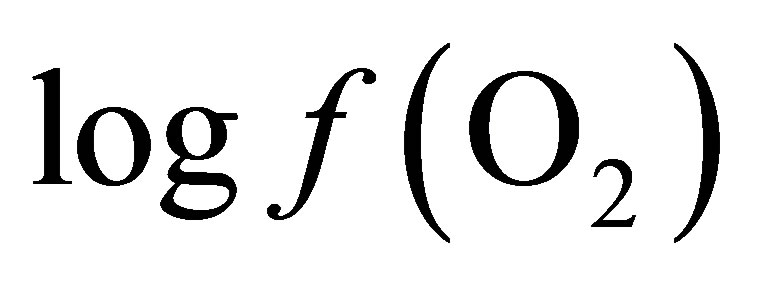 value can be calculated for each reaction to indicate its feasibility. A system, in which oxygen is present either as reactant or product, undergoing a reversible chemical reaction can be represented as follows:

where a, b, c and d are the number of moles of A, B, C and oxygen participating in the reaction.
Using the Nernst equation for chemical reactions and the law of mass action:
 (1)
(1)
where 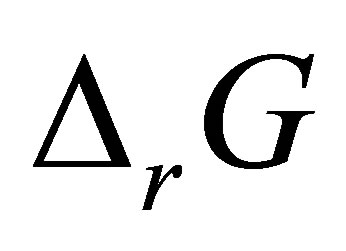 is the Gibbs free energy change,
 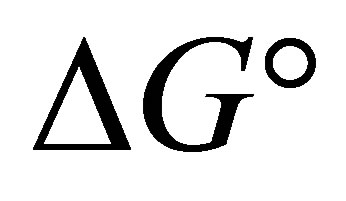 is the standard free energy change under standard conditions, R is the gas constant (8.3145 JK−1∙mol−1), T is the temperature in Kelvin (298.15 K) and
  .
.
When considering the system in equilibrium, i.e. 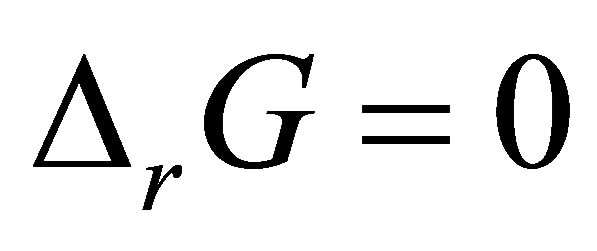 ,
, 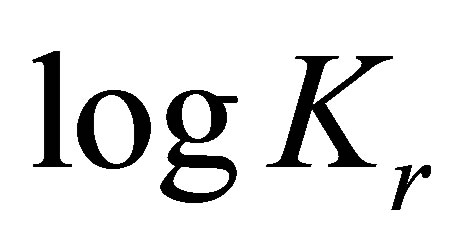 can also be expressed as:

where
 ,
,
 being the standard free energy of formation under standard conditions.
 (2)
(2)
For electrochemical reactions [24,25], the Nernst equation can be transformed into:
 (3)
(3)
where Eh is the redox potential under conditions chosen, 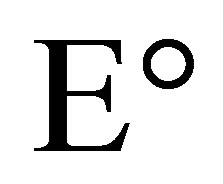 is the change in reducing potential for a redox pair under standard conditions, n is the number of electrons transferred and F is Faraday’s constant (9.6487 × 10⁴ C∙mol−1).
In order to determine the  value characterizing the ruminal milieu, the equation of water dissociation (O2-H2O couple) was used according to Picek et al. [26]:

For conditions where the activity of water is equal to 1:
At 25˚C (298.15 K)
 (4)
(4)
Thermodynamic constants varied according to the temperature and can be estimated or calculated between 0˚C and 300˚C [27]. In this study, the ruminal temperature was assumed to be 39˚C or 312.15 K. Given the Gibbs free energy, the enthalpy (ΔH) and the entropy (S), it is possible to calculate these variations by integrating the calorific capacity (Cp) according to Equation (5) [28]:
 (5)
(5)
At 39˚C (312.15 K)
 (6)
(6)
The calculation of the 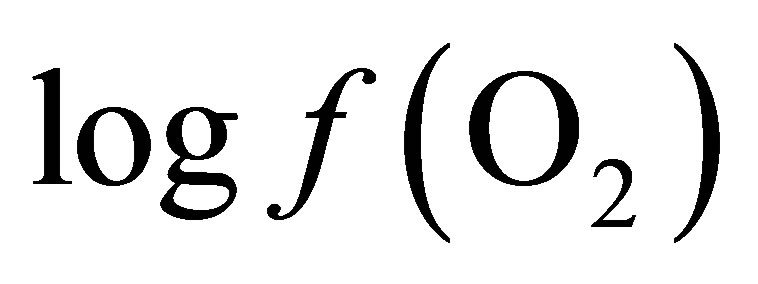 value requires only the concomitant measurements of pH and Eh.
2.4. VFA and Lactic Acid Determinations
Analyses of VFA were performed in accordance with the gas chromatographic (GC) separation procedure [29] that allowed the determinations of acetate, propionate and butyrate. After thawing and centrifugation (2000 g for 20 min), a 1 ml supernatant was added to 100 µl H3PO4 (5% v/v) and 1% v/v of 4-methylvaleric acid. The GC used was Hewlett Packard 5890 Series II with a FID detector (Avondale). The concentrations of VFA were expressed in mM.
Lactic acid (Dand L-) isomers were determined by means of an enzymatic assay according to the Boehringer Mannheim method (Kit Boehringer, Cat. No. 1 112 821, France) and expressed in mg per liter.
2.5. Statistical Analyses
The responses of pH, Eh, 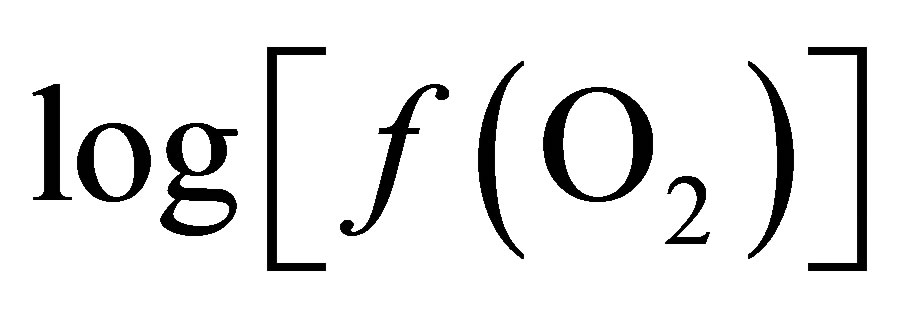 , total VFA concentrations and lactic content were analysed as a splitplot in time using repeated measures (SYSTAT Version 5.03 for Windows, SYSTAT Inc., Evanston, IL) which included polynominal contrast analysis. In the model, the main plot included cow, treatment and period whereas sampling time and pertinent interactions (time ´ period, treatment ´ time and cow ´ time) were considered in the subplot. The model used was:

where Y is the dependent variable, 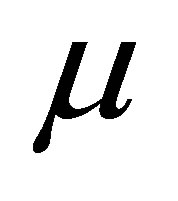 is the overall mean,
 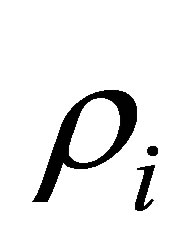 is the period effect,
 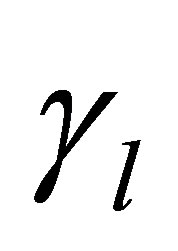 is the cow effect,
 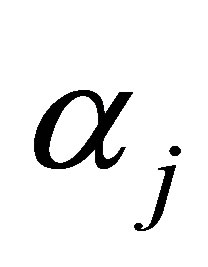 is the treatment effect,
  is the cow effect,
  is the sampling time effect,
 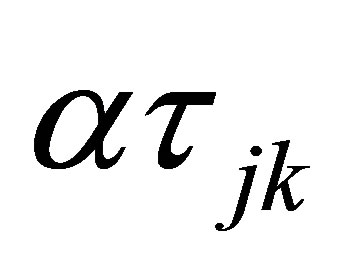 is the interaction effect between yeast treatment and sampling time and
  is the residual error. Moreover, trend effects for interaction of treatment by sampling were analyzed. All tests are carried out at 5% level of significance and only significant effects were reported.
3. Results and Discussion
3.1. Ruminal pH
The ruminal pH in animals fed CD varied from 6.39 to 5.80 during the 9 h period of measurement (Figure 1). The pH values measured were characteristic of subacute acidosis (pH < 6, during 4 h per day) as defined by Sauvant et al. [30]. Supplementing the CD with 4 g of LY shifted the pH range to between 6.44 and 6.08. A significant difference (P = 0.01) between the two treatments and an interaction time ´ treatment were observed (Table 1). When the cows were fed LYD, the ruminal pH was higher than with CD. However, for both diets, it decreased after feeding, reaching its lowest value after 4 h. Beyond, the pH remained under 6 when fed CD whereas

Figure 1. Dynamics of ruminal pH one hour before feeding (F) and during eight post-feeding hours. Vertical bars show the SE.

Table 1. Effect of live yeast on mean ruminal pH, Eh and 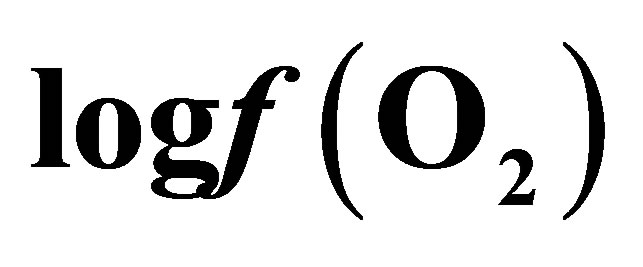 during a measuring period of 9 h.
CD = control diet; LYD = live yeast diet; SE = standard error.
with LYD, it increased progressively towards its initial value.
These results confirmed those obtained in lactating dairy cow [31] and in sheep [10] showing that supplementation of the diet with LY lessened the drop in pH after feeding a high starch diet when compared with animals not fed LY. The nature of diet fed seems to be determinant to the effect of LY: when sheep were fed a concentrate diet, there was an effect on pH [32] whereas with a fiber-rich diet, no significant difference was measured [33,34].
Feeding high concentrate-based diets causes a sudden drop in pH due to the rapid utilization of sugars by ruminal bacteria, particularly Streptococcus bovis [35]. As pH drops, Streptococcus bovis ferments glucose to lactate instead of VFA’s. However, when the diet is highly fermentable, the lactate produced is efficiently utilized by ruminal bacterial species such as Megasphaera elsdenii or Selenomonas ruminantium [36]. These beneficial bacteria convert lactate to propionate which is protonated and absorbed. Increasing the proportion of concentrate disturbs the equilibrium between lactate-producing and lactate-utilizing bacteria thereby favoring the action of Streptococcus, because the latter is less sensitive to low pH [37].
3.2. Ruminal Eh
The redox potential of the ruminal fluid varied from –168 to –185 mV for CD (Figure 2) and the mean value during the measurement period was –176.5 mV. These

Figure 2. Dynamics of ruminal Eh one hour before feeding (F) and during eight post-feeding hours. Vertical bars show SE.
results are in accordance with Broberg [38] who measured an increase in the redox potential post-feeding attributed to an oxygen supply during feed intake.
The values found in the literature appeared to differ considerably according to authors. They varied from –150 to –260 mV [39,40] and from –302 to –340 mV [17] in sheep; from –145 to –190 mV [18] and –327 to –352 mV [41] in goat and from –335 to –370 mV [42] in wether. The major differences between authors may be attributed to the fact that the most recent reports considered a potential difference (E0) instead of the redox potential [22].
Supplementation with LY reduced the ruminal Eh to values between –190 and –206 mV with a mean value of –196.2 mV over the period. A highly significant difference (P < 0.01) of approximately 20 mV was observed between CD and LYD (Table 1). The observed difference agree with results of Mathieu et al. [17] who recorded a drop of 18 mV in sheep fed LY.
3.3. Volatile Fatty Acid Profile
The concentrations of total VFA varied between 93.5 and 108.5 mM for CD, with a mean of 102.4 mM over the experimental period, compared with a mean of 114.4 mM in the LYD fed cows (Table 2). The concentrations of VFA in the ruminal liquid-phase were maximal 4 h after feeding (105.9 mM) for CD and 6 h for LYD (120.4 mM). Similar average proportions of acetate were measured in the CD (64.5% total VFA) and YD (64.0% total VFA) fed animals. The propionate increased significantly (P = 0.01) in LYD-fed animals whereas the butyrate level decreased (P = 0.04).
A tendency for increased ruminal total VFA concentrations has been observed in vivo, when LY was incorporated in the diet [43]. Besides, as the proportion of concentrates in the diet increased, Chademana and Offer [44] reported an increasing amount of total VFA with LY fed animals. In most cases, the yeast stimulated the production of propionate [1,31,45] and this is in agreement


Table 2. Effect of live yeast and sampling time on ruminal total volatile fatty acids concentrations and acetate, propionate, butyrate proportions.
VFA = volatile fatty acids; CD = control diet; LYD = live yeast diet; SE = standard error.
with the results of the current study.
3.4. Lactic Acid Content
The lactic acid content was determined on the same samples used for VFA analyses. For CD, the lactic acid concentration reached a maximum value of 21.0 mg/L, whereas for LYD, only 12.8 mg/L was recorded at 4 h post-feeding showing an overall reduction of 55% in total lactic acid for LYD over the sampling period (Table 3). Lactic acid concentration remained constant during the next 4 h for CD, while it decreased drastically for LYD to a minimum value of 2.1 mg/L. Significant differences (P < 0.01) and interactions between time and treatment were observed for total lactate (Dand L-lactate).
The results indicated that, in these experimental conditions, lactate does not accumulate in the ruminal milieu in the presence of LY. They are in accordance with those of Nisbet and Martin [46] and Chaucheyras et al. [47]. In addition, the decrease in lactate (pKa = 3.86) seemed to be closely associated to higher pH values and to an increase in propionate (pKa = 4.87).

Table 3. Effect of live yeast and sampling time on ruminal lactic acid contents.
CD = control diet; LYD = live yeast diet; SE = standard error.
Cattle are generally able to maintain ruminal pH within physiological limits for values ranging from 6.2 to 6.7. This regulation is ensured by VFA absorption, microbial adaptation, endogenous buffer production and feed intake level. If the proportion of fermentable carbohydrates in the diet is increased, a greater VFA production results and this renders the system unstable. Under these circumstances, cattle may develop an acidotic state.
In this study, when comparing fermentative parameters characterized by the two diets, it was shown that increased ruminal VFA concentrations (LYD vs CD) were not associated with a drop in ruminal pH when supplementing with LY. Consequently, it seems that accumulation of VFA in the ruminal milieu with LYD was not be responsible for inducing SARA but the latter appeared to be the result of a build-up of lactic acid as seen with CD.
3.5. Thermodynamic Control of Live Yeast Effect in the Rumen
Curves of the oxygen fugacity calculated from pH and Eh values (Figure 3) indicated a similar trend before and after feeding for both diets. The 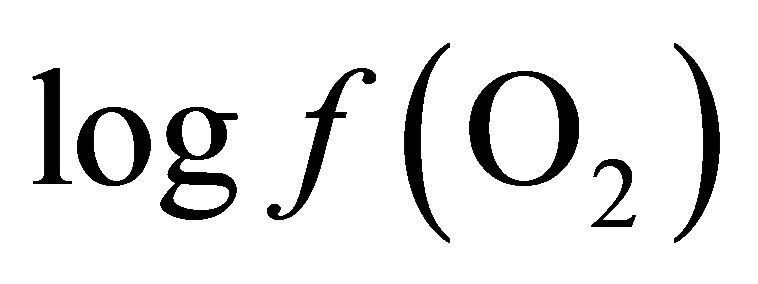 values were situated between –64 one hour before feeding and –66 during and until 2 h post-feeding for CD. This trend may be attributed to a variable fermentative activity of the rumen preand post-feeding. When LY was added to CD, a marked difference of 1.5 log units was measured 1 h before and 1 h after feeding between the diets and a significant decrease of the oxygen fugacity of 0.8 log unit over the measurement period was observed (Table 1). These results showed that supplementing the diet with LY led to a significant reduction (P = 0.04) in the partial pressure of oxygen in the rumen and conferred a better anaerobic ruminal environment. This may explain the enhanced fermentative activity of the ruminal anaerobic bacteria resulting in an increase of VFA concentration in the ruminal milieu.
This ability of LY to consume oxygen in ruminants was previously reported by Newbold et al. [19] and this fact

Figure 3. Dynamics of ruminal oxygen fugacity  1 hour before feeding (F) and during eight post-feeding hours. Vertical bars show SE.
was used by the authors to explain the improved anaerobic conditions prevailing in the rumen that were more favorable to cellulolytic bacteria.
Judging from the above analyses of propionate and lactate concentrations and their relationship to ruminal pH, it seems appropriate to introduce this redox couple in the Nernst equation in order to determine the corresponding level of oxygen fugacity in lactate-propionate transformation. In the rumen, the lactate transformation to propionate is dependent upon the activity of lactic acid-utilizing bacteria. It involves two molecules of NAD+ coenzyme that participate in a conjugated redox couple for exchanges of hydrogen ions and electrons. The reaction illustrating the stoichiometry of lactate conversion to propionate via acrylate pathway can be written as:
 (7)
(7)
Using Equation (2):

Since  and
and  [48]:
[48]:
 (8)
(8)
From Equation (8), at equilibrium the 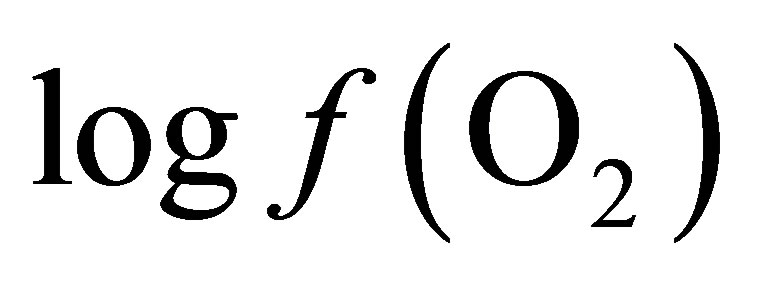 is –50.16. According the law of mass action, decreasing the
 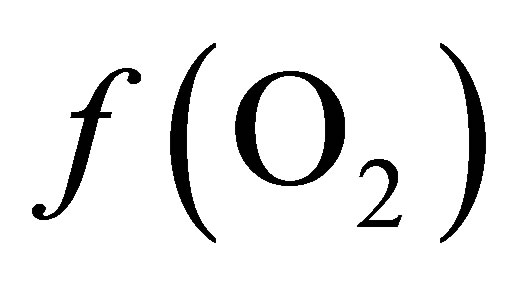 in the ruminal milieu (higher reducing power) shifts the equilibrium to the right (Equation (7)) favoring the formation of propionate from lactate. On the other hand, increasing the
 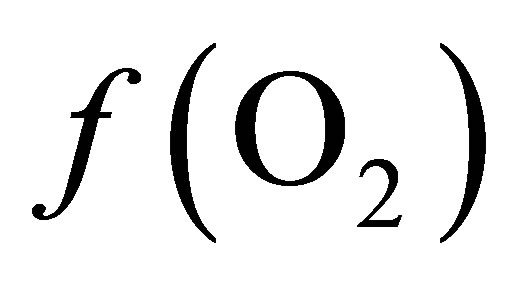 in the rumen (lower reducing power) shifts the equilibrium to the left limiting the formation of propionate thereby favoring the accumulation of lactate.
By integrating the data obtained in this study for propionate and lactate concentrations (Tables 2 and 3) into Equation (8), the 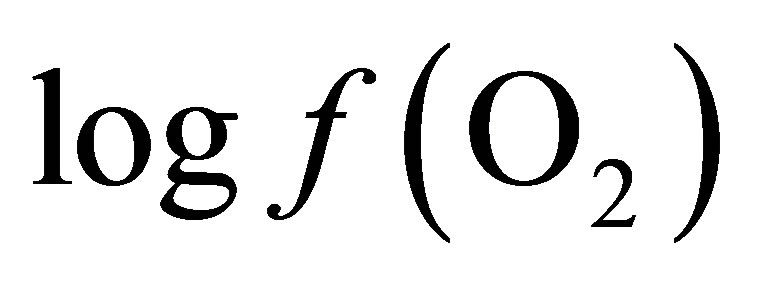 is equal to –53.95 and –54.84 for CD and LYD respectively. The difference (0.9 log unit) between these values is similar to the difference observed between
 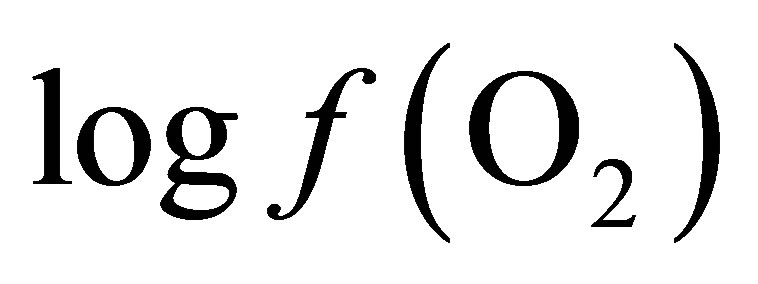 values calculated from Equation (6) for CD and LYD. In this work, it was shown that LY enhanced the reducing power of the ruminal environment and consequently it appears that the live yeast is responsible for the stabilization of pH due to a decrease in ruminal lactate concentration by 55%. Therefore, it can be deduced that the level of oxygen fugacity in the rumen determines the feasibility of redox reactions occurring during ruminal fermentation, namely the transformation of lactate to propionate.
The values of 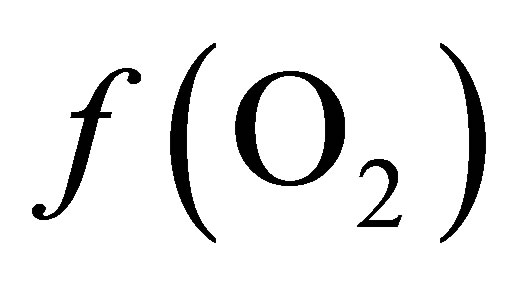 from the O2-H2O couple (Table 1) differed by approximately 10 log units when compared to values from lactate-propionate couple (Equation (8)). This can be accounted by the fact that only the reaction involving lactate and propionate via the acrylate pathway was considered, neglecting ATP production. In addition, the energetic cost of transport from the ruminal liquid through the bacterial cell wall to the cell content in which particular reaction occurs was not taken into account.
4. Conclusion
Supplementing diets inducing SARA in dry dairy cow with live yeast leads to stabilization of ruminal pH that is mainly due to the non-accumulation of lactate in the rumen, although there is an increase in the total VFA concentration. Live yeast seems to act on the reducing power of the ruminal milieu by decreasing the oxygen partial pressure and thereby enhancing the activity of anaerobic bacteria. So, the oxygen fugacity appears to be an appropriate parameter to estimate the feasibility of redox reactions in the rumen and to explain fermentation pathways.
5. Acknowledgements
We gratefully acknowledge Professor Yves Tardy for initiating this work and for his helpful discussions. We also appreciate the financial support of Lesaffre Feed Additives (Marquette-Lez-Lille, France).