Molybdenum Limitation Induces Expression of the Molybdate-Binding Protein Mop in a Freshwater Nitrogen-Fixing Cyanobacterium ()
1. Introduction
Molybdenum (Mo) is an essential trace element for all life, and is particularly important for microbial acquisition of dinitrogen gas (N2) and nitrate ( ) due to its role as a co-factor in the enzymes nitrogenase and assimilatory nitrate reductase [1,2]. While Mo is relatively abundant in the open ocean today (107 nM [3]), it is present at trace quantities (<20 nM) in most freshwaters and soils [1,4]. Low availability of Mo limits N2 fixation in temperate and tropical forest soils [5,6], and has also been shown to limit N2 fixation and
  assimilation in some oligotrophic lakes [1,7,8].
Terrestrial and freshwater microorganisms that rely on Mo for nitrogen acquisition possess a variety of mechanisms to combat Mo limitation. Most bacteria and archaea encode high-affinity Mo uptake systems in order to selectively access Mo at low-nanomolar concentrations [2,9,10]. Some soil bacteria excrete Mo-chelating ligands (“molybdophores”) that solubilize Mo from minerals [11-13] and/or express alternative (though less efficient in terms of total electron flux required to fix one mol of N2) nitrogenases containing vanadium or iron in place of Mo [14]. In addition, two types of microbial Mo storage proteins have been discovered [10,15]. The first, “MoSto” stores up to 90 atoms of Mo per protein molecule as an oxide mineral but is present in only a few strains of heterotrophic soil bacteria and purple non-sulfur bacteria [15,16]. The second Mo storage protein, Mop, is a small (69 amino acid) protein first characterized in the anaerobic N2-fixing bacterium Clostridium pasteurianum [17- 19]. Mop binds only 8 atoms of Mo per protein molecule [20-22], but is much more widespread in bacteria and archaea than MoSto. Therefore, Mop may be an important microbial mechanism for combating Mo limitation in freshwaters and soils.
There is little information about the regulation of Mop in the dominant diazotrophs in freshwater ecosystems: heterocystous cyanobacteria. Heterocystous cyanobacteria fix N2 for extended periods of time after Mo reserves are depleted in growth medium [23,24], likely due to expression of high-affinity molybdate uptake (ModABC) systems and, in certain cases, alternative nitrogenases [25-27]. Previously, we observed extremely high intracellular Mo accumulation in the heterocystous cyanobacterium Nostoc sp. PCC 7120 grown on high Mo (1500 nM), and hypothesized that this accumulation was a consequence of Mo storage by Mop, which may aid in N2 fixation when Mo is limiting in cyanobacteria such as Nostoc sp. PCC 7120 that lack alternative nitrogenases [23].
In this study, we examined the effect of Mo concentration in the growth medium on Mop transcription and translation in Nostoc sp. PCC 7120. We hypothesized that Mop transcription and translation would: 1) be highly correlated, since bacterial mRNA is translated into protein as soon as it is transcribed; 2) be minimal at low media Mo concentrations when Nostoc sp. PCC 7120 was using Mo for enzymatic activity, not storage; and 3) increase with media Mo concentrations, particularly above 1500 nM where we have previously observed intracellular Mo accumulation [23].
2. Materials and Methods
2.1. Culture Conditions and Experiments
Nostoc sp. PCC 7120 was maintained axenically in BG-11 medium (1500 nM) without added  under continuous light (150 mmol photons m−2∙s−1 irradiance) at 25˚C as described in reference [23]. At the start of the experiment, 100-mL samples of stock culture were pelleted at 9400 × g at 4˚C for 20 minutes, washed three times with medium containing 1, 150 or 3000 nM Mo, transferred into hydrochloric acid washed polycarbonate bottles and filled with 300 mL of the same type of medium used for washing. Three treatments (1, 150 and 3000 nM Mo) were each run in triplicate. Water for the culture media was purified to 18.2 MΩ using a MilliQ water purification system (Merck Millipore, USA) and media was microwave sterilized; no further purification was required to reach 1 nM Mo levels in media without Mo added. Cultures were continuously bubbled with room air sterilized by filtration through 0.2-μm Supor® membrane syringe filters (Pall, USA).
Cultures were acclimated to Mo concentrations over an 11-day period. Every day, samples were taken for chlorophyll a measurements. On days 3, 7 and 11, samples were harvested for cellular Mo, RNA and protein. After sampling, the remaining cells were diluted to optical clarity with media of the same Mo concentration used to start the experiment as described in reference [23]. After sampling on day 11, cells remaining in all bottles were diluted to optical clarity with media containing 3000 nM Mo. These treatments were harvested on day 16.
2.2. Media and Cellular Mo Concentrations
Mo in media and cells was measured by inductively coupled plasma mass spectrometry as described in reference [23]. Measurement of uninoculated media confirmed that the starting Mo concentrations were within the range of expected values (~1 nM = 0.6 - 0.9 nM; ~150 nM = 117 - 161 nM; ~3000 nM = 2328 - 3833 nM).
2.3. Growth Rates
Chlorophyll a concentrations were measured as described in reference [23]. The instantaneous growth rate (m, d−1) was calculated at the end of each transfer period using the equation:

where Nt is the chlorophyll a concentration after a given amount of time after transferring (tt, in days) and N0 is the original chlorophyll a concentration at the zero time point (t0, in days).
2.4. RNA Extraction and cDNA Synthesis
At the end of each transfer period, RNA was extracted from an aliquot of cells using the FastRNA Pro Blue kit (Qbiogene, USA) according to the manufacturer’s protocol. RNA pellets were resuspended in 100 μL of nuclease-free water (Ambion, USA). Nucleic acid integrity was checked by visualization of ribosomal bands on an ethidium bromide-stained agarose gel and measurement of the 260/280 absorbance ratio. Nucleic acid concentrations were quantified by absorbance at 260 nm on a Nanodrop (Thermo Fischer, USA). Samples were then treated with RQ1 RNase-free DNase (Promega, USA), purified via chloroform extraction, precipitated with ethanol, resuspended in nuclease-free water and reexamined for degradation as described above. A portion of the RNA was used in cDNA synthesis. The remainder was stored at −20˚C and used later as the non-reverse-transcribed control for quantitative PCR (qPCR).
Commercially manufactured primers (Integrated DNA Technologies, USA) were tested on Nostoc sp. PCC 7120 genomic DNA for specificity and efficiency before use with cDNA. The mop primer sequences were: 5’-AT GGAAGTTAGCGCACGTAATTTTC-3’ (forward) and 5’-ATCAACAGCAACTATCACATCTGAGGA-3’ (reverse). RNA was converted to single-strand cDNA using Superscript III reverse transcriptase (Invitrogen, USA) and 2 pmol of mop forward and reverse primers at 55˚C for 60 min. The 20 μL reaction was diluted 1:5 with sterile H2O and stored at −20˚C for later analysis by qPCR.
2.5. Quantitative PCR
qPCR of cDNA was performed in 25-μL reactions using 2× Brilliant® SYBR Green Master Mix (Stratagene, USA) and the same mop primers as above. qPCR was also performed on non-reverse-transcribed RNA to check for carryover of genomic DNA. To quantify mop expression, calibration curves were prepared over a concentration range of 10−6 to 1 ng with a plasmid (pBAD-TOPO; Invitrogen, USA) containing the Nostoc sp. PCC 7120 mop gene. Fluorescence of the accumulated product was measured at each extension step on a Mx3005P thermal cycler (Stratagene, USA), using the following PCR parameters: initial denaturation at 95˚C for 10 min; 40 cycles consisting of 95˚C for 30 s; 53˚C for 1 min; and 72˚C for 1 min. A melting curve was generated over the temperature range 55˚C - 95˚C following each qPCR run. The melting curves consistently displayed only one peak, suggesting that only the segment of the gene of interest was amplified during the qPCR reaction. Ct values were determined on plots of fluorescence vs. cycle number. Data analysis was performed with MxPro software (Stratagene, USA). Student’s T-tests were used to evaluate whether treatments were significantly different. P values below 0.05 were considered significant.
2.6. Antibody Production and Immunoblotting
Polyclonal IgY antibodies against the entire recombinant Mop protein from Nostoc sp. PCC 7120 were raised in chicken and purified by GenWay Biotech Inc. (USA). The Nostoc sp. PCC 7120 mop gene was cloned into two E. coli expression vectors, allowing overexpression and purification of Mop protein fused with two different affinity tags. The fusion protein from the first construct was used as the antigen for immunization, and the fusion protein from the second construct was used for preparation of an affinity column. Once immunization was completed, polyclonal IgY antibodies were purified on the affinity column. Immunoblotting was performed as described in reference [23] with 16% Tricine gels (NuSep iGels) and conjugation of Mop antibodies to IgY HRP (Genway, USA), followed by chemiluminescent detection.
3. Results
Growth rates of Nostoc sp. PCC 7120 in the 1 nM Mo treatments declined from ~0.5 to 0 d−1 during the acclimation period (days 0 - 11), while growth rates of the 150 and 3000 nM treatments remained between 0.5 - 0.8 d−1 (Figure 1(a)). No significant difference in growth rate was observed between the 150 and 3000 nM Mo treatments, suggesting that 3000 nM Mo had no detrimental effect. Cells in the 1 nM Mo treatment remained viable after 11 days of acclimation; upon transfer into 3000 nM Mo medium, a rapid increase in growth rates was observed (Figure 1(a)). After acclimation, cellular Mo content was highest in the 3000 nM Mo treatments (70 ± 30 mg∙g−1 dry biomass), intermediate in the 150 nM treatments (10.0 ± 0.04 mg∙g−1 dry biomass) and lowest in the 1 nM treatments (2 ± 1 mg∙g−1 dry biomass; Figure 1(b)). Cellular Mo content converged on values of 20 - 40 mg∙g−1 dry biomass after the addition of 3000 nM to all bottles on day 11. One bottle acclimated to 1 nM Mo showed extremely high Mo accumulation; after exposure to 3000 nM, the Mo content of the cells in this bottle was 215 mg Mo∙g−1 biomass, more than 2-fold higher than any of the other samples (40 - 49 mg Mo∙g−1 biomass; Figure 1(b)).
Expression of mop was not statistically different in any of three Mo treatments on day 3 (Figure 1(c)). However, by day 7, mop gene expression was significantly elevated (P < 0.001) in the 1 nM treatment compared to the two higher Mo treatments, and it stayed significantly elevated through day 11 (P < 0.001). After 5 days of exposure to 3000 nM Mo, mop expression dropped back to original levels. Expression of mop did not differ significantly between the 150 and 3000 nM Mo treatments, nor was there significant variation of gene expression for these two treatments throughout the experiment (Figure 1(c)).
Immunoblots showed that Mop was present only in 1 nM Mo treatments on days 7 and 11 (Figure 2). Treatments at 150 and 3000 nM Mo did not show detectable Mop expression, and Mop disappeared after treatments acclimated to 1 nM Mo were transferred into 3000 nM Mo medium (day 16). Mop was not observed as a 7 kDa protein band in any of the experimental samples despite the use of denaturing conditions (sodium dodecyl sulfate addition, β-mercaptoethanol and boiling) during protein extraction and gel electrophoresis. The specificity of the Mop antibody was verified by checking that it was not binding to the transcriptional regulator ModE, the only other protein in Nostoc sp. PCC 7120 with significant sequence similarity to Mop nor any 10 - 20 kDa proteins in cyanobacterial strains lacking mop genes. Immunoblot banding patterns of protein extracts of a -modE Anabaena variabilis ATCC 29413 mutant were similar to those of Nostoc sp. PCC 7120, and no bands were present in protein extracts of cyanobacterial strains lacking the mop gene (Synechocystis sp. PCC 6803 and Thermosynechococccus elongatus; data not shown).
In sum, our results were as expected for Hypothesis 1
 (a)
(a)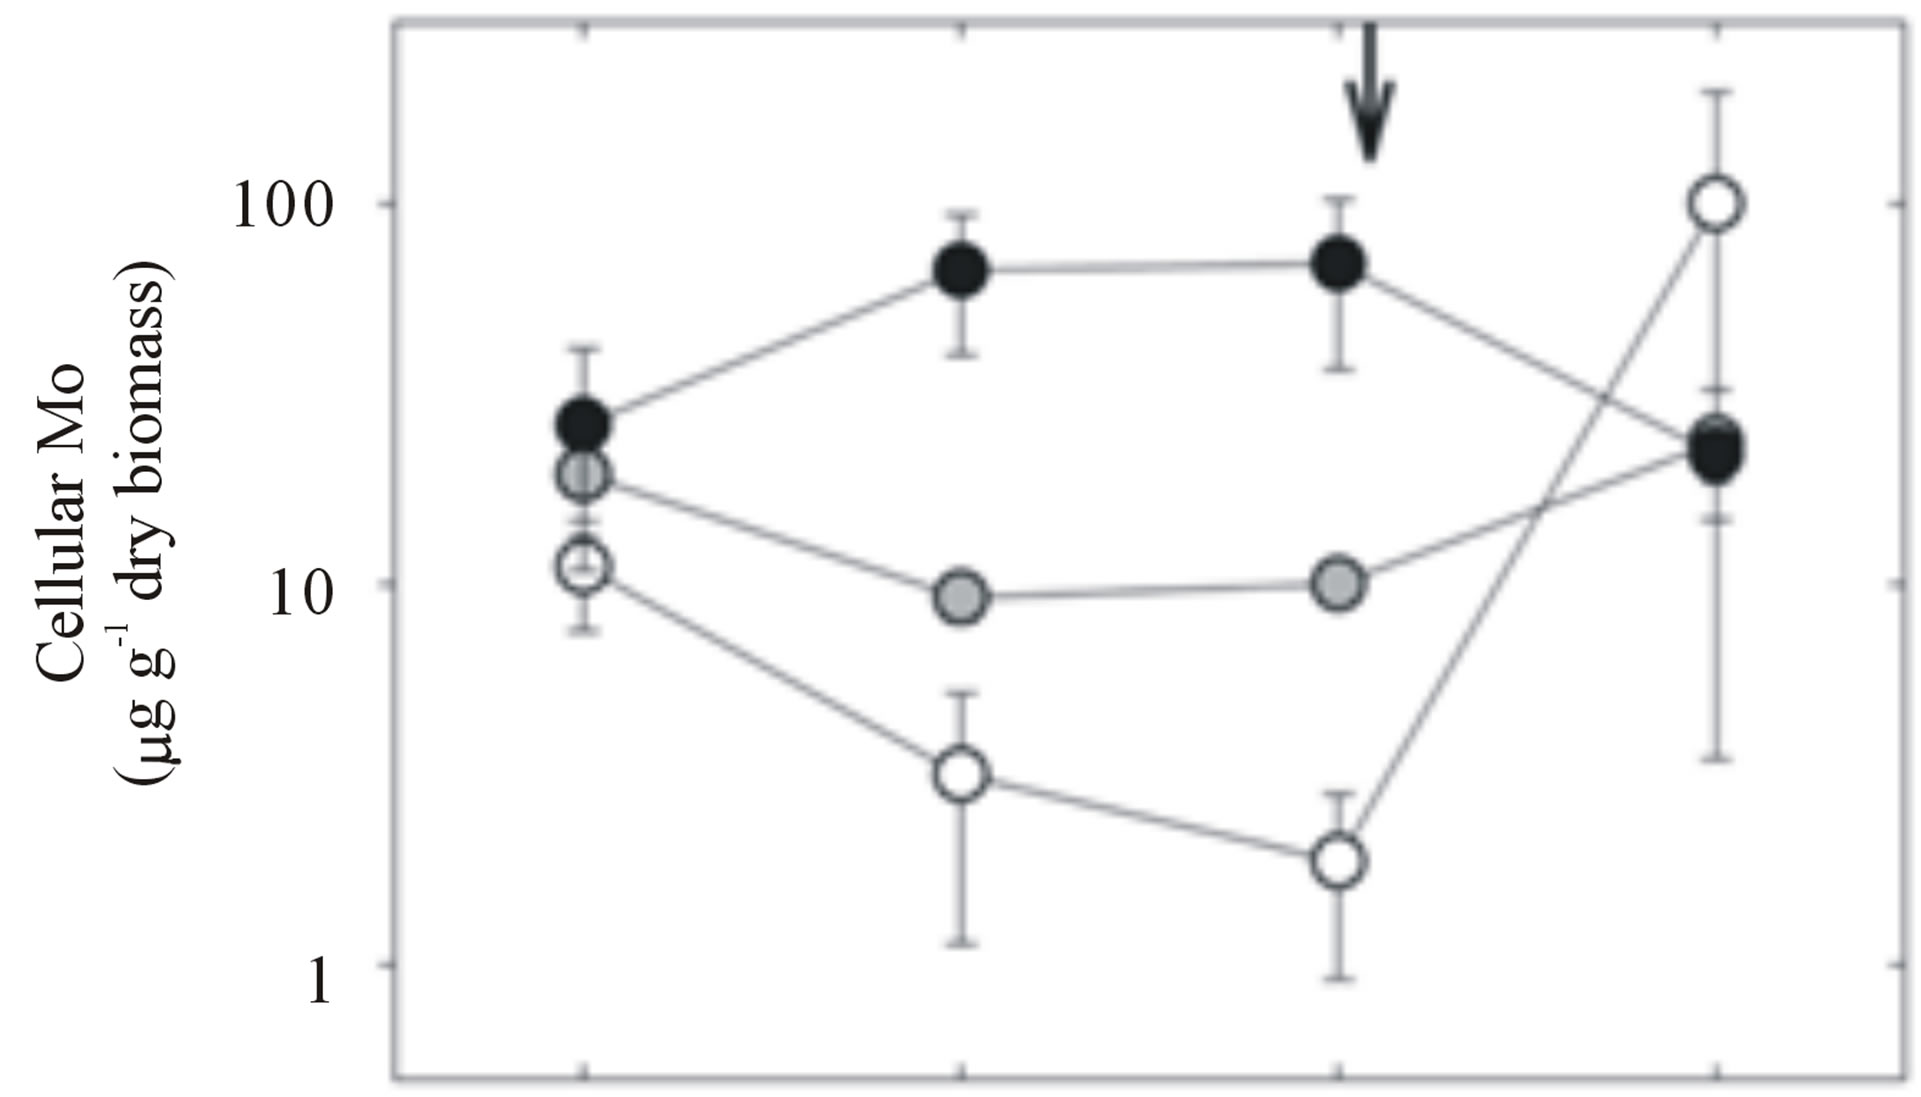 (b)
(b) (c)
(c)
Figure 1. Nostoc sp. PCC 7120 growth rate (a), cellular Mo (b), and (c) mop gene expression over the course of the experiment. Averages and standard deviations (error bars) are shown for three replicates for each treatment. Growth rates were calculated from chlorophyll a measurements taken daily. Cellular Mo is expressed on a log scale. Vertical arrows indicate the addition of 3000 nM Mo to all treatment bottles on day 11.
(Mop transcription and translation were correlated), but were the opposite as expected for Hypotheses 2 and 3: Mop transcription and translation were up-regulated after multiple transfers at 1 nM Mo compared to higher concentrations, and decreased after transfer into high Mo (3000 nM) medium.

Figure 2. Immunoblot showing the in vivo expression of Mop at three Mo concentrations (1, 150 and 3000 nM) in Nostoc sp. PCC 7120. All lanes were loaded with 10 mg protein. Triplicate samples were loaded for each treatment. The horizontal arrow indicates the addition of 3000 nM Mo to all treatment bottles on day 11. Bottom: gel image showing the size of the recombinant Mop protein standard.
4. Discussion
In a previous study [23], we showed that at cellular Mo concentrations <2 g Mo∙g−1 dry biomass, freshwater and coastal heterocystous cyanobacteria did not measurably fix N2. Therefore, in this study, we attribute the drop in growth rate observed during the acclimation period in 1 nM Mo treatments to limitation of N2 fixation by scarcity of cellular Mo. This interpretation is supported by the observation that growth rates and cellular Mo content both returned to maximal levels after 3000 nM Mo media and were added back to low-Mo cultures on day 11 (Figures 1(a) and (b)). Cells likely satisfied their requirements for Mo under severe limitation via the high-affinity  transport system ModABC (Km ~0.3 nM Mo [26-28]).
Transcription of mop was >2-fold higher when Mo was low in the growth medium (1 nM) compared to higher Mo concentrations (150 and 3000 nM), which is consistent with prior studies showing that low Mo concentration does not suppress mop transcription in C. pasteurianum and Eubacterium acidaminophilum [29,30]. In C. pasteurianum, this finding was attributed to production of Mop in apoprotein form (lacking Mo) when Mo was low in the growth medium; Mo bound to the protein when Mo concentrations rose above 1000 nM Mo [29]. However, there are no data available to compare transcription at low vs. high Mo concentrations in C. pasteurianum and E. acidaminophilum. Such a study has been performed for the purple non-sulfur anoxygenic photosynthetic alphaproteobacterium Rhodobacter capsulatus. In contrast to Nostoc sp. PCC 7120, mop transcription in R. capsulatus was over ten-fold higher when Mo concentrations were 10 μM vs. when no Mo was added [31].
Immunoblots conclusively showed that Mop protein was below our level of detection in the 150 and 3000 nM Mo treatments, and that Mop was present only after acclimation to 1 nM Mo medium. The same samples that showed elevated Mop protein expression had reduced growth rate, low intracellular Mo (<5 mg∙g−1 biomass) and up-regulated mop transcription. Mop protein expression disappeared after treatments acclimated to 1 nM Mo media were exposed to 3000 nM Mo for 5 days. Although the other treatments showed measureable mop gene expression, they had minimal Mop protein expression, likely because the detection limit of mRNA in qPCR was lower than that of Mop protein on immunoblots. For both the recombinant purified Mop protein and our experimental samples, Mop was present as a single band of 10 - 15 kDa, although the predicted size from the amino acid sequence was 7 kDa, suggesting that the protein occurred as a dimer even under denaturing conditions.
The role of Mop at low levels of intracellular Mo is currently unknown. However, since Mop is only expressed when media Mo concentrations are low and Mo is transported by the high-affinity  transport system ModABC [26,27], Mop likely functions in a different role in Nostoc sp. PCC 7120, and possibly other heterocystous cyanobacteria, than the Mo storage mechanism attributed to it in previously-studied organisms (i.e. C. pasteurianum and R. capsulatus). One explanation could be that Mop functions as a Mo-carrier protein between the high-affinity Mo uptake system ModABC and Mo-containing proteins such as nitrogenase. In Klebsiella pneumoniae and Azotobacter vinelandii, the protein nifQ donates Mo to the nitrogenase enzyme during its assembly [32-34]. Nostoc sp. PCC 7120 and other freshwater heterocystous cyanobacteria lack nifQ genes [35], but contain the mop gene in close proximity to the nif operon. It is plausible that Mop performs the function of nifQ in heterocystous cyanobacteria, but this remains to be tested. Nonetheless, the low Mo concentrations at which Mop is expressed (~1 nM) are environmentally relevant in lakes worldwide (0.03 - 13 nM Mo [23]), so we predict that Mop is involved in low-Mo metabolism in freshwater cyanobacteria and possibly other microbes as well.
5. Acknowledgements
We thank Roland Hatzenpichler, John Raven James Elser, Petra Fromme, Hilairy Hartnett, Anne Jones, Everett Shock, William Hunter, Luis Rubio and Teresa Thiel for helpful discussions and comments on manuscript drafts, Teresa Thiel and Brenda Pratte provided modE Anabaena variabilis ATCC 29413 mutants. Eric Hughes and Zureyma Martinez aided with laboratory work. This work was supported by NASA Astrobiology Institute funding to A.D.A. and a National Science Foundation Graduate Student Research Fellowship (GeosciencesGeochemistry #2006038382) to J.B.G.
NOTES