Determination of Thermal Conductivity and Porosity of Building Stone from Ultrasonic Velocity Measurements ()
1. Introduction
Ultrasonic techniques are increasingly being used in various fields such as mining, geotechnical, civil and underground engineering. As they are non-destructive and easy to apply, they are employed both in situ and in the laboratory to characterize the dynamic properties of rocks [1,2]. There are a number of factors that influence the seismic properties of rocks, particularly rock type, density, grain size and shape, porosity, anisotropy, pore of water, clay content, confining pressure and temperature. In addition, weathering/alteration zones, bedding planes and joint properties (roughness, filling material, water, dip and strike etc.) have an important influence on the seismic velocity [3].
The measurement of P-wave velocity can be carried out in both field and laboratory environments. The Pwave technique is non-destructive and easy to apply. Therefore, it is increasingly being used in geotechnical engineering, mining and petroleum engineering. The Pwave velocity of a rock is closely related to the intact rock properties, and measuring the velocity in rock media interrogates the rock structure and texture.
Most researchers [4-7] have studied the relations between rock properties and P-wave velocity and found that the P-wave velocity is closely related to rock properties.
Many studies have shown that the thermal conductivity of a porous rock depends mainly on the mineralogical composition, porosity of the rock, presence of fluids filling the pores, and ambient temperature and pressure [8]. Porosity and thermal conductivity play an important role in the transport properties of fluid-rock interactions and the characterization of building materials. The optical scanning method is a technique used for measuring thermo-physical properties. Some theoretical and experimental studies have been conducted on this method [9,10]. It is characterized by non-destructive measurement of thermal properties (conductivity, diffusivity) of a large number of minerals and rocks.
Physical properties, such as porosity and thermal conductivity, are important parameters for the quality of building stones. Therefore, if good correlations are established between P-wave velocity and the physical properties of rocks, this would be helpful for those working in stone processing plants. In this study, the possibility of estimating the physical properties of rocks from P-wave velocity obtained from laboratory measurements is investigated.
2. Materials and Methods
All rock types tested in the present study are collected from different locations in Morocco. Table 1 illustrates the list of rock types with their classes and the locations where the samples are collected.
The rock samples are collected from various locations in Morocco. These rock samples are cored in size 5.5 × 5.5 × 11 cm3 to determine their physical properties [11]. Core specimens are cored by a coring machine and the ends trimmed as required. The specimens are dried at 105˚C for 24 h to remove the moisture.
Measurements of thermal conductivity, porosity and Pwave velocity are performed on 13 samples. These measures will help better understand and identify the characteristics of the porous network of materials used in the construction.
2.1. Porosity
In a rock, the mineral matter forms a solid skeleton which does not occupy all the space. The rest of the rock, which constitutes the empty space, forms the porous network (whether connected or not). The empty form, size, and distribution, connectivity or otherwise isolate some influence on the mechanical behavior of the material. The density and porosity provide information on the voids existing in the material.
Many techniques are used to estimate the porosity [12,13], and highlight some geometric properties of the porous network. The technique used for this work is the total saturation with water.
The evaluation of the porosity of a material cannot be done directly. Indeed, the estimation of void volume in the connected content material requires the injection of a fluid whose properties are known. The total saturation by

Table 1. List of rock types with class and location.
a wetting fluid (usually water) is the easiest method to access the value of porosity. According to a suitable protocol, after degassing, the sample is fully saturated with water, and after different weighed, a value of the total porosity is calculated.
The method of measuring the water total porosity is that defined by the standard RILEM [14], which provides that the samples are soaked in the absence of air, i.e. in monophasic regime.
Initially, the samples are dried in an oven at 105˚C to constant mass. Then they are weighed once dry (Ws), then are placed in a vacuum chamber, where they are subjected to a primary vacuum of 2 × 10⁻² mmHg (2.6 Pa) for 24 hours. Meanwhile, in another crystallizer, water is distilled and degassed under high vacuum.
After 24 hours of degassing, the samples are soaked by vacuum capillary: the water level is readjusted regularly in parallel with the progress of the fringe capillary in the material [15]. When the samples are totally immersed, the vacuum is broken, and they are held for 24 hours. Finally, a weighing of samples saturated (W1) and a hydrostatic weighing (W2 = weight of saturated samples subjected to Archimedes) complete measures the value of porosity, which is given by:
 (1)
(1)
with W1 the weight of the sample saturated with water, W2 weight saturated obtained by hydrostatic weighing, Ws is the dry weight of the sample.
2.2. Thermal Conductivity
Traditional measures of thermal conductivity are in contact with the sample, which can influence the results, due to the presence of thermal contact resistance. The technique presented here eliminates the effect of the thermal contact resistance. It is based on the change in surface temperature of the sample after a known and controlled heat input [9]. The experimental design is identical to that used by Rosener [14] (Figure 1). The meter comes in the form of a movable block, consisting of two temperature sensors sensitive to electromagnetic radiation and a heat source, aligned parallel to the axis of movement, so it is possible to measure the temperature of the sample before and after heating. The block moves at constant speed (V = 4.99 mm/s) near the surface of the sample, along a measurement line, and thus allows to obtain a profile of thermal conductivity.
The two temperature sensors (T 1 and T 2) are employed to measure the temperature difference due to the energy input. The distance between the source and temperature sensor measuring the temperature of the sample

Figure 1. Experimental apparatus for measuring the thermal conductivity.
after heating, and the speed are constant. It is possible to link the increase in temperature at x, θ(x) and conductivity heat by a relation of the form:
 (2)
(2)
with, q the source strength, x the distance between the source and the thermal sensor and λ the thermal conductivity at the measurement point [9]. To obtain an absolute value of the thermal conductivity of the material analyzed, it is sufficient to align the sample and a standard of known thermal conductivity λstd (in this case λstd = 1.35 W/m·K). The thermal conductivity of the material will be determined from λstd and report temperature differences:
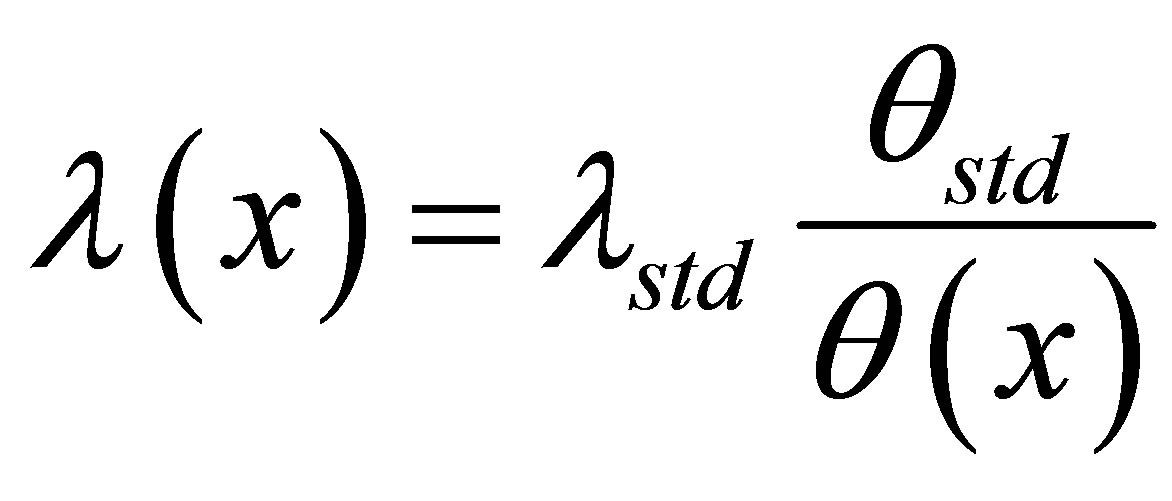 (3)
(3)
Sample preparation is simple. To avoid a change of heat absorption due to color variations in the sample surface, a layer of black paint is applied. In this way, the coefficient of heat absorption is maximum and homogeneous. The range of measurable conductivity is between 0.2 and 70 W/m·K, and the measurement error is less than 3%. To make a measurement, simply position the sample and two standards on the unit of measurement (thermal conductivity and temperature) which is, itself, fully controlled by a computer.
2.3. P-Wave Velocity
Ultrasonic velocity method is a non-destructive testing method based on measuring the velocity of compression waves (P-waves). The velocity of these waves traveling in a solid material depends on the density and elastic properties of the material.
The quality of some materials is related to elastic stiffness; therefore, the measurement of ultrasonic velocity in such materials can often be used to indicate their quality as well as to determine their elastic properties [16]. The ultrasonic velocity test method employs the principle of measuring the travel velocity of ultrasonic pulses through a material medium.
The pulse velocity equipment consists of an emitter (generating transducer) from which ultrasonic pulses are transmitted, a receiver (or receiving transducer) where the pulses are received, and a device for indicating the time of travel from the transmitter to the receiver. Piezoelectric types of transducers may be used, the latter being more suitable for the lower part of the frequency range. The ultrasonic pulse is created by applying a rapid change of potential from a transmitter-driver to a piezoelectric transformational element that causes it to vibrate at its fundamental frequency. The transducer is placed in contact with the material so that the vibrations are transferred to the material. The vibrations travel through the material and are picked up by the receiver. The wave velocity is calculated by using the time taken by the pulse to travel the measured distance between the transmitter and the receiver. The transducers are held tight onto the surfaces of the specimens, and the display indicates the time of travel of the ultrasonic wave. As soon as the measured value is stable for 3 seconds, a deep sound is heard and the speed of sound appears. The pulse velocity is given by the formula:
 (4)
(4)
where V is pulse velocity (km/s), L is path length (cm) and t is transit time (μs).
To have a perfect contact between the rocks and the transducers, it is necessary to sand and level the part of the surface where the transducer is fixed, and it is recommended to use a paste made of coupling kaolin and glycerol at both ends of rocks and taking care to ensure that the transducers are pressed against the surface to be tested. The standard 54 kHz transducers are calibrated on the display unit which must be controlled by a calibration test (Figure 2). The calibration factor is marked on the standard toolbar (20.6 μm).
3. Results and Discussions
Porosity controls all other physical parameters of the rock (density, permeability, thermal conductivity...). It corresponds to the ratio of the total pore volume and the total volume of the rock and is expressed as a percentage.
In practice, only the open porosity of a rock is measurable. The space created between the grains and micro cracks is often recorded with the volume of porosity. In this work, we have used the water total porosity.
Table 2 shows the high porosity of sedimentary rocks, including stones of Rabat-Salé, Bouskoura (19.01%) and Taza (14.08%). The stone of Benslimane and travertine of Meknès-Fes are relatively less porous (7.32% &

Figure 2. P-wave velocity apparatus utilized in this study.

Table 2. Physical properties of various rock types.
4.36%). The granite has a very low porosity that does not exceed 0.59%, while the marbles display the lowest porosity, but with a minimum porosity (0.3%) in the marbles (Khénifra, BouAcila).
Thermal conductivity of a rock not only depends on the mineral composition but also on the type and amount of porosity, and on the fluids present in the pores. As it is difficult to determine the conductivity with partially fluid saturated rocks, one prefers to use the two extreme cases; dry and saturated states. To dry the samples, they are stored in an oven for 24 hours at 105˚C. The samples have been saturated under vacuum, just like in the porosity determination experiment presented earlier.
Our experimental results (Table 2) show that for the same type of rock the thermal conductivity varies over a significant range and that water saturation induces a higher conductivity.
Metamorphic and magmatic rocks are made up of quartz, feldspars, and mafic minerals, and the content of minerals from these three groups basically determines a rock’s thermal conductivity since these rocks display a much smaller porosity. Quartz content determines conductivity since low conductivity is associated with low quartz-content in metamorphic rocks.
In sedimentary rocks, the third mineral component is replaced by air and water, as the high variability of porosity in these rocks is a major factor controlling their thermal conductivity.
The P-wave velocity depends on several parameters: mineral composition, porosity, presence of cracks and water content. The measured velocity in a macroscopic sample is a balanced average of the velocity in the minerals (e.g. 6.06 km/s in quartz, 6.65 km/s in calcite) and in the fluid present in the porous network (e.g. 1.5 km/s in water, 0.34 km/s in air), altered by the crossing of solid-solid, fluid-fluid or solid-fluid interfaces. The measurements have been performed on dry and water saturated samples.
The results obtained for the measurement of P-wave velocities of dry samples range from 3.07 to 6 km/s and those of water saturated samples vary between 3.18 and 6.16 km/s. These results are consistent with literature results [7,16]. In general, we observe that the high value of the P-wave velocity is obtained for the samples saturated and the low value is obtained for dry samples. The authors Boulanouar et al. [7], Guéguen et al. [17] and Rahmouni et al. [18] compared the velocities P-wave in dry and saturated with water. They generally observed that VP (dry) < VP (saturated). Beck [19] observed that the P-wave velocity is higher in the saturated state for the Tuffeau (white) and the stone of Sebastopol.
One of the principal factors, which determine the thermal conductivity of rocks, is P-wave velocity. Pwave induces longitudinal oscillatory motions similar to simple harmonic motion. It travels in any direction in a material which resists compression. It is directly proportional to the thermal conductivity of rocks [20,21].
The results obtained (Figures 3 and 4) shows that the thermal conductivity increases with increasing P-wave velocity. Figures 5 and 6 show that P-wave velocity decreases with increase of porosity which was expected because the attenuation and dispersion of the echoes increase with the increase of porosity. Porosity controls thermal properties due to its dependence on grain size [22]. As the grain size increases effective thermal conductivity decreases since more particles are necessary for the same porosity, which means more thermal resistance between the particles.
In order to describe the relationships between P-wave velocity, thermal conductivity and porosity of the tested rock samples, a regression analysis is carried out. The equation of the best fit line and the coefficient of determination (R2) are determined for each test result.
The best fit line and its regression analysis for each
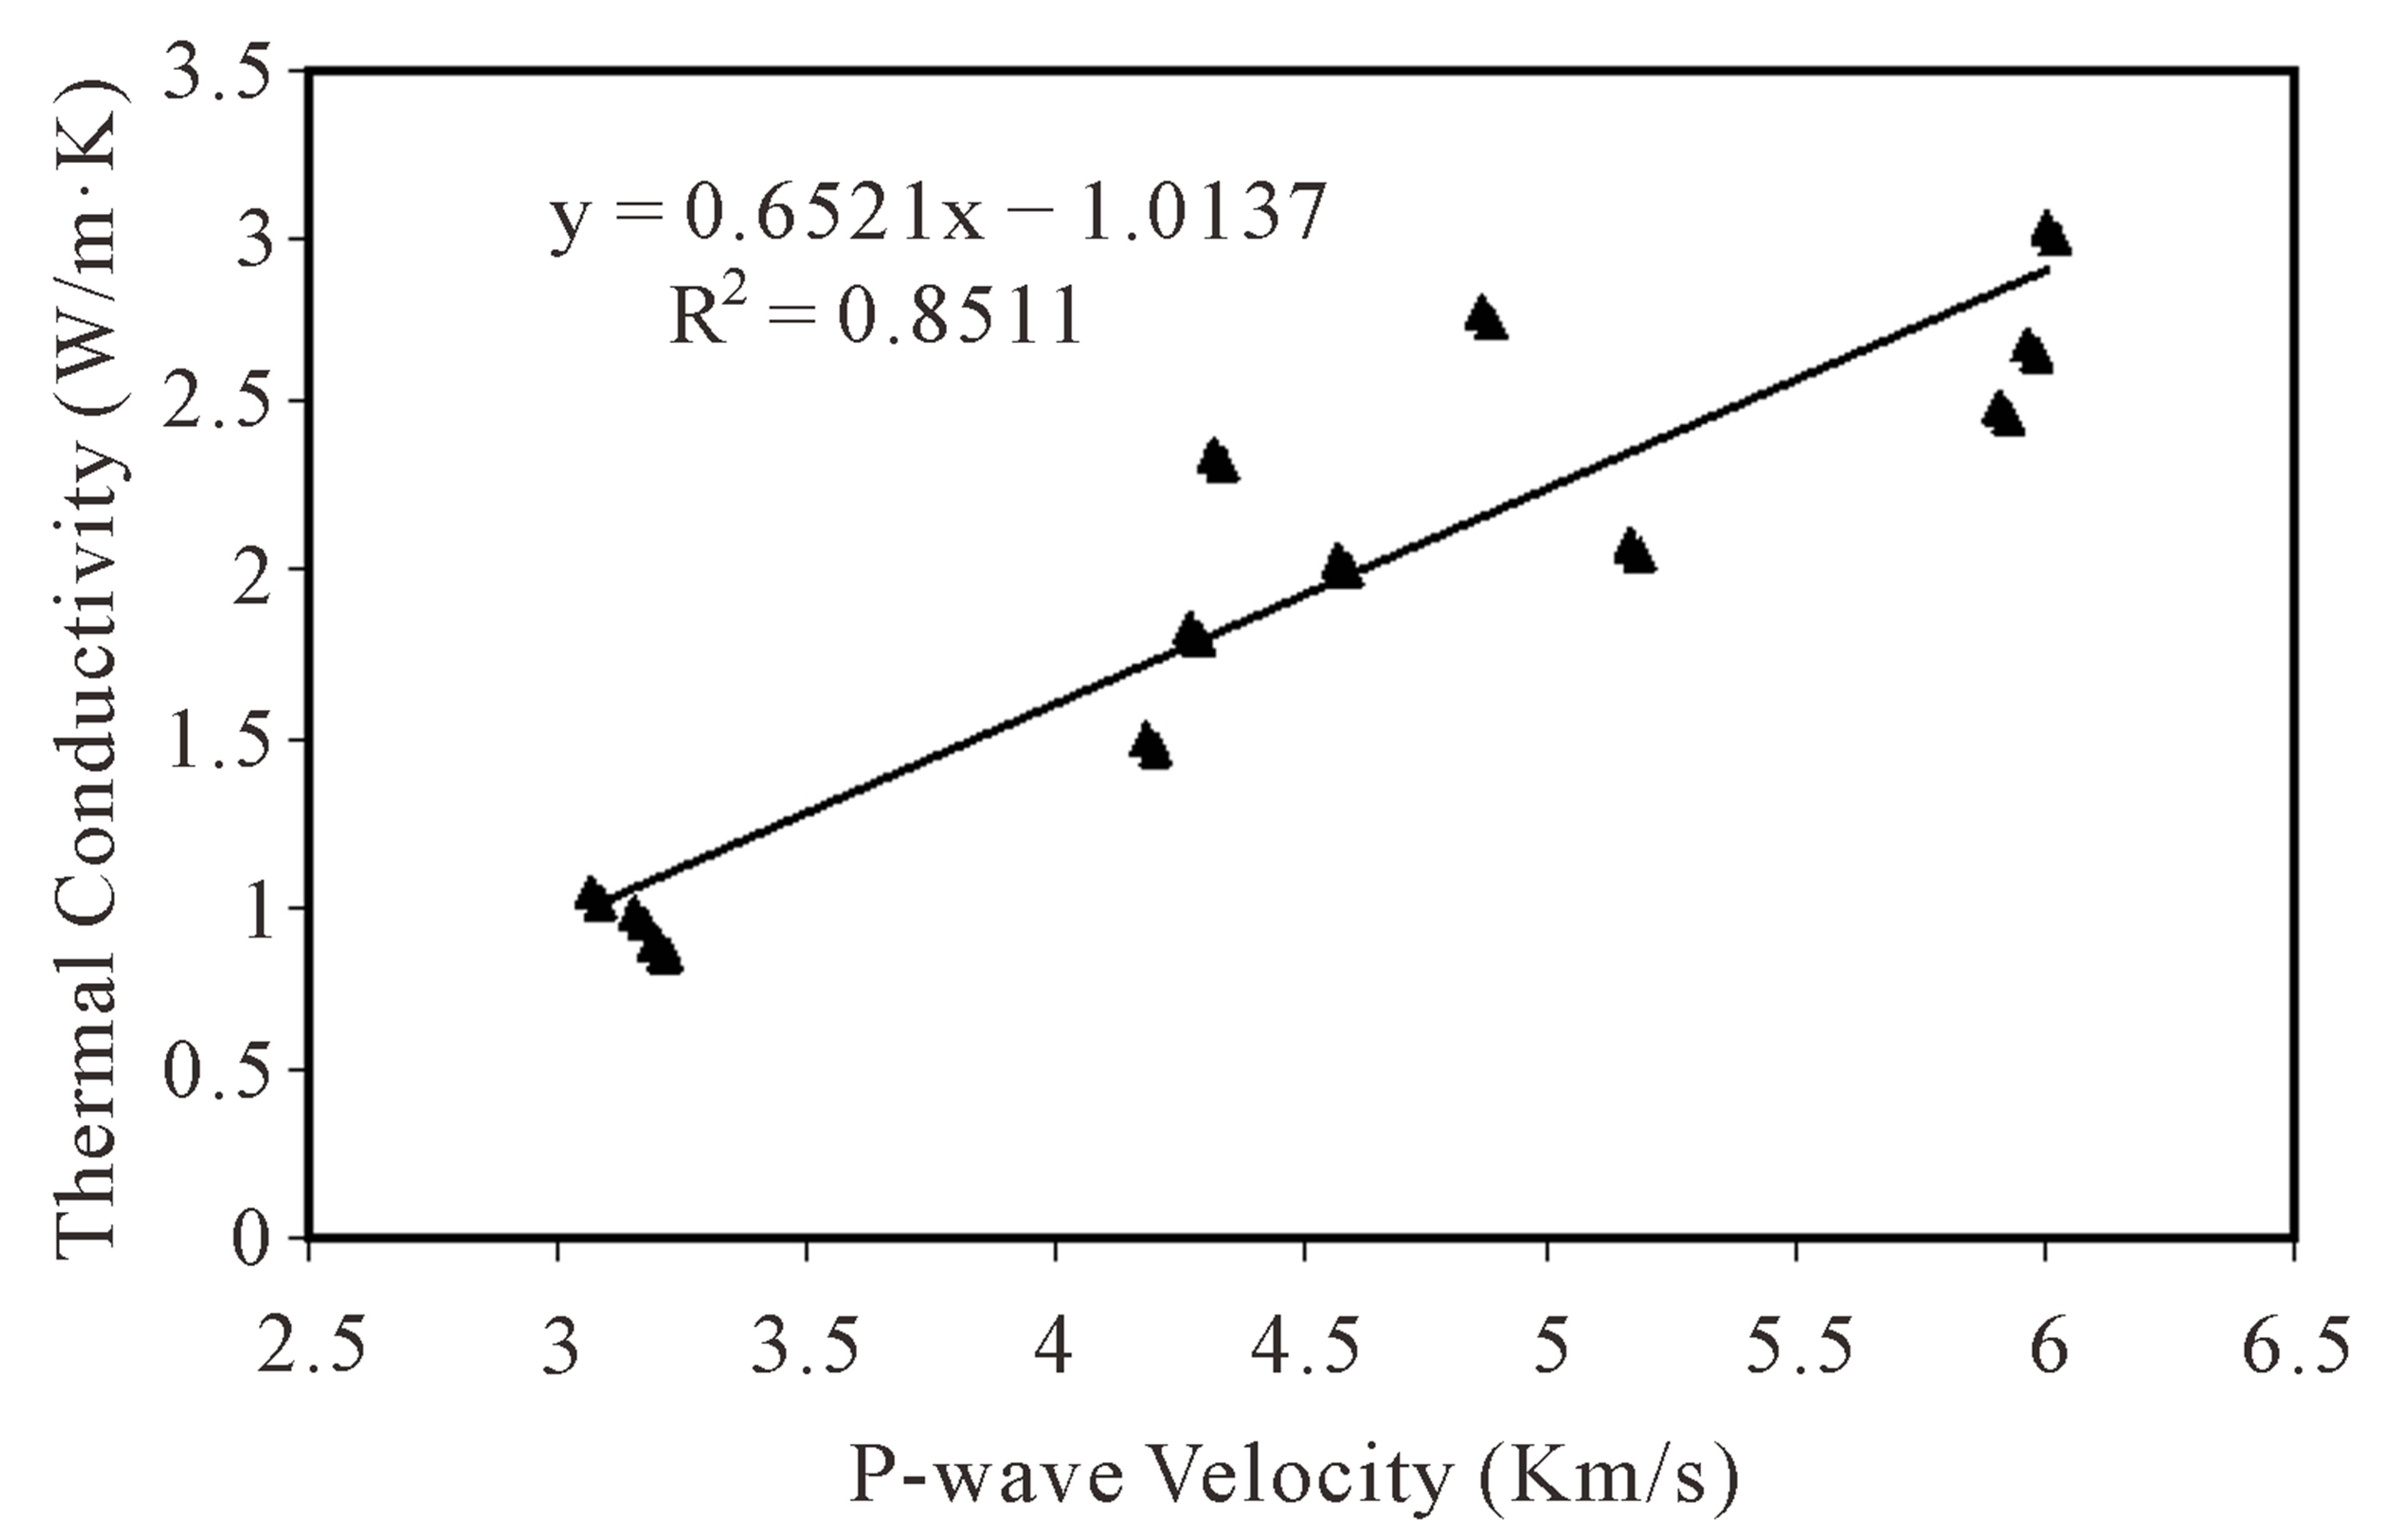
Figure 3. Thermal conductivity versus P-wave velocity for dry rock samples.

Figure 4. Thermal conductivity versus P-wave velocity for saturated rock samples.

Figure 5. P-wave velocity versus porosity for dry rock samples.
data set is illustrated in Figures 3-6. It can be seen from the figures that, in all cases, the best fit relationships are found to be best represented by linear regression curves. However, this is only applicable under the P-wave range 3.7 - 6 km/s (dry state) and 3.18 - 6.16 km/s (saturated state). For the lower and higher P-wave values, these equations may produce misleading results. Extrapolation should therefore not be used to validate the results from empirical equations.
The values of P-wave velocity of rocks are corre-

Figure 6. P-wave velocity versus porosity for saturated rock samples.
lated with the thermal conductivity of the rocks.
The graphs between P-wave velocity and thermal conductivity are shown in Figures 3 and 4.
There is a linear relation between P-wave velocity and thermal conductivity (λ) for all rock types. A strong correlation (R2 = 0.8511 (dry), R2 = 0.8498 (saturated)) is found between P-wave velocity and thermal conductivity for all rock types (Figures 3 and 4). The equations of this relation are given below:

For P-wave velocity and the porosity (N), the curve also shows a linear relationship (Figures 5 and 6). A good correlation (R2 = 0.8598 (dry), R2 = 0.8697 (saturated)) is found between P-wave velocity and porosity for all rocks. The equations of relation are as given below:

To determine the empirical relationships between Pwave velocity, thermal conductivity and porosity of the tested rock types, the t-tests have been performed using the so-called student t-test. The t-test is performed to test the null hypothesis. According to the t-test, when computed t-value is greater than tabulated t-value, the null hypothesis is rejected and the obtained correlation coefficient (R-value) is acceptable. In the present study the t value is computed and compared with the tabulated value. Since, a 95% confidence level is chosen in this test, a corresponding critical t-value 2.97 is obtained. Table 3 shows the calculated and tabulated values of t-test.
In all the above cases for different rocks, calculated value of t-test is much higher than the tabulated value and hence they all have significantly a strong correlation among themselves and this may be used for prediction of the thermal conductivity and porosity using P-wave velocity.
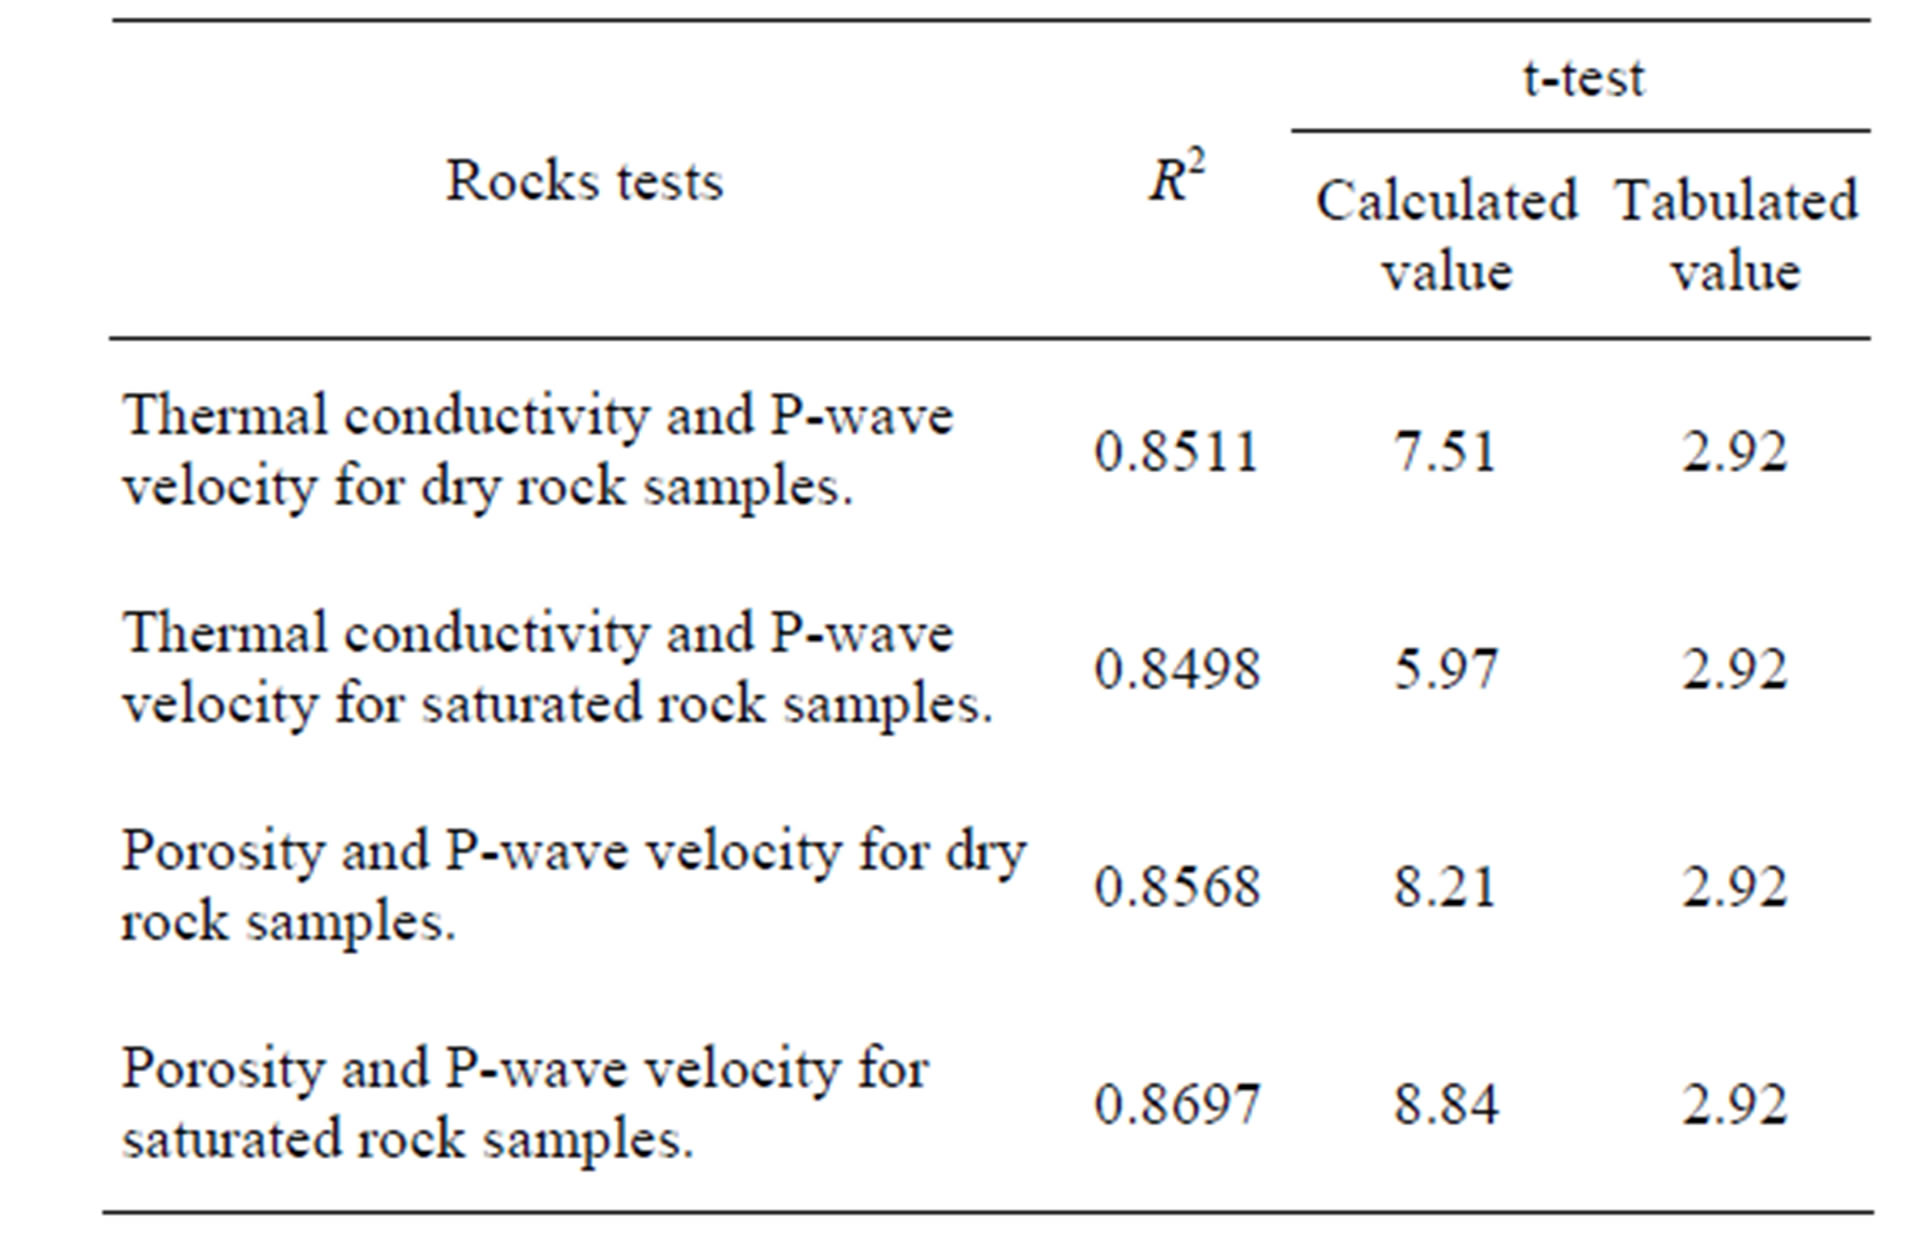
Table 3. Tabulated results of the t-test.
4. Conclusions
In this study, physical properties of 13 rock samples have been measured and analyzed in an integrated manner. Laboratory measurements have been carried out on the following physical parameters: porosity, thermal conductivity and P-wave velocity.
The study indicates that the porosity and thermal conductivity of sedimentary, metamorphic and magmatic rocks types can be estimated from their P-wave velocity values by using mathematical relations.
A strong coefficient of determination is found between the P-wave velocity with porosity and the thermal conductivity of the tested different rocks. This is also verified by student’s t-test, which shows higher calculated values for each relation rather than tabulated values. Hence, they all have significantly a strong correlation among themselves and the proposed correlation equations can be used for determination of porosity and thermal conductivity by P-wave velocity.
The study has shown that porosity and thermal conductivity can be estimated by the use of P-wave velocity with the given empirical equations for different rocks, however, those equations should be used with care for only similar rocks. Such a correlation can provide a good estimation of such properties as porosity and thermal conductivity, which in many cases can avoid time-consuming and tedious test methods.
5. Acknowledgements
This work is performed in collaboration with our partners in the Scientific Institute of Rabat and those of the Institute of Global Physics of Strasbourg, in the Project Integrated Action Franco-Moroccan No. MA/07/168 between University of Strasbourg and Mohammed V University of Rabat. The authors would like to thank Dr. Amin Esmail Khalili, Geology Department, Helwan University, for his valuable comments that improved significantly this work.
NOTES