1. Introduction
Introduction: Enantiomers of racemic drugs often show different behaviors in pharmacological action and metabolic process. It is not uncommon for one enantiomer to be active while other is toxic in biological systems. The pharmaceutical industry has raised its emphasis on the generation of enantiomerically pure compounds before undertaking phamarmacokinetic, metabolic, physiological, and toxicological evaluation in the search for drugs with greater therapeutic benefits and lower toxicity [1,2]. Nowadays, chiral separations are playing a more and more important role for the analysis of single enantiomers in the field of pharmaceutical industry [3]. However, the development of the methods for the quantitative analysis of Chiral compounds and for the assessment of enantiomeric purity is extremely challenging, because the same physical and chemical properties of the two enantiomers make discriminating and separating them very difficult [4].
Ezetimibe, a selective inhibitor of intestinal cholesterol and related phytosterol absorption, is designated as 1-(4-fluorophenyl)-3(R)-[3-(4-fluorophenyl)-3(S)-hydroxypropyl]-4(S)-(4-hydroxyphenyl)-2-azetidinone. Ezetimibe selectively prevents the absorption of cholesterol from dietary and capillary sources by blocking the transport of cholesterol through the intestinal wall. This reduces the overall delivery of cholesterol to the liver, thereby promoting the synthesis of LDL receptors and the subsequent reduction in serum LDL-C [5,6]. Few HPLC methods for the determination of Ezetimibe were reported in literatures [7,8]. The (R)-enantiomer is the undesired enantiomer, which can be present as a chiral impurity without any pharmacological and toxicological reports by now. So it is essential to find an effective way to analyze the enantiomers of Ezetimibe, the chemical structure of Ezetimibe is shown in Figure 1 , the chemical structures of (R)-enantiomer is shown in Figure 2 and (R)-enantiomer Ezetimibe may be at low level for little (R)-Ezetimibe exists in starting material or racemization in synthesis.
Here, the direct enantioseparation of the undesired enantiomer from an active pharmaceutical ingredient, Ezetimibe, is isolated by Supercritical fluid chromatography (SFC) using modified cellulose as chiral stationery phases. The aim of this work was to isolate, and characterize and optimized the chromatographic conditions in terms of mobile phase composition in order to separate and identify the enantiomers of Ezetimibe. The developed SFC method was used for isolation of (R)-enantiomer in Ezetimibe.
Supercritical Fluid Chromatography (SFC) is a form of normal phase chromatography that is used for the analy
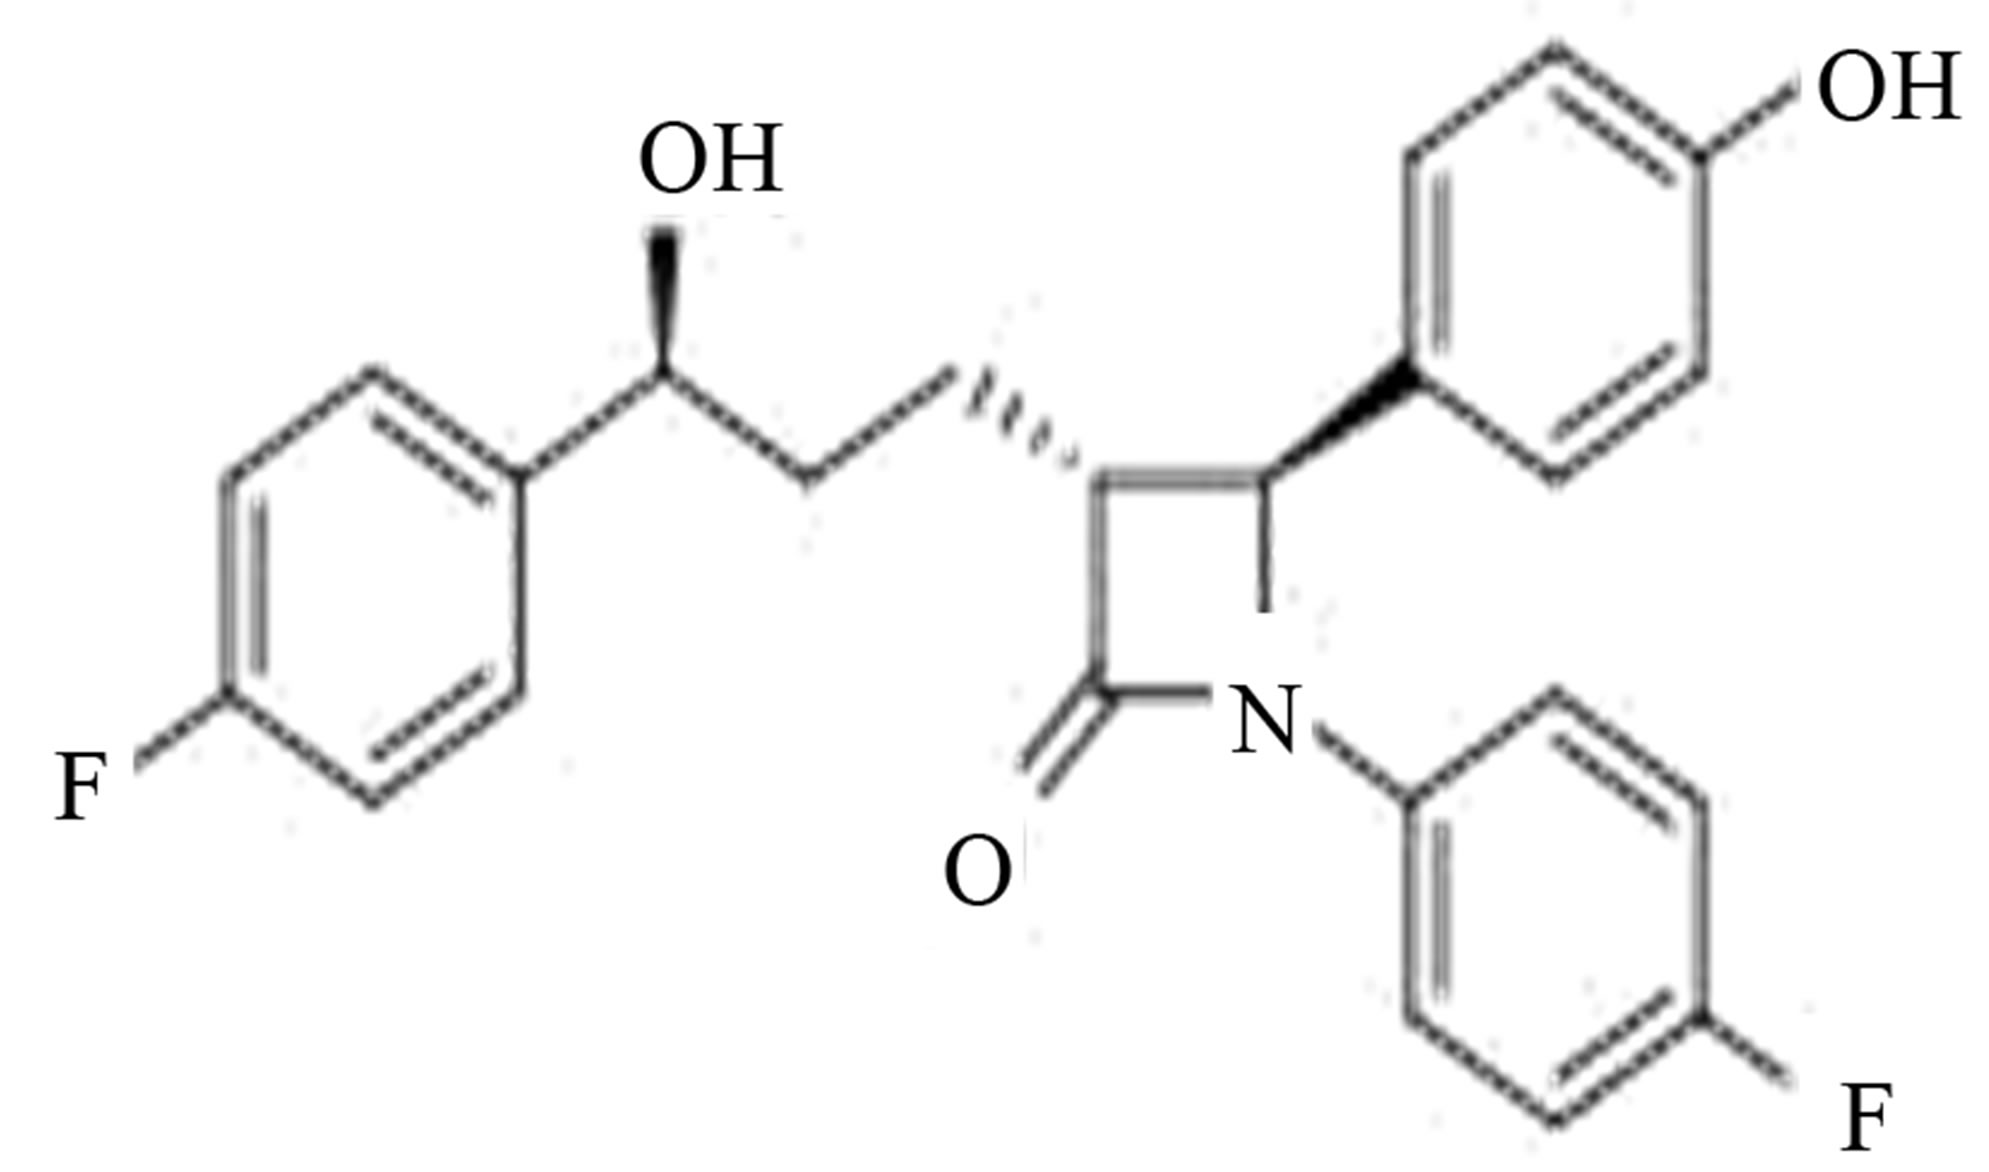
Figure 1. (3R,4S)-1-(4-fluorophenyl)-3-[(3S)-3-(4-fluoroph-enyl)-3- hydroxypropyl]-4-(4-hydroxyphenyl) azetidin-2-one.

Figure 2. (3R,4S)-1-(4-fluorophenyl)-3-((3R)-3-(4-fluorophenyl)-3- hydroxypropyl)-4-(4-hydroxyphenyl)azetidin-2-one.
sis and purification of moderate molecular weight, thermally labile molecules. It can also be used for the separation of chiral compounds. The principles are similar to those of high performance liquid chromatography (HPLC) [9]; however, SFC typically utilizes carbon dioxide as the mobile phase; therefore, the entire chromatographic flow path must be pressurized.
Supercritical Fluid Chromatography (SFC) is found to be useful in industry primarily for the separation of chiral molecules, and the same columns are used as standard HPLC systems. SFC is now commonly used for achiral separations and purifications in the pharmaceutical industry.
The mobile phase is composed of high pressure liquid or supercritical carbon dioxide, however, modifiers are added which can be used to change the chromatography, these are typically alcohols like methanol, ethanol or isopropyl alcohol. Other solvents such as Acetonitrile and chloroform can be used as modifiers. The solvent limitations are systemand column-based.
Here, the direct enantioseparation of the undesired enantiomer from an active pharmaceutical ingredient, Ezetimibe, is isolated by Supercritical fluid chromatography (SFC) using modified cellulose as chiral stationery phases. The aim of this work was to isolate and characterize. Optimized the chromatographic conditions in terms of mobile phase composition in order to separate and identify the enantiomers of Ezetimibe, the developed SFC method was used for isolation of (R)-enantiomer in Ezetimibe.
2. Experimental
Chemicals and reagents Ezetimibe racemic mixture (±) was obtained from the R&D department of Inogent Laboratory (Hyderabad, India). Chemical structure is presented in Figure 1. HPLC grade 2-Propanal was purchased from Merck (Mumbai, India) CO2, with a purity of 99.9% was purchased from MRGenterprises (Hyderabad, India). HPLC grade n-Hexane, 2-Propanal, Trifluoroaceticacid and Ethanol was purchased from Merck (Mumbai, India).
2.1. Isolation by Supercritical Fluid Chromatography (SFC)

 The isolation of R-enantiomer in Ezetimibe by using SFC 200 System in large Scale. The Chromatographic conditions are the total flow was 100 g/min; the % of solvent was 15% isopropanol and the Supercritical fluid is 85%. The Automatic back pressure Regulator maintained at 180, the preparative column was Chiral Cel OD-H (250 × 30 mm), 5 microns. The output signal was monitored by using Gilson detector.
2.2. Sample Preparation
Ezetimibe racemic mixture (±) was prepared with 10 mg/ mL dissolving appropriate amount of the substance in diluent and injected. Collected the R-Isomer fraction and distilled and characterize by using spectroscopy techniques.
2.3. Characterization of R-Isomer
2.3.1. UV-Vis Spectroscopy
UV-Visible spectrum was recorded by diluting sample in methanol in UV-2450 Perkin Elmer spectrophotometer.
2.3.2. FT-IR Spectroscopy
The FT-IR Spectroscopy was recorded in the solid state as KBr dispersion using Thermo Nicolet 380 FT-IR Spectrophotometer.
2.3.3. Mass Spectroscopy
Electrospray ionization mass spectroscopy was performed using a triple quadrupole mass spectrometer. The positive and negative Electrospray MS data was obtained by switching the capillary voltage between +5000 V and −4500 V, respectively.
2.3.4. NMR Spectroscopy
The NMR experiments were performed on Varian 400 MHz. The 1H and 13C chemical shift values were reported on the K scale in ppm.
2.4. High Performance Liquid Chromatography
A validated LC method was used for Identification and quantification of R-Isomer of Ezetimibe. Waters e2695 with 2998 PDA detector with Empower-2 software was used. The chromatographic conditions were Chiral Cel AS-H (250 × 4.6 mm, 5 was used. The chromatographic conditions were Chiral Cel AS-ethanol, 2-Propanol and Trifloroacetic acid (84:12:4:0.1 v/v). Detection was carried out at 230 nm and the flow rate 1.0 mL/min.
3. Results and Discussion
Isolation by Supercritical Fluid Chromatography (SFC) Racemic mixture solution of Ezetimibe and (R)-enantiomer (10e solution of prepared in ethanol was used in the method development. To develop a rugged and suitable SFC method for the separation of the two enantiomers, different stationary phases and mobile phases were employed. Initial screening of chiral column was carried out by several chiral column suppliers. Various chiral columns, namely Chiralpak AD-H (250 × 4.6 mm), chiralcel IA (250 × 4.6 mm), chiralcel AS-H (250 × 4.6 mm) of Daicel were employed. All these columns failed to provide selectivity between Ezetimibe peak and the undesired enantiomer peak using different possible mobile phases. In the following method development activities, Chiralcel OD-H column (250 × 4.6 mm, 5 Mm) with mobile phase consisting of Supercritical Carbon dioxide and methanol was used, but all that was obtained was a defective separation of two enantiomers with a very low resolution.
It was continued to select the best stationary and mobile phases that would give optimum resolution and selectivity for the two enantiomers. There was an indication of separation on Chiralcel OD-H (250 × 4.6 mm, 5 tiomers. There was mobile phase consisting of upper critical carbon dioxide and 2-Propanol. The composition of the mobile phase was optimized to enhance the chromatographic efficiency and resolution between the enantiomers. The results of resolution factor (Rs) and selectivity factor (N) are summarized in Table 1. Based on the data obtained from the method development and optimization activities, Chiralcel OD-H (250X4.6mm, 5µm) column. The phase of Supercritical carbon dioxide and 2-Propanol (85:15%) was selected for the method development. The phase of Supercritical carbon dioxide and 2-Propanol (85:15%) was selected for the method development. The flow rate of the final method was 2.0 mL/min with injection volume 20 devel column temperature was 25˚C, and the detection wavelength was 230 nm. Under these conditions, the two enantiomers were separated well and the peak of (R)-enantiomer eluted before the peak of Ezetimibe. In the optimized method, the typical retention time of Ezetimibe and (R)-enantiomer were 5.31, 6.27 min, respectively. Base line separation of Ezetimibe and (R)-enantiomer was obtained with total run time of 20 min. The separation of an approximately 1:1 (wt/wt) mixture solution (in ethanol) of the two enan-
tiomers is shown in Figure 3. Ezetimibe peak confirmed with by injecting individually is shown as Figure 4.
Cellulose based chiral stationary phase contained five chiral centers per unit, and Ezetimibe has only one chiral centre close to the carbonyl group in the structure. The stereo electronic interaction between the enantiomers and the chiral stationary phase generated enantio selectivity, thus causing significant difference in the migration of the enantiomers inside the column. Having the right amount of 2-Propanol in the mobile phase also played an important role in affecting the steric environment of the chiral cavities or channels of the stationary phase and contributes to enantio selectivity. However, an excessive amount of 2-Propanol was likely to cut down the resolution by taking up chiral centers of the chiral stationary phase or forming hydrogen bonding with enantiomers instead of the hydrogen bonding between the enantiomers and the stationary phase. Other important interaction between the enantiomers and the stationary phase, such as π-π bonding Vander walls forces, dipole induced dipole attractions, and steric effects can also achieve better resolution on chiralcel OD-H column and steric effects can also achieve better resolution on chiralcel OD-H column.
3.1. Characterization of R-Isomer by UV-Visible Spectroscopy
The UV-Visible spectrum was recorded by diluting R-Isomer by using 10 ppm solution in methanol. Solution was scanned 200 - 400 nm against methanol as blank and recorded the UV-visible spectrum for R-Isomer spectrum is shown in Figure 5.
3.1.1. FT-IR Spectroscopy
Dispersed about 2 mg of R-Isomer in 300 - 400 mg of KBr, grind the mixre, spread uniformly on a die and compress in to a thick disk by applying pressure about 800 Mpa. Kept the pellet in KBr folder in FT-IR spectrophotometer and scanned the spectrum from 4000 cm−1 to 450 cm−1.
Noted the wavelengths and it’s the spectrum from 4000 cm−1 to 450 cm−1 and shown at Figure 6. Functional groups are listed in Table 1.

Table 1. Functional groups from FT-IR spectrum.

Figure 5. UV-Visible spectrum for R-Isomer.
3.1.2. Mass Spectroscopy
Analyzed the R-Isomer by using Mass spectroscopy and observed the mass number (m/z) for R-Isomer and it’s confirming the mass number of R-Isomer is 409 (m/z: negative mode: 408), as shown in Figure 7.
3.1.3. NMR Spectroscopy
R-Isomer sample analyzed 1H NMR and 13C NMR using Varian 400 MHz. The no. of protons and no. of carbons confirms the structure of R-Isomer. The reported 1H NMR spectrum was shown Figure 6. The reported 13C NMR spectrum was shown Figure 8. 1H NMR and Figure 9: 13C NMR. 1H NMR and 13C NMR K values are listed Tables 2 and 3.
3.2. High Performance Liquid Chromatography
A validated LC method was used for Identification and quantification of R-Isomer of Ezetimibe. Waters e2695 with 2998 PDA detector with Empower-2 software was used. The chromatographic conditions were Chiral Cel AS-H (250 × 4.6 mm, 5 microns was used. The chromatographic conditions were Chiral Cel AS-ethanol, 2- Propanol and Trifloroacetic acid (84:12:4:0.1 v/v). Detection was carried out at 230 nm and the flow rate 1.0 mL/min.
Both Ezetimibe and Isolated R-Isomer ware prepared in diluent and injected individually and as co-injection. R-Isomer Retention time was confirmed by injected recemic mixture.Recemic mixture shown as Figure 10, Isolated R-Isomer shown as Figure 11 and Ezetimibe shown as Figure 12.
4. Conclusion
The research paper describes the isolation and charac-

Figure 7. Mass spectrum (m/z) for R-Isomer.

Figure 9. 13C NMR spectrum for R-Isomer.

Figure 10. R-Isomer and ezetimibe (1:1).
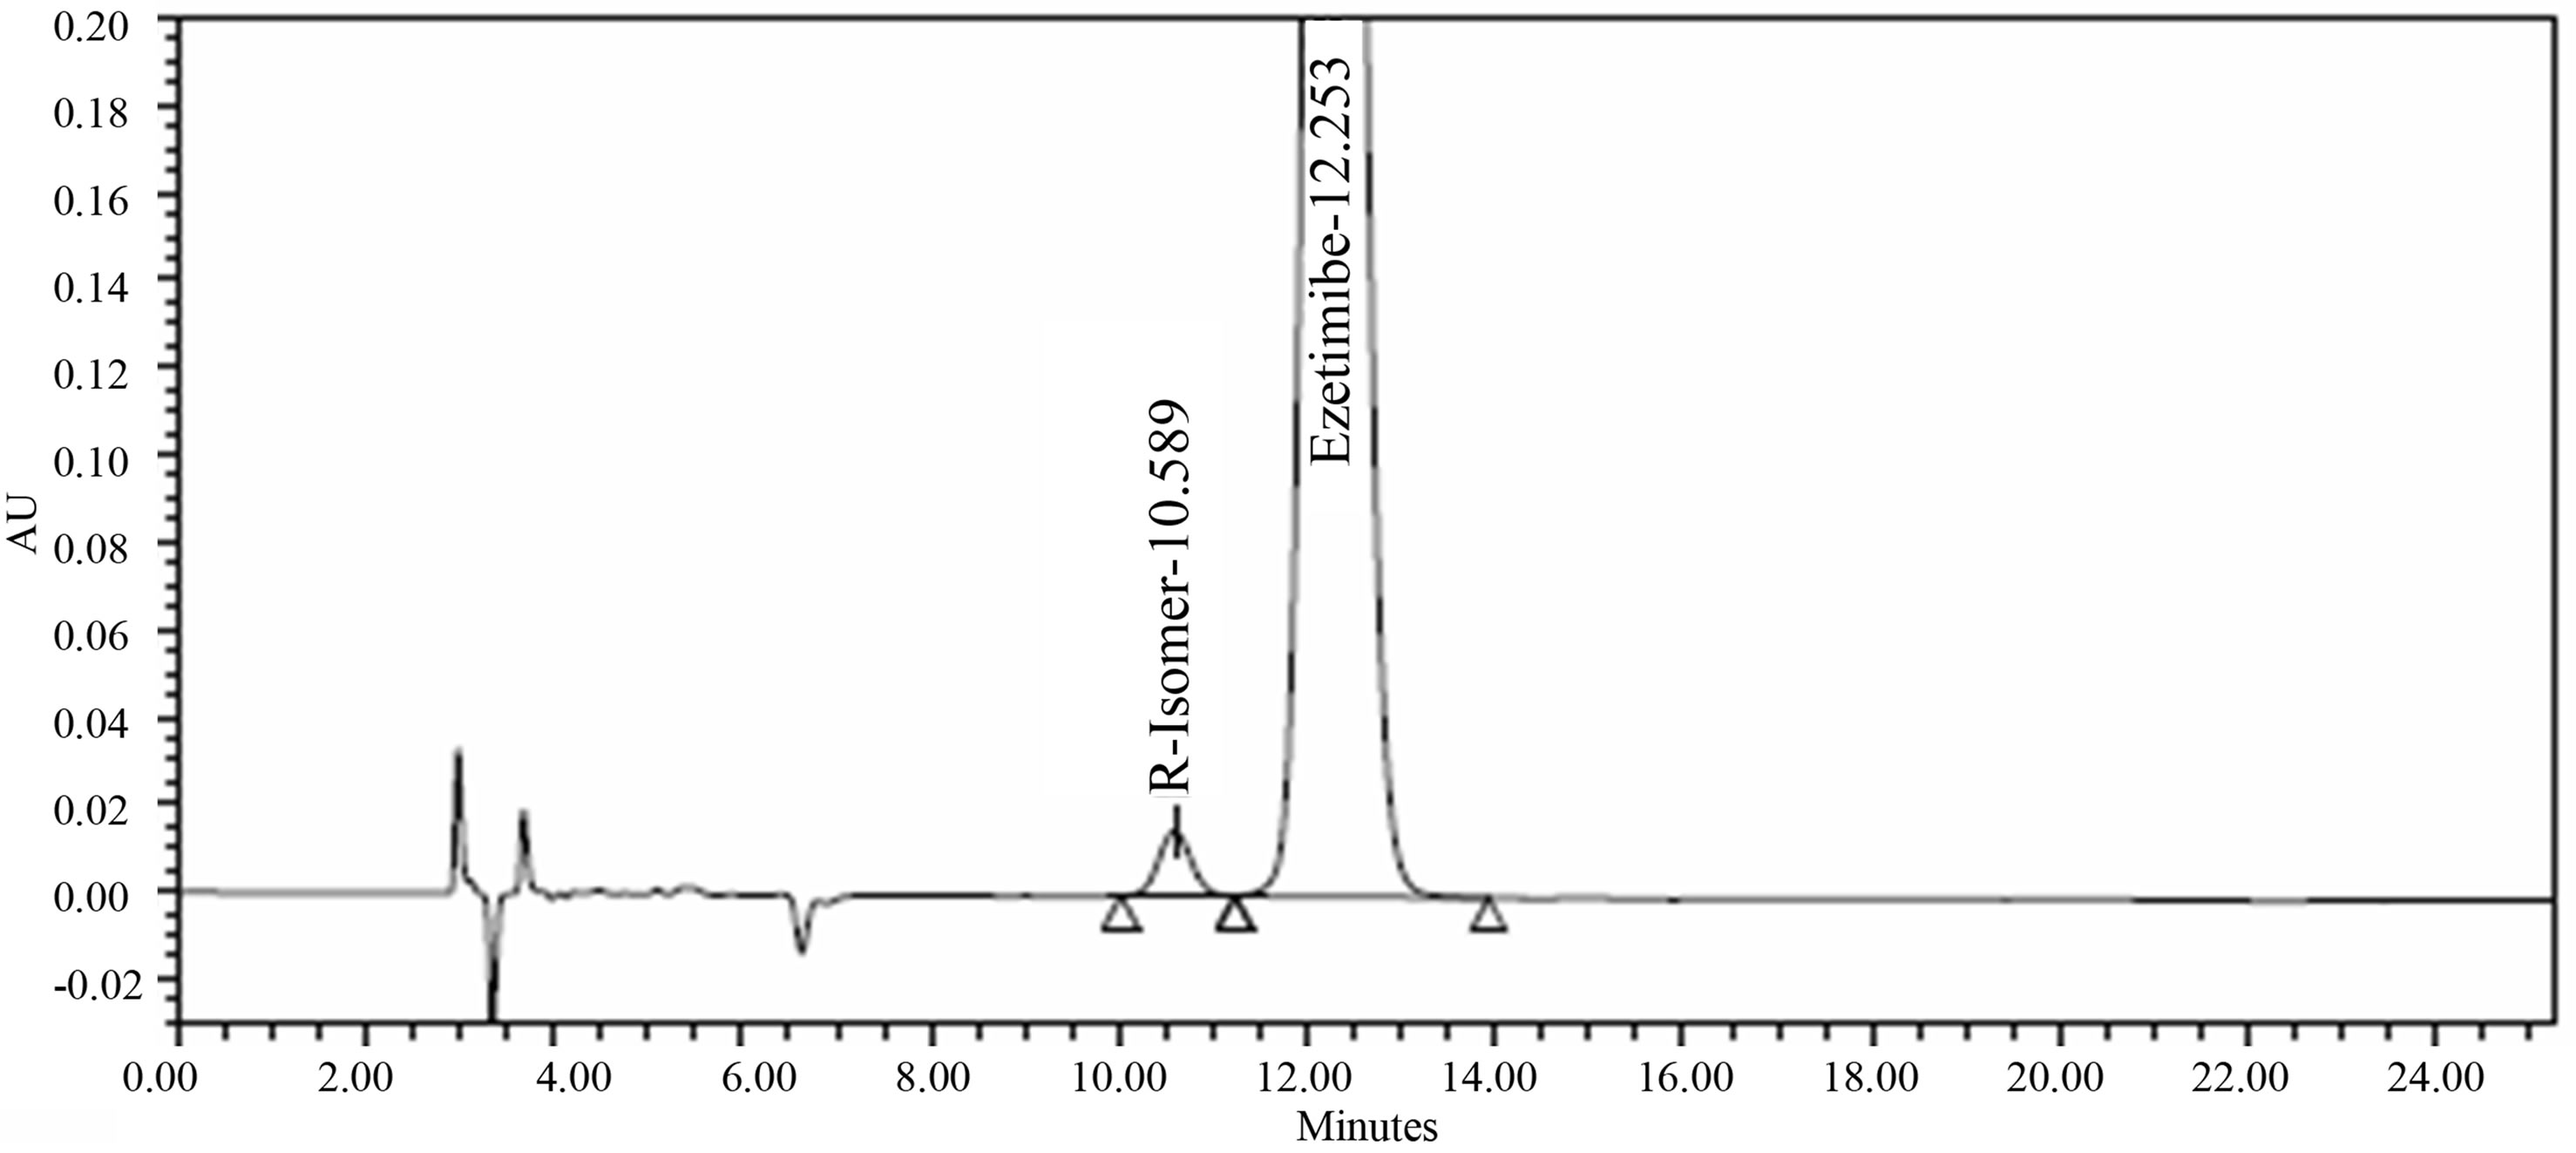
Figure 11. Chromatogram of Isolated R-Isomer.
terization of R-Isomer of Ezetimibe by using Supercritical Fluid Chromatography (SFC). The R-isomer was isolated by using Supercritical Fluid Chromatography (SFC) with Chiralcel OD-H (250 × 4.6 mm, 5D-H column using a mobile phase consisting of Supercritical carbon dioxide and 2-Propanol (85:15). The isolated R-Isomer was characterized by using UV-Visible spectroscopy, FT-IR, Mass number (m/z) m, 1 H NMR, 13 C NMR and by Chiral HPLC analysis.
5. Acknowledgements
The authors would like to acknowledge the management of Inogent Laboratories Private limited, Hyderabad, India.
NOTES