The Efficiency Research on Stock Index Derivatives in a Bear Market—The Evidences from Hangseng Index Derivatives Markets ()
1. Introduction
With the launch of Shanghai-Shenzhen 300 index option soon becoming a reality in China, some issues such as how to put its hedging function into full play, how to establish an efficient option market and how to judge the effectiveness of stock index derivative markets seem extremely urgent. The purpose of this article is to discuss the efficiency of Hang Seng index derivative markets with empirical analysis in order to give suggestions for the stable operation and development of ShanghaiShenzhen 300 index derivative markets, including futures and options markets.
Numerous empirical studies have been done by foreign researchers since the relationships among the price of futures, option and spot directly shows the efficiency of futures and option markets. Firstly it is about the intraday price relationships between the stock index and the index futures. Stoll and Whaley (1986) [1] report that there are frequent violations of the cost-of-carry relationship using hourly S&P500 index and index futures data. Kawaller, Koch, and Koch (1987) [2] investigate the intraday price relationship between S&P500 futures and the S&P500 index using three-stage least-squares regression. They find that the futures price movements consistently lead index movements by 20 to 45 min, while the index price rarely affects the futures price beyond 1 min. Hodgson, Masih and Maish (2006) [3] conclude that futures prices provide a short-term information lead to stock prices. Fleming, Ostdiek and Whaley (1996) [4] argue that, in general, instruments with lower trading costs play a more important information discovery role compared to their higher cost substitutes. Therefore, it is expected that returns in index futures lead returns in the underlying cash index, and numerous studies have provided supporting evidence on the conjecture, such as Grabade and Silber (1983) [5], Kawaller, Koch and Koch (1987), Herbst, McCormack and West (1987) [6], Stoll and Whaley (1990) [7], Schroeder and Goodwin (1991) [8], Chan (1992) [9]. These studies are based on the intraday price relationship between the stock index and its futures and use different time-intervals. Examples of this include daily, even high frequency data, 1, 5, 10-minute or as far as 60-minute price data. Secondly it is about the price relationships between the stock index and the index option. Manster and Rendleman (1982) [10], Bhattacharya (1987) [11], Anthony (1988) [12] argue that the options price leads the stock market. Stephan and Whaley (1990) [13] report that price changes in the stock market lead those in the option market for active CBOE call options by 15 minutes. Finucane (1991) [14] describes that the measure of the relative index option prices leads the stock market by at least 15 minutes. Chan,Chung and Johnson (1993) [15] use a nonlinear multivariate regression model to report that stocks lead options by 15 minutes confirming Stephan and Whaley’s results. They analyze the cause of the lead-lag relationship based on the relatively larger option tick, and it might be a spurious lead by infrequent trading of options. Thus, foreign researchers have failed to reach a consensus on the price relationships between the stock index and the index option. Thirdly, it is about the interrelationships among the prices of the index futures, index options and the underlying index. Fleming, Ostdiek, and Whaley (1996) [4] provide a trading cost hypothesis for the relative rates of price discovery in the stock index, futures, and options markets. Their empirical results with 5-min returns for the markets show that S&P500 index futures lead S&P500 stock index, and S&P100 index options lead the S&P100 stock index. Gwilym and Buckle (2001) [16] examine the lead-lag relationships between the FTSE 100 stock index and its derivatives markets with hourly data. They report that the index call options strongly lead the index futures, and the futures strongly lead puts. Chiang and Fong (2001) [17] study the lead-lag relationships among the spot, futures and options markets on Hong Kong’s Hang Seng Index (HSI). They report that the option returns lag the cash index returns, the futures returns lead the cash index returns, yet its lead over the cash index appears to be less than the counterparts in other countries. They think a possible reason is the dominance and active trading of a few major stocks in the index. Nam, Oh and Kim (2006) [18], (2008) [19] investigate the relationships between Korean Kospi 200 stock index and its related derivatives markets and the pricing bias of its index options using different methods. The results explain that index futures and options markets both play a pricing discovery role for the underlying cash markets, but index option is stronger than index futures. The pricing bias is affected by market efficiency, money ness, and implied volatility.
The market efficiency research of China mainly focused on the stock market in the previous period and go with the development of China’s financial market. Rong Chen, Zhenlong Zheng (2008) [20] point out there are two kinds of future market’s efficiency-pricing efficiency and information efficiency and only a futures market with pricing efficiency could hedge risk as effectively as possible through analyzing domestic and foreign literature.
We focus on the market efficiency of index option and futures markets and report the lead-lag relationships among the stock index, futures and options in the paper. We think the stock index has huge promotion to the stock index futures markets.
The remainder of the paper is organized as follows. In section 2 we describe our data, methodology and model. In section 3 reports the results of the empirical research. The final section provides a discussion of the results and concluding remarks.
2. Data and Methodology
The HSI is the most commonly used benchmark for Hong Kong’s stock market. All of the component stocks are traded on the Stock Exchange of Hong Kong (SEHK). The HSI futures contracts were introduced on 6 May 1986 by the HKFE. The contract size is the HIS futures price times HK $50. The lasting trading day is the second last business day of the maturity month. The HSI option contracts were launched on 5 March 1993 by the HKFE. The contracts are European in nature. The contract cycle and trading hours are the same as the HSI futures contracts.
2.1. Data
Our data on the HIS and Hibor datas are provided by WIND, the data on the HSI continuous futures and options are from Data stream. The riskless interest rate is 6-month HIBOR: (Hong Kong Inter Bank Offer Rate). The sample period of this research is between 3 July 2007 and 31 March 2009 because it was a bear market in this period.
In order to test the relationships between the hangseng index options and other markets, it is necessary to calculate the implied index level by the Hangseng index options prices. Following Manaster and Rendleman (1982) [10], Nam(2008) [19] except for divedend paying consideration, the Black-Scholes option pricing model is used to recover the implied index level. As an input for the volatility, we compute the implied volatility of nearby at-the-money option of the previous day. We assume a flat term structure, set to 0.05.
2.2. Methodology
Using the similar research methodology to Nam (2008) [19], our research uses ADF (augmented Dickey-Fuller unit root test), Johansen cointegration test, and vector error correction model. In this research, to determine whether the time series are stationary, augmented Dickey-Fuller unit root test is performed. If the time series is non-stationary from the result of augmented DickeyFuller unit root test, co-integration tests are conducted. If the series are co-integrated, an error correction model is appropriate and allows for both short-run dynamics and long-term trends.
Ibrahim (2003) [21] said that the vector error correction model conveniently combines their short-run interactions and the long-run behavior of the variables and thus can better reflect the relationship among variables. When the two price series have a CI(1, 1) relationship, an error correction model is not subject to spurious results. The vector error correction model is defined by the estimation of the following equations:
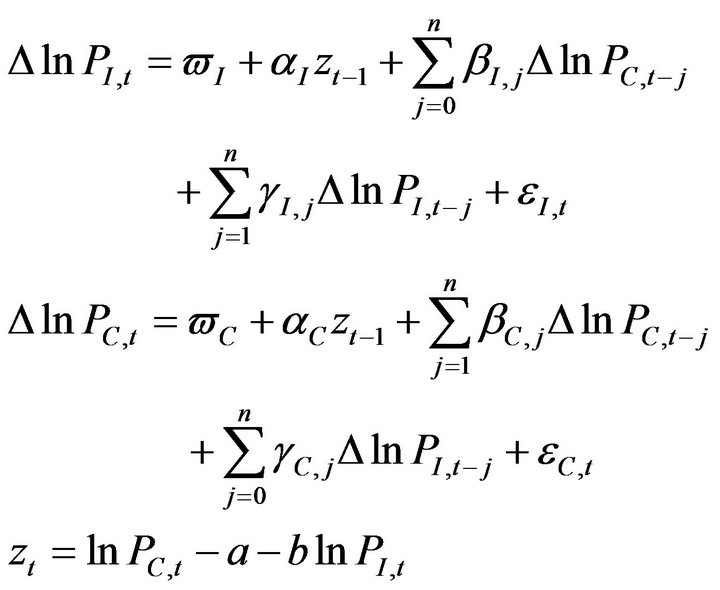
The VEC model between Hangseng index futures and Hangseng index as equations (1):
 (1)
(1)
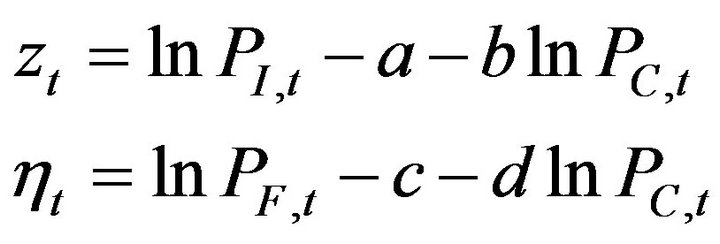
The VEC model between Hangseng index and Hangseng option implied index as equation (2):
 (2)
(2)
The VEC model between Hangseng index futures and Hangseng option implied index as equation (3):
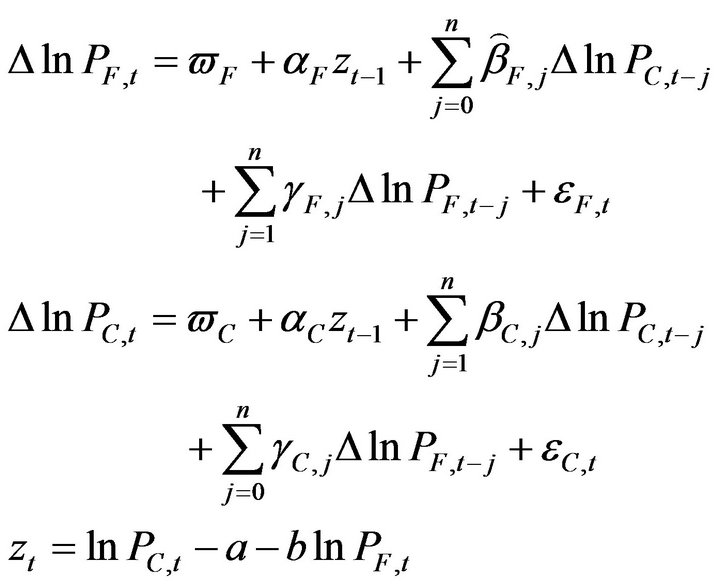 (3)
(3)
where ,
,  ,
,  are the returns of the Hangseng index price, index futures price and index option price at time t, respectively.
We try to capture both short and long-run effects in the Hangseng index, its futures and its options prices using the VEC models. According to Granger (1988), Bahmani-Oskooee and Alse (1997), the VEC models can be used to analyze the Granger-causality and the lead-lag relationships in the Hangseng index price, the index futures, and the index options markets based on the raw index return data. The co-integrating parameter, is sometimes called the long-run parameter. The remaining portions of the equations are the lagged returns, which represent short-run effects of the previous period’s returns on the current period’s returns.
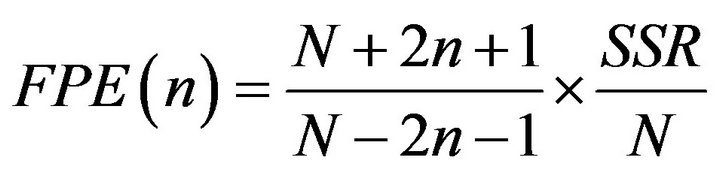
In this paper, the optimal lag length is selected by minimizing Akaike’s (1970) [22] final prediction error (FPE) criterion, the same method as Ajayi et al. (1998) [23]. The estimate of the FPE is obtained from:
 (4)
(4)
where N is the sample size and SSR is the sum of squared residual.
3. Empirical Results
First of all, we use the augmented Dickey-Fuller test to determine whether asset price data are subject to the I(1) process. Table 1 displays the result of the ADF test.
In this study, all test statistics of the Hangseng index and its derivative prices are more than 10% critical value under the null hypothesis of a unit root or non-stationarity. We can therefore conclude that all price processes are the I(1) process.
The co-integrating series as defining a long-run statistical equilibrium relationship. To check the existence of the co-integration relationship, we use the Johansen Co-integration Rank Test.
From Table 2, we can conclude that the co-integration relationship between assets has been shown to be significant. Therefore, asset price data show a CI(1,1) relationship.
By the result of the Johansen Co-integration Rank Test, we can detect a CI(1,1) relationship between the assets price data. Then, we test an error correction model by the estimation of the above equations (1)-(4).
Table 3 displays the parameter estimates from the regression with the error correction model.
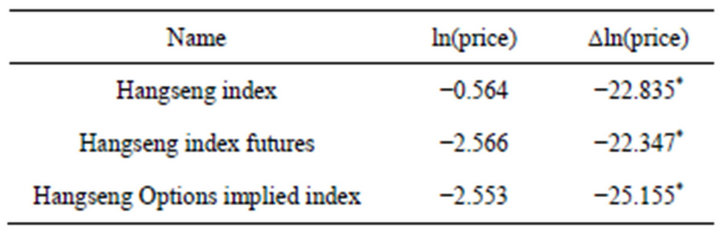
Table 1. ADF test result in the Hangseng index, Hangseng index futures and Hangseng index option price.
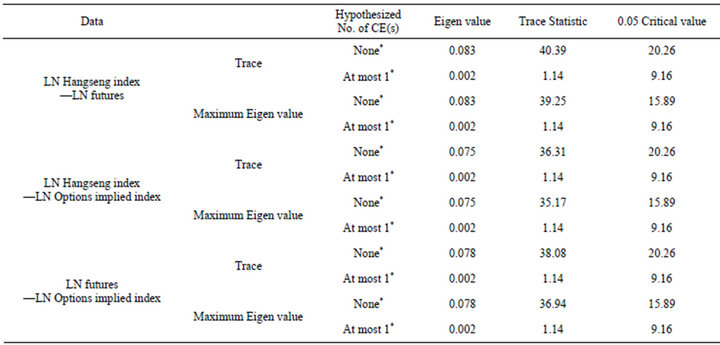
Table 2. Johansen Co-integration Test in the Hangseng index , Hangseng index futures and Hangseng index option price.
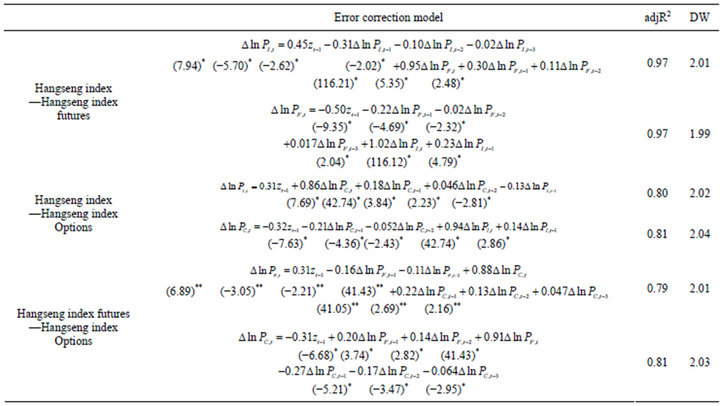
Table 3. The parameter estimates of the error correction model.
From table 3, we can verify the pricing efficiency through the error correction model and conclude the Granger-causality and the lead-lag relationships among the Hangseng index, Hangseng index futures and Hangseng index option markets.
1) From the long-term (ECM), it shows the bi-directional causality relationship among all assets under a 1% level of significance. The coefficients of the error correction term that exhibits an adjusting speed to the balance indicate whether the unbalance disappears or not. All the coefficients of the error correction term in the above models are non-zero suggests that Hangseng index derivatives markets are pricing efficiently.
2) We measure the lead-lag effect through coefficient and between Hangseng index and futures markets. As the result of the regression with the error correction model, the Hangseng index futures lead the Hangseng index, the Hangseng index options lead Hangseng index futures. The lead-lag effects are consistent with the result of the previous studies.
3) The lead-lag relationships between Hangseng index and its derivatives markets can be supported by the trading cost hypothesis. It also proves that the existence of Hangseng index option market has a huge promotion effect to Hangseng cash and futures markets and increases their liquidity.
4. Conclusions
We study the pricing efficiency and lead-lag relations among the markets for the spot, futures and options on the HSI in a bear market. Our analysis sheds lights on the pricing efficiency of the HSI index derivatives markets.
We find that 1) The lead-lag relationships show that Hangseng index futures and option markets play a more important price discovery role; 2) The pricing efficiency test demonstrates that both Hangseng index futures and options markets are all efficient; 3) It proves that the existence of Hangseng index option market has a huge promotion effect to Hangseng cash and futures markets and increases their liquidity. This conclusion gives evidence that China should continuously develop the index derivatives markets. Thus, it further suggest that with the steady operation of Shanghai-Shenzhen 300 stock index futures, China could launch the stock index options with the same underlying index in due time and form a pattern that stock index futures and option markets develop in parallel.
5. Acknowledgements
This paper is supported by the humanities and social sciences research program of Shandong colleges and universities (J13WF02).