1. Introduction
The chalcogenide glasses have drawn a great attention since last 5 - 6 decades due to their wide range of applications in various fields [1]. These glasses are amorphous semiconductor in nature and transparent to infrared region of electromagnetic wave (radiation) and reveal unique electrical and optical properties. Due to these properties, the chalcogenide glasses are useful for several applications such as threshold switching, memory switching, inorganic photoreceptors and optical wave guide [2,3]. The reversible transformation property of Selenium (Se) based chalcogenide alloys makes these alloys very useful in optical memory devices, X-ray imaging and photonics [4]. But glassy Se has some shortcoming such as low photosensitivity and low thermal stability. The various additives with glassy Se produce binary chalcogenide glassy system e.g., Se-In, Se-Te, Se-Ge, Se-S, Se-Sb and others [5-8]. These are of great interest due to better hardness, better stability, higher sensitivity and change (higher or lower) in crystallization ability. The addition of third element expands the glass forming area and also causes configurationally disorder in the system.
The thermal behavior of the chalcogenide glasses plays an important role in determining the transport mechanism, thermal stability and useful applications. The differential scanning calorimeter (DSC) technique has so for been employed to study the crystallization process in amorphous alloys and proved to be the most effective method for such studies [9]. The DSC can be used eighter in isothermal mode or in non isothermal mode. The drawback of later is that the analysis of non isothermal experiments is generally more complicated than isothermal one [9,10]. However, in isothermal experiments it is impossible to reach a test temperature instantaneously [11]. Iso-Conversional methods are used for non isothermal analysis, in which the transformation rate at a constant crystallized fraction is only a function of temperature as suggested by Vyazovkin et al. [12-15] and other workers [16,17]. IsoConversional techniques make it possible to estimate the activation energy of a process as function of the crystallized fraction α. Analysis of the activation energy dependence on α provides important clues about reaction mechanism. Therefore, the activation energies for such processes can logically not be same and it may vary with degree of conversion [18].
In the present study, we report the crystallization kinetics of Se80In10Pb10 chalcogenide glass. The activation energy was determined using four iso-conversional methods (Kissinger-Akahira-Sunose (KAS), Flynn-WallOzawa (FWO), Tang and Straink). The Avrami exponent also has been determined to study nucleation and growth during crystallization process.
2. Material Preparation and Experimental Technique
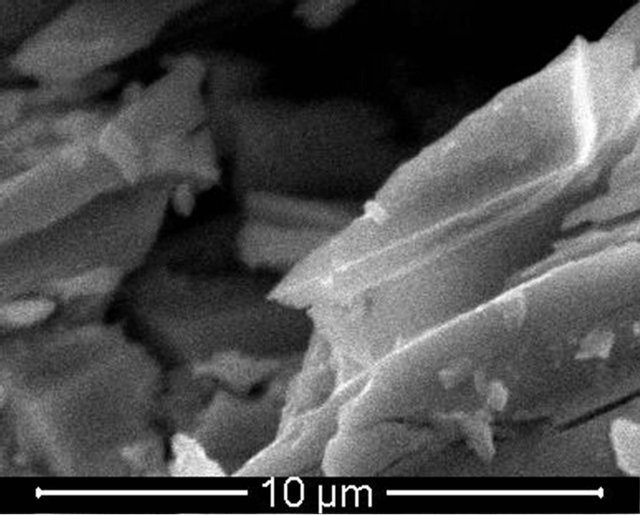
The investigated Se80In10Pb10 chalcogenide glass was prepared from high purity (99.999%) Se, In and Pb elements by melt quenching technique. The desired amounts of constituent elements were weighed according to their atomic weight percentage and put into cleaned quartz ampoule. The ampoule was evacuated and sealed under a vacuum of 10−5 Torr to exclude reaction of alloying materials with Oxygen at higher temperature. The sealed ampoule was heated in a furnace at rate of 4 - 5 K/min and raised the temperature up to 1100 K and kept it at that temperature for 12 hours. During the melting process the ampoule was frequently rocked to ensure the homogeneity of alloying materials. After the above said period, the ampoule with molten materials was rapidly quenched into ice cooled water. The ingot of glassy material was taken out from ampoule by breaking them. The X-ray diffraction pattern of as prepared material was recorded using Philips PW-1830 Diffractometer with Cu-Kα (λ = 1.54 Å) to confirm the amorphous nature of prepared glass. The XRD pattern of Se80In10Pb10 chalcogenide glass is shown in Figure 1. The absence of sharp structural peak confirms the amorphous nature of Se80In10Pb10 chalcogenide glass. The surface morphology of Se80In10Pb10 chalcogenide glass was done by using Scanning Electron Microscopy (SEM) (Model: Quanta 200). The SEM image is shown in Figure 2(a). This again confirms the amorphous nature of prepared glass. The composition of Se80In10Pb10 chalcogenide glass is also confirmed by using an energy dispersive X-ray analysis (EDAX). The EDAX spectrum of Se80In10Pb10 is shown in Figure 2(b). The crystallization kinetics of prepared chalcogenide glass was studied by using differential scanning calorimeter (DSC) (Model: Shimadzu DSC60) at different heating rates of 5, 10, 15 and 20 K/min. The accuracy of the heat flow in instrument is ±0.01 mW and temperature precision of instrument is ±0.1 K with an average standard error ±1 K in measured values (glass transition, crystallization and melting temperatures). The DSC was calibrated prior to the measurement using high purity standard Indium (In) with well known melting point.
3. Results and Discussions
The DSC thermograms of Se80In10Pb10 chalcogenide glass at different heating rates (5, 10, 15 and 20 K/min) are shown in Figure 3. The DSC thermograms at each heating rate shows a well-defined endothermic peak at the glass transition temperature Tg and an exothermic peak at the crystallization temperature Tc. The crystallized fraction α at a given temperature T is given as α = (AT/A), where A is the total area of the exothermic
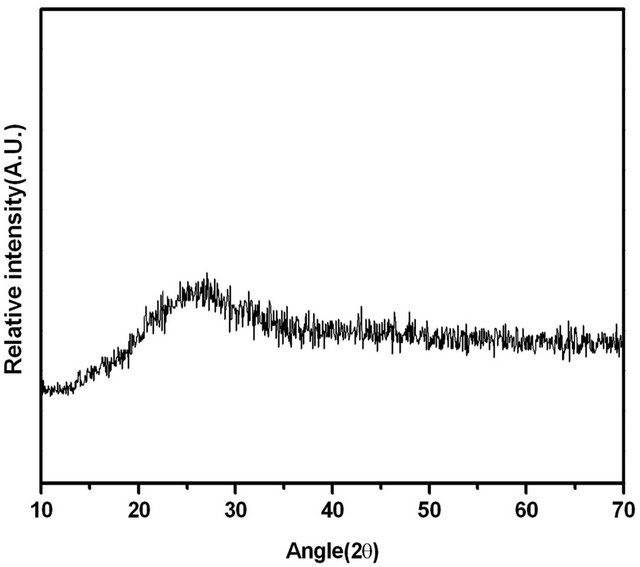
Figure 1. XRD pattern of Se80In10Pb10 chalcogenide glass.
 (a)
(a)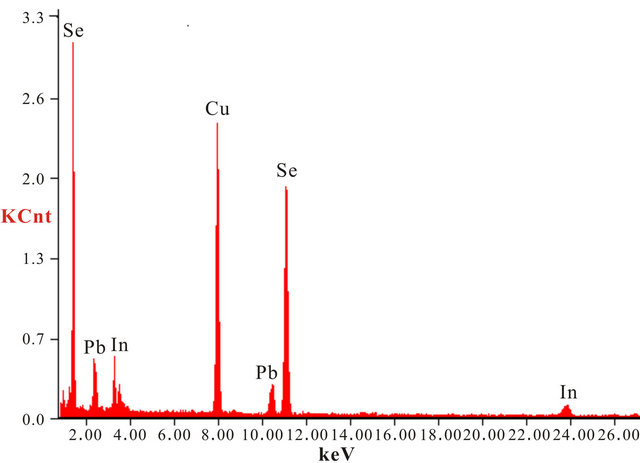 (b)
(b)
Figure 2. (a) SEM image and (b) EDAX spectrum of Se80In10Pb10 chalcogenide glass.
peak between the onset temperature (Ti) where crystallization just begins and the temperature (Tf) where the crystallization is completed. AT is the area between Ti and T. The values of T corresponding to α are listed in Table 1. From Table 1 we observe a systematic shift in T to higher temperature with increasing heating rates. The graph of α versus T at four different heating rates is
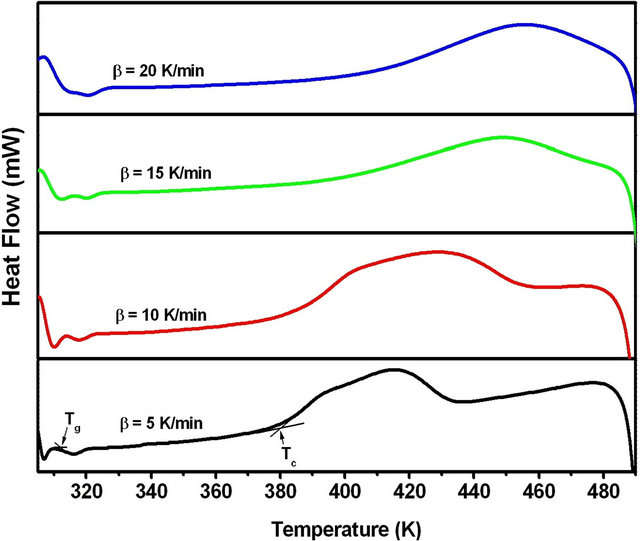
Figure 3. DSC thermograms of Se80In10Pb10 chalcogenide glass at different heating rates.
Table 1. The values of temperature in crystallization region for different crystallized fraction Se80In10Pb10 chalcogenide glass at different heating rates.

shown in Figure 4. Figure 4 shows the degree of crystallization as a function of temperature at different heating rates.
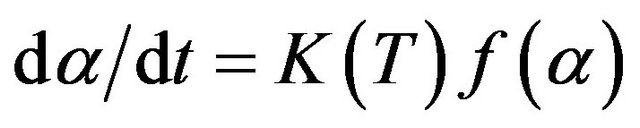
The kinetics of crystallization in amorphous material can be described by the following rate equation [19]:
 (1)
(1)
where, K is the reaction rate constant usually has Arrhenius temperature dependence,  is the reaction model, t is time and α is the crystallized fraction.
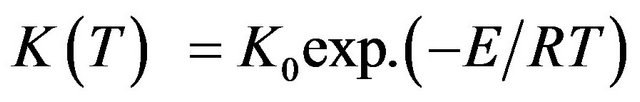
But reaction rate constant K is given by following equation:
 (2)
(2)
where, K0 is pre-exponential factor of rate constant, E is activation energy, T is temperature and R is universal gas constant.
Under non-isothermal condition with a constant heating rate  and using Equation (2), Equa-
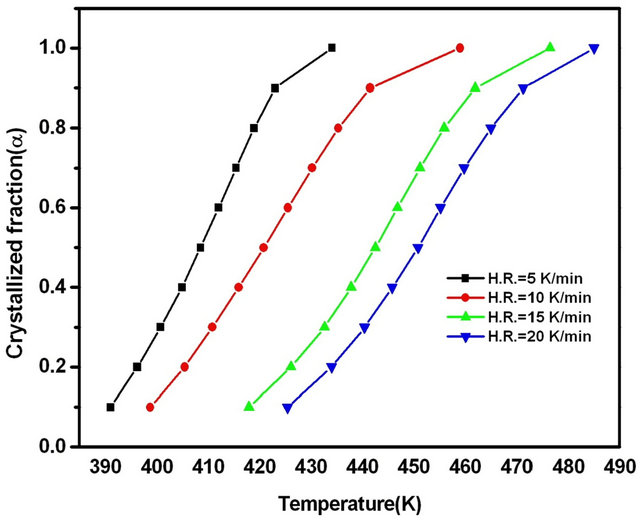
Figure 4. Graphs of α versus temperature T for Se80In10Pb10 chalcogenide glass.
tion (1) can be written as:
 (3)
(3)
There is a variety of theoretical models and mathematical equations to explain the estimation of crystallization kinetics. The following four iso-conversional methods have been used in present study to analyze the crystallization kinetics of Se80In10Pb10 chalcogenide glass. All the four methods require the determination of the temperature Tαi at which a fixed fraction α of the total amount is transformed.
3.1. Kissinger-Akahira-Sunose (KAS) Method
In KAS method, the relation between the temperature Tαi and heating rate βi is given by [20,21];
 (4)
(4)
The subscript i denotes different heating rates. For each degree of the conversion α, a corresponding Tαi and heating rates are used. The graphs of  versus 1000/Tαi for Se80In10Pb10 chalcogenide glass are shown in Figure 5. From the slopes of straight lines obtained in Figure 5, we have evaluated the value of Eα. The obtained values of Eα are listed in Table 2.
3.2. Flynn-Wall-Ozawa (FWO) Method
In FWO method, the relation between the temperature Tαi and heating rate βi is given by [22-24];
 (5)
(5)
The graphs of ln(βi) versus 1000/Tαi for Se80In10Pb10 chalcogenide glass are shown in Figure 6. From the slopes of straight lines obtained in Figure 6, we have evaluated the value of Eα. The obtained values of Eα are listed in Table 2.

Figure 5. Graphs of 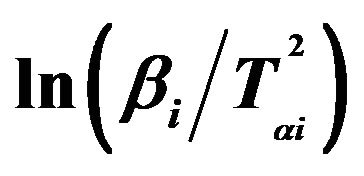 versus 1000/Tαi for Se80In10Pb10 chalcogenide glass.
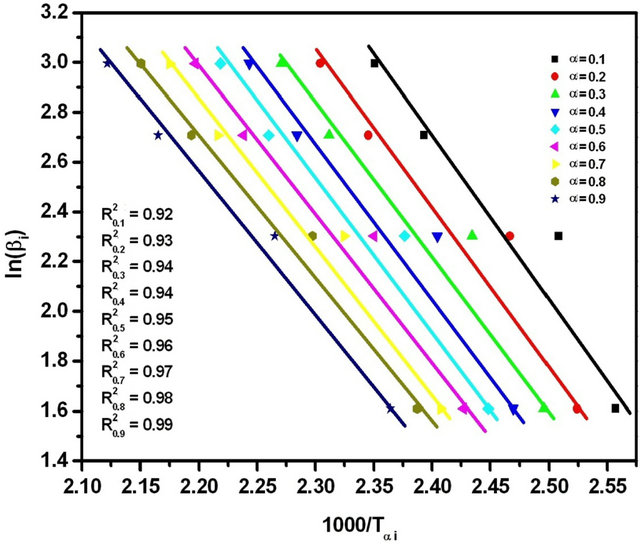
Figure 6. Graphs of ln(βi) versus 1000/Tαi for Se80In10Pb10 chalcogenide glass.
Table 2. The values of activation energy of crystallization of Se80In10Pb10 chalcogenide glass at different crystallized fraction (α) for different iso-conversional methods.

3.3. Tang Method
In Tang method [25], the relation between the temperature Tαi and heating rate βi is given by;
 (6)
(6)
The graphs of 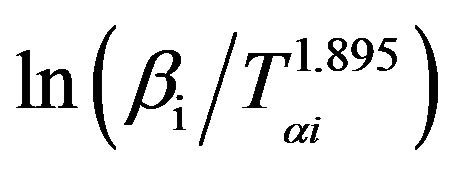 versus 1000/Tαi for Se80In10Pb10 chalcogenide glass are shown in Figure 7. From the slopes of straight lines obtained in Figure 7, we have evaluated the value of Eα. The obtained values of Eα are listed in Table 2.
3.4. Straink Method
In Straink method [26,27], the relation between the temperature Tαi and heating rate βi is given by;
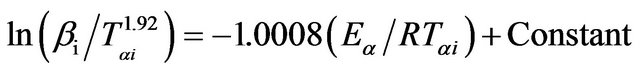 (7)
(7)
The graphs of  versus 1000/Tαi for Se80In10Pb10 chalcogenide glass are shown in Figure 8. From the slopes of straight lines obtained in Figure 8, we have evaluated the value of Eα. The obtained values of Eα are listed in Table 2.
The purpose of apply four different iso-conversional methods for evaluation of Eα is to check the validity of the four methods. The values of Eα obtained by the four methods are in good agreement. There is an about 1% experimental error in the evaluation of Eα by all four methods. The Kissinger-Akahira-Sunose (KAS) method is sometimes called generalized Kissinger method is one of the best iso-conversional method [28]. It is clear from Table 2 that the activation energy shows a little variation with α and T in these four methods. If the values of Eα are independent of α, the crystallization process is dominated by a single step reaction mechanism [29]; on the other hand, a considerable variation of Eα with α could
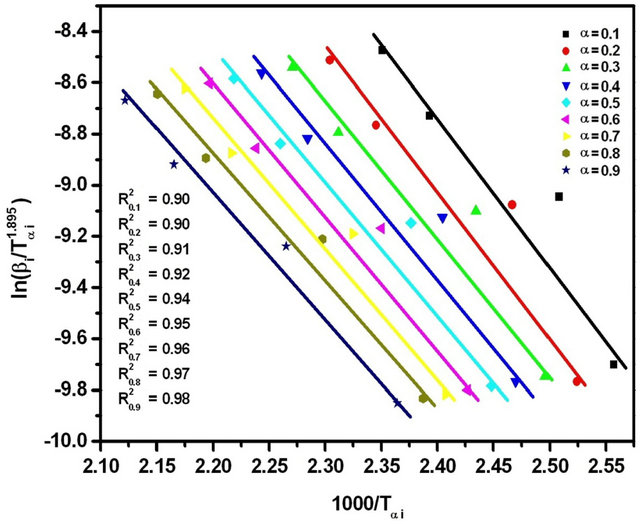
Figure 7. Graphs of  versus 1000/Tαi for Se80In10Pb10 chalcogenide glass.
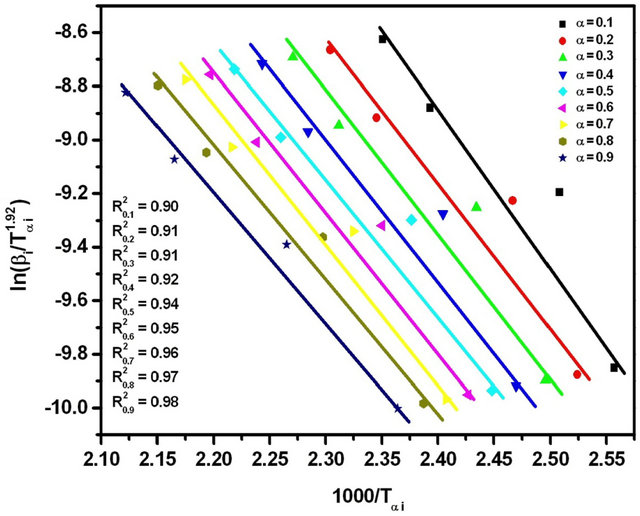
Figure 8. Graphs of  versus 1000/Tαi for Se80In10Pb10 chalcogenide glass.
be explained in terms of multi-step reaction mechanism [30,31]. If the relative error of the Eα evaluated from iso-conversional method is lower than 10%, then the values of Eα can be considered as independent of α [32]. From Table 2, it is seen that the values of Eα at different crystallized fraction evaluated by four iso-conversional methods vary here by about 7.9, 6.2, 7.7 and 8.1%, respectively. So, the crystallization process could be considered as a single step reaction mechanism. The variation of the activation energy with temperature demonstrates that the rate of crystallization is actually determined by the rates of two processes; nucleation and diffusion. Because these two mechanisms are likely to have different activation energies, the effective activation energy of the transformation will vary with temperature [17,33]. This interpretation is based on the nucleation theory proposed by Fisher and Turnbull [34]. It is clear from the observed temperature dependence of the activation energy in Se80In10Pb10 glass that the amorphous to crystallization can be described by single-step reaction mechanism.
The Avrami exponent can be calculated from the following equation [35]:
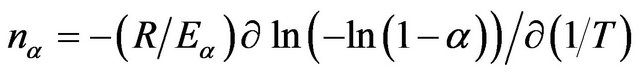 (8)
(8)
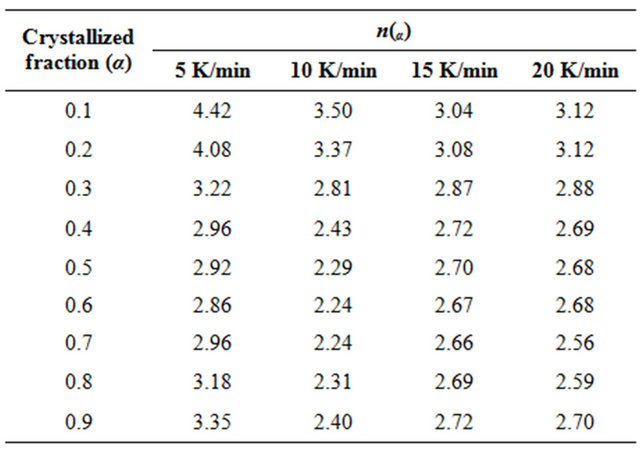
The evaluated values of the Avrami exponent nα are listed in Table 3. It is clear from Table 3 that nα decreases with increasing temperature. It is well known that crystallization of chalcogenide glasses is associated with nucleation and growth process. The degree of crystallization increases with increase in temperature. In other words, it attains its maximum value 1. The decrease in value of nα with increasing temperature suggests that the character of crystallization changes from nucleation-driven in the beginning to essentially a growth-driven regime by the end of crystallization process.
Table 3. The values of local Avrami exponent n(α) of Se80In10Pb10 chalcogenide glass at different crystallized fraction (α) for different heating rates.
4. Conclusions
1) The activation energy as determined from the four iso-conversional methods was found to be varying in the same way and show a little variation with crystallized fraction and temperature.
2) The Avrami exponent nα also show a little variation with crystallized fraction and temperature.
3) The transformation from amorphous to crystalline phase in Se80In10Pb10 is a single-step mechanism.
5. Acknowledgements
ISR is thankful to the Principal, Dyal Singh College, University of Delhi, New Delhi for sanctioned study leave to carry out research work. We are also thankful to CSIR, New Delhi for providing financial assistance under research project no. 01(2456)/11/EMR-II to carry out research work.
NOTES