1. Introduction
Maize (Zea mays L.) is the third major cereal crop in the world after wheat and rice. It is the main staple food for hundred millions of people in developing countries especially in Sub Saharan Africa. It is an important source of protein and energy for human and animal and a source of raw materialfor the industry. Maize is a C4 crop with a great photosynthetic activity. It is grown on 161,765,388 hectares with an annual production of 840,308,214 tons worldwide. In the DR-Congo, maize is grown on 1484 780 hectares with an annual production of 11,564,410 tons [1].
Maize grown in the lowlands need at least 500 mm of precipitation well distributed throughout the season. The optimum temperature for its development in lowlands in tropical regions ranges from 30˚C to 34˚C and approximately 21˚C for the highlands [2]. Crop phenology that includes the main developmental stages (tillering, heading, flowering, maturity) depends on the temperature. An increase in temperature usually results in accelerated plant growth [3,4].
Predicting maize yield productions based on climate conditions and forecasting potential food shortage during a particular period are of great interest to maize producers and governments. But, information on yield forecast is very sketchy [5,6]. Moreover, physiological models are rarely used to forecast maize production either at farm, regional or national scales [7].
Key plant stages in simulating maize development include emergence, tassel initiation (vegetative development), silking, seed formation and physiological maturity. An accurateestimate of leaf area index (LAI) is important for accurate simulations of crop light interception, transpiration and dry matter or biomass accumulation, and therefore has a large influence on crop growth and yield [8-10]. A typical LAI pattern begins with a slow increase in the season, followed by a rapid increase of LAI until a maximum value is reached. LAI then declines as the leaves senesce and plants reaches physiologically maturity. There have been several approaches to estimating LAI in maize crop simulation models or in generic crop models applicable to maize. The most common models that can be used to predict leaf area and/or senescence include CERES-Maize [11], AUSIM-Maize [12,13], CORNF [14], and MSB model [15]. Leaf senescence is an expression of plant ageing, but may be influenced by genotype, growing conditions (e.g. plant density, nutrient status, pest incidence), carbon supply, and the overall environment in which the crop is grown [13].
Previous studies reported significant differences between predicted and observed LAI over a wide range of environments and genotypes [8]. The main errors in these analyses were under prediction of total plant leaf area using the AUSIM-Maizea and MSB models and over prediction of senesced leaf area in both models.
Due to many source-feedback processes included as drivers, most of the approaches that are currently used for simulating LAI require a substantial number of input parameters. LAI simulation in WOFOST involves 82 input parameters of which 65 parameters are indirectly associated with LAI via dry matter accumulation and phenology components. Likewise, in CROPGRO, the simulation of LAI was based on the rate of gain and loss of leaf area [16,17]. It involves 203 parameters of which 147 are indirectly associated with LAI via dry matter accumulation and phenology components. In some models like CERES-Maize [11], AUSIM-Maize [12,13], CORNF [14], MSB model [15], and STICS [18,19] parameters with somewhat unclear biological meaning are used too, e.g. time of maximum LAI [20] which are often cultivar specific or have to be derived from model calibration to specific conditions. The input requirement may potentially limit the use of complex maize simulation model for certain practical application such as optimizing planting for maximizing yield potential, making decision on crop management or regional yield gap diagnosis to reduce the gap between potential and real yields [21-23]. Likewise, evaluations of LAI simulation under growth conditions that approach maize yield potential have remained limited.
The main objective of the present study is to develop improved and generalized equations for predicting both leaf area and leaf senescence, for a wide range of maize cultivars with various leaf numbers in a Sub Saharan African region.
2. Materials and Methods
2.1. Field Observations
Three genetically improved maize varieties (Salongo 2, MUS, and AK) and one unimproved variety (local famer variety) described in Table 1 were used for the present study. They were planted in field trials at three sites [site 1 (INERA), site 2 (Mpiana) and site 3 (Mpasu)] in Gandajika (DR-Congo) which falls within the savanna agroecological region of the DR-Congo. The soil of these sitesis sandy clay to heavy clay, red ocher-red, good structure, characterized by a pH of 5.4 to 6.2 with an exchange capacity of approximately 4 meq./100g of soil. The soil textural surface horizons are light and deep horizons are heavy and thin. The relief is very rugged. The adsorption complex is fairly well saturated and there are still weather able minerals [24,25].
Daily maximum (Tmax) and minimum (Tmin) temperatures, rainfall and evaporation were recorded at an automatic weather station of INERA (Figure 1). Seeding was conducted the same day at all the sites and lifting more than 50% was observed after 5 days.
Site 1 (INERA) was located at 06˚48'10S, 023˚59'54E, at altitudes between 735 and 766 m. A total of 81 plotswere sown in October 16th 2007. Three varieties were used: MUS (33%), local (40.7%) and Salongo 2 (25.9%). The previous crops in the field were maize (13.6%) and cassava (86.4%). Only plots with MUS and Salongo 2 were amended with NPK compound fertilizer. Zero tillage (86.4%) and tillage without ridge (13.6%) were observed. The seeding was done atspacing of 0.80 m × 0.80 m (86.4%) and 0.80 m × 0.50 m (13.6%) along the northsouth (39.5%) and east-west (60.5%) orientation and with 3 to 6 grains per hill at a depth of 8 to 9 cm. The plant density varied between 3.9 and 9.2 plants per m2.
Site 2 (Mpasu) was located at 06˚47'55S, 023˚56'41E, at altitudes between 730 and 743 m with 62 plots sowed on October 11th 2007. Three varieties were sown: AK (43.5%), local (30.6%) and Salongo 2 (25.8%). The previous crops were fallow (40.3%), cassava 45.2%) and association of cassava and maize (14.5%).Ridge tillage (43.4%l) and zero tillage were used. The seeding was done at spacing of 1 m × 1 m (30.6%), 1 m × 0.70 m

Figure 1. Rain falls and temperatures during the growing season in 2010 in Gandajika, DR-Congo.
Table 1. Maize varieties used in the study and their characteristics.

Local*: Is the variety maintained by farmers; INERA*: National Institut National pour l’Etude et al. Recherche Agronomiques (in French); IITA*: International Institute of Tropical Agriculture.
(14.5%), 1 m × 0.8 m (29%) and 1.4 m × 1.4 m (25.8%) along the north-south (39.5%) and east-west (25.8%) orientation with 3 to 5 grains per hill at a depth of 5 to 6 cm. The plant density was between 1.5 and 5.2 plants per m².
Site 3 (Mpiana) was located at 06˚36'59 023˚56'31 South and East, at altitudes between 669 and 683 m. A total of 32 plots sown on October 24th 2007. Two varieties were sown: AK (43.8%) and local (56.2%). The previous crops include fallow (28.1%), maize (18.8%) and association of cassava and maize (53.1%). Only tillage without ridge was used at this site. The seeding was done at spacing of 0.8 m × 0.8 m (28.1%), 0.9 m × 0.9 m (28.1) and 1 m × 1 m (43.8%) along the east-west (81.5%) and north-east (18.8%) orientation at 4 to 6 grains per hill at a depth of 5 to 6 cm. The plant density varied between 2.4 and 6.7 plants per m2.
2.2. Data Collection
2.2.1. Number of Leaves and Leaf Area (LA)
Tenmaize plants selected randomly in each plot were tagged and used for a non-destructive sampling that was conducted every 10 days. Total number of leaves was counted until the last leaf was fully expanded. A leaf was considered senesced if less than half of its area remained green. Leaf length (LL; from the junction of the leaf blade and leaf sheath, or in leaves that were not fully expanded, the junction of the expanded part of the leaf and the whorl) and leaf width (LW: at the widest part of the leaf) were measured on each leaf. Senesced leaf area and green leaf area were calculated from the numbers of senesced and green leaves. LL and LW of each leaf were also recorded. These data were used in Equation (1) to calculate the leaf area [26].
 (1)
(1)
Leaf area index (LAI) is the product of total leaf area and the plant population per m2 (Ruget, 1991). The leaf area index was based on the Baret model, whose parameters are estimated by nonlinear fitting that adapts the model to the experimental conditions (Koetzand et al., 2005).
 (2)
(2)
where:
K = maximum LAI;
Ti = tassel initiation temperature;
B = rate of growth;
A = rate of senescence;
T = cumul of thermal time.
The leaf area index is described in two parts, growth and senescence. The growing phase is defined by a logistic equation with the parameter b corresponding to the growth rate compared to Ti, the accumulated thermal time inflection point. Senescence is determined by an exponential equation with the parameter being the ratio of growth rate and Tf, the thermal time expressed in cumulative temperatures where all leaves are senescing. The parameter K describes the maximum amplitude of the leaf area index. The parameters b and Ti describe the dynamics before the time of maximum LAI, while Tf and a are related to the period after the maximum leaf area index (LAI max). Vegetative stage is the time between the emergence and Ti. The reproductive stage begins at Ti to the time when LAI = K (Affholder et al. 2003). Plant height and grain yield were also measured.
2.2.2. Crop Ontogeny
Tassel initiation (Ti) was not measured, but was estimated in thermal time units or degree-days, using the temperature coefficients (2).

where Tb is the base temperature which is 10˚C for maize [27].
The date of tasseling and silking were recorded. The times of physiological maturity were determined by regularly sampling two cobs per plot to assess the presence of black layers at the base of the grain. This black layer is an indication that no further accumulation of grain mass is possible [28]. Grains were removed from the base, middle, and distal end of the cobs. Physiological maturity was recorded and it corresponds to the stage when at least 75% of the removed grains in each plot had black layers.
2.2.3. Statistical Analysis
A Non Linear Regression was performed using the nls function of R package equivalent to NLIN procedure for model parameterization (K, Ti, b, a Tf) [29]. Standard error calculi and significance of parameters were determined at P ≤ 0.05 (*), 0.01 (**) and 0.001 (***) by a Student test. An analysis of variance was conducted using aov function of R package to compare the varieties. The Honest Tukey test was used to determine significant differences at P ≤ 0.05 between treatments. A linear regression was performed to found the relation between LAI with the grain yield. Different models were assessed using observed and expected data.
3. Results
Estimates of different parameters based on different models are described in Table 2. There were significant differences for K, b, Ti, LAI, Tf, and a parameters among models and varieties (Table 2). Parameter K describes the maximum amplitude of the leaf area index. The parameters b and Ti describe the dynamics before the time of maximum LAI, while Tf and a are related to the period after the maximum leaf area index (LAI max).
3.1. Maize PlantGrowth
Plant heights for each site are described in Figures 2-4. These measures were recorded from 10 days after sowing until the maximum height. Heights were measured from the collarto the insertion point to the stem of the last ligulate leaf.
3.1.1. Site 1 (INERA)
At the INERA site, the model estimates the maximum height (Asym) of 0.965 m for the Local variety. These values were 0.975 m and 1.05 m for Salongo 2 and MUS, respectively. Half height (Ti) is estimated at 66.1, 57.7, and 65.6 days after sowing for Local, Salongo 2, and MUS varieties, respectively.
3.1.2. Site 2 (Mpiana)
The simulation results of plant height versus days after sowing showed that in soil and climatic conditions of site 2 (Mpiana),maximum height (Asym) is 2.053 m and 1.616 m for the Local and AK varieties, respectively. Half height (Ti) was reached 47.8 days after sowing for the Local variety and 52.3 DAS for the variety AK.
3.1.3. Site 3 (Mpasu)
Simulation of plant height in soil and climatic conditions of site 3 (Mpasu) shows the maximum height (Asym) of 1.454 for the Local variety, 1.198 m for Salongo 2, and 1.156 m for AK. Half height (Ti) is estimated at 61.4 DAS for Local variety. On average, 57.6 DAS and 61 DAS were the estimated duration to reach half height for Salongo 2 and AK varieties, respectively.
Table 2. Estimation of model parameters for four maize varieties in three different sites in Gandajika, DR-Congo.

The parameter K describes the maximum amplitude of the leaf area index. The parameters b, Ti describe the dynamics before the time of maximum LAI, while Tf and a are related to the period after the maximum leaf area index (LAI max). *** represents a significance level of 0.001; ** represents a significance level of 0.01; * represents a significance level of 0.05.
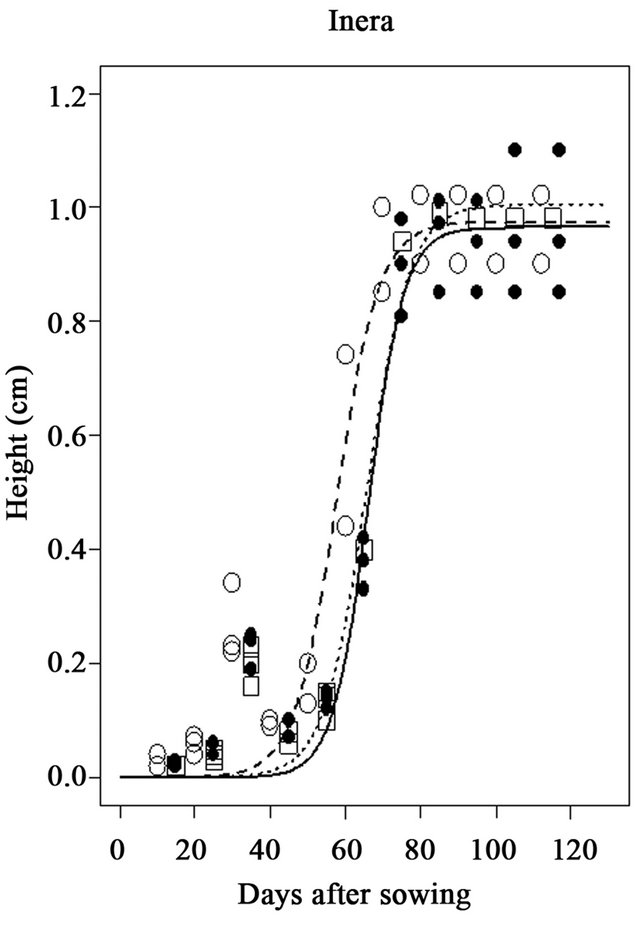

Figure 2. Simulation of plant height of three maize varieties (Local, Musand Salongo 2) growing in site 1 (INERA) in Gandajika, DR-Congo.


Figure 3. Simulation of plant height of two maize varieties (Local and AK) growing in site 2 (Mpiana) in Gandajika, DR-Congo.

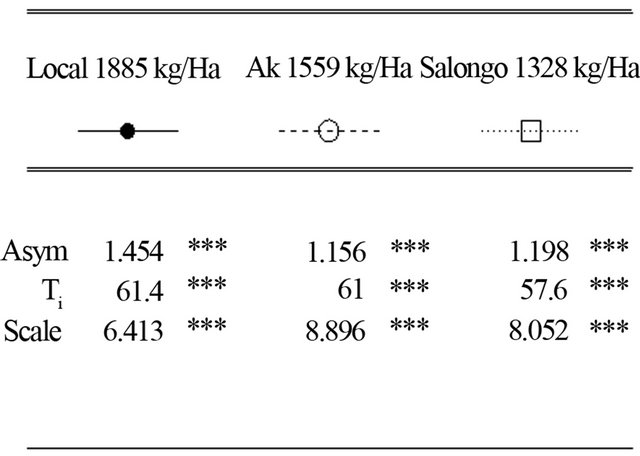
Figure 4. Simulation of plant height of three maize varieties (Local, AK and Salongo 2) growing in Site 3 (Mpasu) in Gandajika, DR-Congo.
3.2. Simulation of Leaf Area Index
3.2.1. Site 1 (INERA)
The model is well suited and leaf area index are well simulated for all the varieties. The maximum leaf area index (K) is estimated at 6.2 for the Local variety with the grain yield of 1516 kg/ha. For Salongo 2, the maximum LAI was 8 and the harvest grain yield was 1784 kg/ha. The maximum LAI and the harvested grain yield were 7.6 and 1210 kg/ha for MUS variety, respectively (Figure 5). MUS and local varieties have low simulated parameter (a) and parameter (b) while the parameters (Ti) and (Tf) are well simulated for all varieties. The model simulated well all the parameters only for Salongo 2. For the vegetative cycle, the accumulated thermal time is simulated at 1807.8˚C·J for the local variety, 1809.3˚C·J for Salongo 2, and 1792.5˚C·J for the MUS variety (Figure 5).
3.2.2. Site 2 (Mpiana)
The maximum leaf area index (K) was estimated at 28.1 for the Local variety with the harvested grain yield of 2073 kg/ha. These values were 20.5 for maximum LAI and 1298 kg/ha for grain yield for the AK variety (Figure 6). The parameter (a) is not well simulated for the variety AK and is poorly simulated for the Local variety. The parameter (b) is not well simulated for the Local
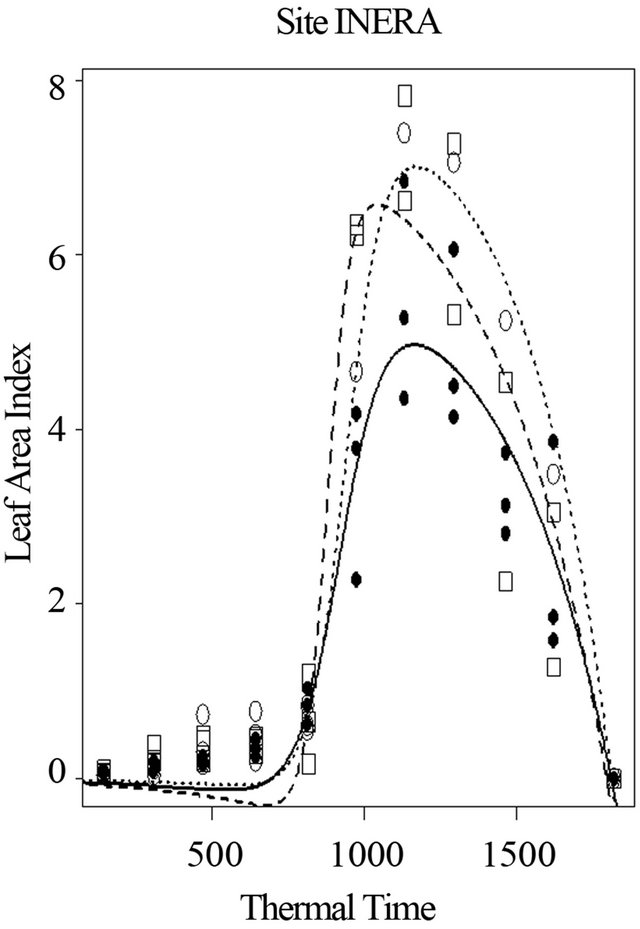
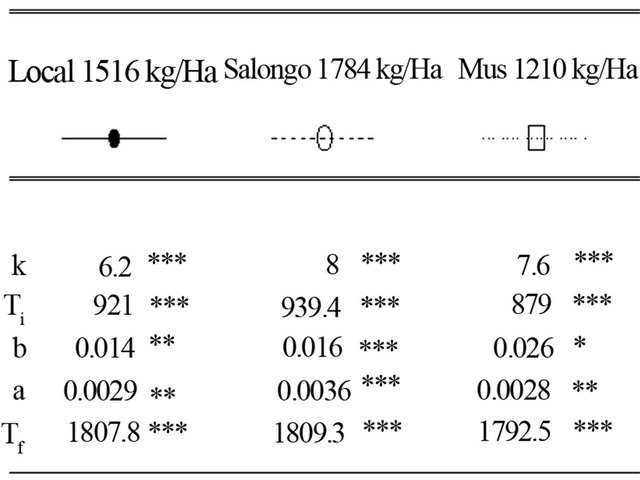
Figure 5. Simulation of leaf area index of three maize varieties with respect to thermal time, in farmer’s fields at site 1 (INERA), in Gandajika, DR-Congo.

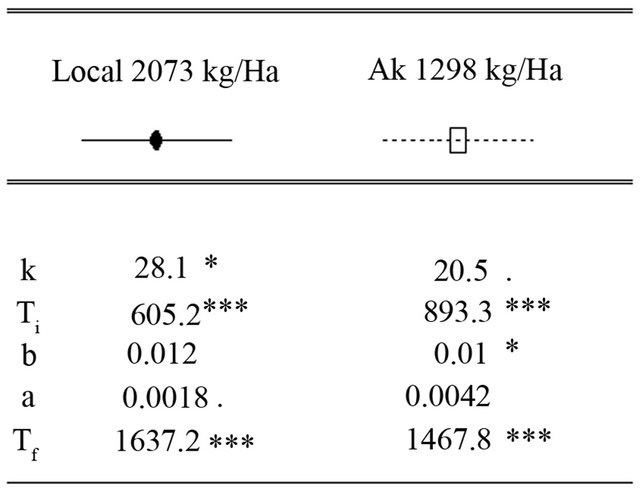
Figure 6. Simulation of leaf area index (LAI) of two maize varieties in relation to thermal time, in farmer’s fields at site 2 (Mpiana), in Gandajika, DR-Congo.
variety and is poorly simulated for the variety AK. Parameters (Ti) and (Tf) are well simulated for all varieties. To complete the growth cycle, the local variety has an accumulated thermal time of 1637.2˚C·J while the AK variety requires 1467.8˚C·J (Figure 6).
3.2.3. Site 3 (Mpasu)
At this site 3, the maximum leaf area index (K) and the harvested grain yield were estimated at 8.8 and 1885 Kg/ha, 2.8 and 1328 kg/ha, and 11 and 1559 kg/ha for local, Salongo 2, and AK varieties, respectively (Figure 7). However, the simulation is low for Salongo 2 while the variety AK did not show a good simulation for (K), (a) and (b) parameters. The simulation of (a) and (b) parameters is low for Salongo 2 and the Local varieties. (Ti) and (Tf) parameters are simulated for all varieties. To complete the growth cycle, the model estimated a thermal time accumulated of 1812.6˚C·J for the local variety, 1782.2˚C·J for Salongo 2, and 1480.7˚C·J for the AK variety (Figure 7).
4. Discussion
The objective of the present study was to develop and evaluate an approach for simulating LAI in maize that recognizes key physiological and phenological processes using a minimum input requirement. Key assumptions
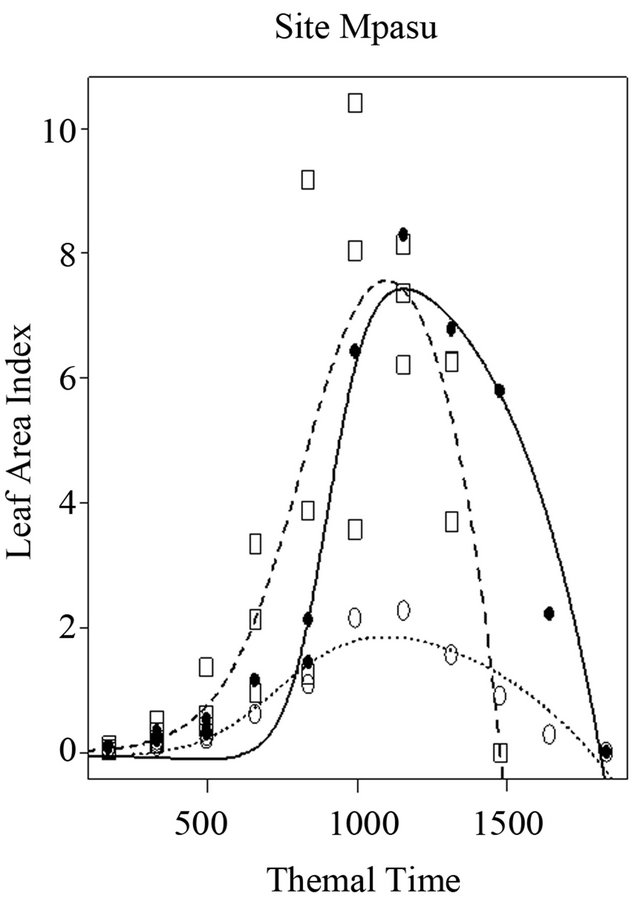

Figure 7. Simulation of leaf area index of three maize varieties with respect to thermal time conditions, infarmer’s fields at Site 3 (Mpasu) in Gandajika, DR-Congo.
included the dominant autotrophic nature of leaf growth and the response of cell division and expansion to temperature and water deficit. A non-source-driven leaf area simulation was chosen in this study because the source limitation was minimized by managing maize near optimum conditions. An important goal of this effort was to develop a model for practical application, one with reduced complexity and less cultivar specific parameters.
There were measurable variations among sites and varieties for the simulated height of maize plants. They are indeed significant variationsin plant height, number, size and orientation in tropical maize varieties. Sites 1 (INERA) and 3 (Mpasu) simulated a reduced height for all the varieties. This can be ascribed to the lack of nitrogen element in soil from these sites. Whereas the simulated and expected height for Site 2 (Mpiana) is closer to observed values for all the varieties tested (2.053 m for the local variety and 1.616 m for AK). At this site, plants grow faster and half of the maximum height is reached 47.8 days after sowing for the Local variety and 52.3 DAS for the AK variety.
At all sites, the varieties with short plants were associated with expected superior performance based on simulation data. This is consistent with Johnson et al. [30] who reported that a reduction in plant height that was also associated with an increase in performance.
The leaf area index is a factor that plays an important role in plant production for both quantitative and qualitative traits [31]. It was noted that K, Ti, b, a, and Tm values vary with the simulation model, the maize variety and the field trial location used in the study. In all cases, the model underestimates the LAI based on observed values. CERES-Maize and STICS models also under estimate LAI in some studies. Despite this underestimation of leaf area index, dry matter production can be largely overestimated due to errors in the choice of input varieties.
In farmers’ fields, the LAI for the genetically improveedmaize varieties (Salongo 2, MUS and AK) were greater than those of the unimproved local variety (Local). Lufuluabo et al. [32] made similar observation in experimental plots in rural areas in Gandajika. Likewise, Nyanguila [33] in Kaniama (Province of Katanga), a different savannah region of the DR-Congo also reported similar findings.
Affholder et al. [22] statedthat LAI is low for a significant part of the cycle because of the low seedling density or other stressors based on several observations in tropical conditions. This appears to be the case in Site 3 (Mpasu) in the present study where Salongo 2 variety exhibited an estimated maximum leaf area index (K) of 2.8 with a very low density of 1.6 plants/m2. Also, low leaf area indices at Sites 1 (INERA) and 3 (Mpasu) are mostly attributed to nitrogen stress, given the low soil nitrogen content in these sites.
The results of the present study show that in all sites and for all varieties, the growth rate (b) is higher, while the rate of senescence (a) is lower compared to STICS estimates. This is in part caused by rainfalls throughout the crop cycle until harvest and also by other growing conditions.
The thermal time required for MUS and Salongo 2 is greater than 1657˚C·J estimated by STIC. The values are also higher than 1429˚C·J and 1334˚C·J estimated by Lufuluabo et al. [32] for Salongo 2 and MUS varieties, respectively. In Zambia, the thermal time required for the maize plant growth and the development have been reported to be 1500˚C·J and 1600˚C·J for early maturing cultivars; 1600˚C·J and 1700˚C·J for maturing cultivars, and on average1800˚C·J for late maturing cultivars [34].
Current trend in crop modeling has been to adapt existing models to local conditions. In the present study, equations for predicting both leaf area and leaf sensecence for selected maize varieties grown in a savannah region of the DR-Congo have been tested and adapted. In fact, Affholder et al., [22] discussed the usefulness and the relevance of Ad Hoc modeling in agronomy. They highlighted the two main issues in crop modeling that are, how to define the structure of the model as depending on the question to be addressed (model conceptualization) and how to minimize efforts in software development (model computerization) [22]. Based on the literature review discussed by these authors, the approach that consists in integrating crop models and databases is an efficient alternative for scientists who wish to keep the fullest understanding and control on their crop models [22].
5. Conclusions
In the present study, maize plant growth and development varied from site to site. Overall, maize growth in farmers’ fields was slow due to low soil nitrogen content and other poor conditions of oxisol in the maize growing areas.
Genetically improved varieties have a tendency of simulating a larger leaf area index compared to the local variety. Differences in parameters such as the maximum leaf area index (k), the growth rate (b) and the rate of senescence (a) can be explained by varietal differences, field and/or environmental conditions. The significant differences between the simulated and the observed leaf area index can be attributed to the effects of growing constraints that were not considered in the equations.
Based on the results of the present study and other reports, maize breeders should aims at developing high yielding varieties that are short and adapted to local growing conditions.
6. Acknowledgements
This research was conducted through a partnership between Laurentian University (Ontario, Canada), University of Kinshasa (DR-Congo), and Caritas Congo. The authors are grateful to the Canadian International Development agency (CIDA) for financial support.
NOTES