A Graph-Theoretical Approach to Calculate Vibrational Energies of Atomic and Subatomic Systems ()
1. Introduction
Among the most important achievements generally recognized to string theory is its potential capability to predict the masses of elementary particles, specifically of the 12 particles that make up the three families of the standard model [1]. The process, however, require very complex mathematical calculations which are still far from complete.
There is a well known precedent in particle physics to the study of interactions between particles, which are the Feynman diagrams [2].

Figure 1. Feynman diagram for electron-positron annihilation. e: electron (–) or positron (+) q: quark γ = gamma emission.
Figure 1 shows the Feynman diagram for electron-positron annihilation.
It is interesting that, although representing a spacetime event, Feynman diagrams are ultimately graphs. A graph is a set of points called vertices (or nodes) connected by lines called edges. The studies of graphs constitute a discipline known as graph theory. It was L. Euler (1707- 1783) the one who introduced the notion of graph [3], which was developed later on by A. Cayley [4] and J. J. Sylvester [5] along the nineteenth century. In the 20th century, graph theory became an essential tool in different areas of science and technology where connectivity plays a role. Think, for instance, of the optimization of communication and transport networks [6], the design of electrical circuits (e.g. in computers) [7], the synchronization of interacting oscillators with different topologies [8], the analysis of social networks [9], among others.
Although graphs in general are also widely employed in theoretical physics, however graph-theoretical indices are rarely used [10]. Our goal here is just using graphtheoretical indices to predict the masses of the elementary particles referred above as well as of other physical systems such as molecular vibrational energy.
2. Assignation of Graphs to Some Vibratory Physical Systems. Theoretical Framework
Starting by the elementary particles, we must remind the origin of the Feynman diagrams. It is well known that the interactions between particles are expressed as an integral, which is typically too difficult to do, so that Feynman developed a perturbation theory which was based upon an expansion in terms of graphs. The type of such graphs depends on the interactions.
A similar approach can be also found in the so called force-based algorithms [11], in which the entire graph is then simulated as if it were a physical system, for example an elementary particle. Moreover, the use of graphs and matrices to study the interactions between elementary particles, for example quarks, has been also carried out by other authors [12].
On string theory, the way to explain that an elementary particle, say an electron, has a given mass is based on the different modes of vibration of the strings. Indeed, in the perturbative approach to string theory, the strings interact by joining and splitting [13].
Each vibrational mode has an associated energy according to Einstein’s equation:
 (1)
(1)
This energy is transformed into the elementary particle mass. In this sense we can say that elementary particles are made of strings.
In the perturbative string theory, the influence of each incoming string results from adding together the influences of graphs with ever more loops.
The algorithm proposed here is similar, i.e. assigning each perturbative term to each one of the particles so that each graph simply adds a loop over the next particle with increasing mass; in other words we propose assigning one-to-one the perturbative terms to the particles.
The process of assigning individual graphs to each elementary particle proposed here is done as follows: First, the elementary particles are sorted in increasing order of mass ranging from the electron-neutrino (<10–8) up to top-quark (189), both in GeVs. Table 1 reflects the values, in increasing order of energies, for these particles. On the first column is the allocation of families for every one of the particles. A data taken from reference [13].

Table 1. Elementary particles, according to the standard model, ordered in increasing values of energy. F1, F2 and F3 represent the three families in which they are classified.
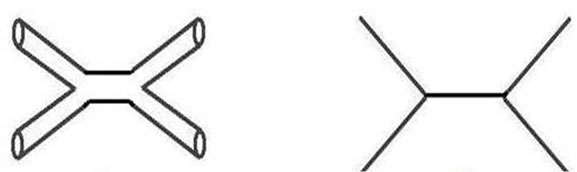
For the first particle, namely electron-neutrino, we assign a simple graph that is equivalent to the interaction electron-positron described before.
 (a) (b)
Figure 2. Allocation graph to electron-neutrino. Left (a) Feynman-like graph for the springs interaction and right; (b) corresponding simple graph.
Figure 2 illustrates the Feynman-like 3D diagram associated to the strings interaction, i.e. the string/antistring pair, together with the simple (no loops) graph assigned to it:
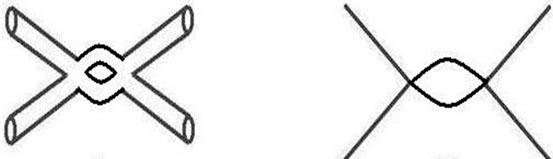
The following larger energy particles are represented by pseudographs which take into account different topologies with 1, 2, 3, ...11 holes. For example, for the muon-neutrino, the second lowest energy particle, we would have the following equivalence between the strings’ interaction and the graph (Figure 3):
 (a) (b)
Figure 3. Allocation of graph to muon-neutrino, the second particle with lower mass. To the left (a) Feynman graph and on the right (b) corresponding pseudograph.
In this case, the two strings interact creating a hole whose graph theoretical equivalent is the one-loop graph on the right (B) of Figure 3. In short, the two diagrams in Figure 3 correspond to the Feynman representations for string (A) and quantum field theory (B) [14]. The advantage of this approach is that there is just one diagram for each order of perturbation and that each diagram avoid the drawback of short-distance infinities, i.e. contrary to quantum field theory, the graphs in Figures 2(a) and 3(a) have not singularities (nodes). It is also curious that the topological pattern that we meet here is the same as the one of harmonic vibrations of a macroscopic string (such as a violin string), in which each frequency of the overtones (n = 2, 3, 4…) is an integer multiple of the first one (n = 1, fundamental), as shown in Figure 4.

Figure 4. Simple modes of vibration of a string. The harmonic frequencies shown are multiples of the first one (fundamental vibration).
Note that the graph-theoretical equivalent of each mode of vibration would be graphs with a progressive increase in the number of loops.