1. Introduction
The technological applications of chalcogenide glasses are widespread and, therefore, the study of these materials is a matter of great interest. The most important application of these glasses is in switching action which in commonly known as Ovonic switch. In 1968, Ovshinisky and his team discovered memory and switching effects exhibited by some chalcogenide glasses [1]. The memory devices produced by amorphous semiconductors have great advantage of cheap preparation, unclean radiation resistant and moderate purity of raw material over same devices produced by crystalline semiconductors [2]. Phase change from amorphous to crystalline (a-c p) recording is promising technique for optical memory devices. This technique is more advantageous due to higher transfer rates, faster access time, improved endurance which ultimately provide higher standard of audio video respecttively [3-14]. The process of optical recording is based on the simple phenomenon. The underlying concept is that some physical property of recording layer of the disc surface is changed. Microscopic spots of crystalline material on the disc surface are melted on exposure to short laser pulse for recording and recorded marks are erased by changing the amorphous spots back to crystal-line form. For this purpose material is brought through annealing process with the help of long laser pulses. Long laser pulses are required to heat the material and to bring a-c phase change. That is why the study of a-c phase transformation is the matter of great interest. This study will help in developing the new Chalcogenide materials with enhanced qualities to make them suitable for optical recording materials.
In the present paper, different atomic percentages of In is added to Se80Te20 binary system to overcome certain problems in binary Se80Te20 glassy alloy like low glass transition temperature Tg and crystallization temperature Tc and limited reversibility [15]. Ternary alloys are better from the point of view of device preparation and its application [16-18]. It is expected that addition of In can modify the optical properties of binary Se80Te20 alloy [18]. This has been explained in terms of mean atomic mass of the alloy.
In addition to above mentioned applications, study of crystallization kinetics is important for the manufacturing of glass ceramics and in pervading devitrification. Differential scanning calorimetry (DSC) is valuable technique for the quantitative study of crystallization in different glassy systems and has been widely used [19-24]. In crystallization kinetics, different models of independent treatments for non-isothermal crystallization have been suggested. Most of these treatments are based on the following relation:
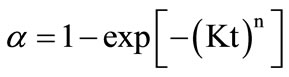 (1)
(1)
where, α is extent of crystallization and K is rate constant which is thermally activated [25-27].
In all non-isothermal methods one assumes a constant heating rate β that is T = To + βt where To is the initial temperature. The best description of these methods is an iso-conversion method. The goal of all these methods is to identify two parameters which when plotted one against the other will result in a straight line. From the slope of such line, the overall effective activation energy Ec or the order of reaction n is calculated [28,29].
In the present paper, the study of the crystallization kinetics is made in glassy Se80-xTe20Inx (x = 5, 10, 15, 20) at different heating rates (5, 10, 15, 20, 25 K/min) and activation energy of crystallization (Ec) is calculated by non-isothermal and iso-conversional methods. Five different methods, i.e., Kissinger-Akahira-Sunose [KAS], Friedman, Flynn-wall-Ozawa [FWO], Friedman-Ozawa [FO] and Starink are used to evaluate the value of Ec at different values of α. The dependence of Ec on atomic percentage of In in glassy Se80-xTe20Inx (x = 5, 10, 15, 20) is also discussed.
2. Experimental Details
Various samples of Se80-xTe20Inx glassy system (x = 5, 10, 15, 20) are prepared in bulk form by conventional melt quenching technique. High purity (99.999%) Se, Te and In in appropriate atomic weight proportions are placed in a quartz ampoule and sealed under a vacuum of 10–5 Torr. The ampoules are then heated at 800˚C for about 10 h with continuous rotation to facilitate homogenization of the sample. The molten samples are rapidly quenched in ice cooled water to obtain glassy state. X-ray diffraction pattern (XRD) of the samples confirmed the glassy nature of the material.
The samples so obtained were ground to powder form for carrying out DSC measurements. Five heating rates 5, 10, 15, 20 and 25 K/min. were selected for these measurements. About 10 - 15 mg powder was heated at constant heating rate and the changes in heat flow with reference to empty reference were measured. The presence of well defined endothermic peak at the glass transition temperature and an exothermic peak at the crystallization temperature is observed in each DSC scan. The studies were made under almost identical conditions so that the activation energy of crystallization (Ec) could be compared with other compositions. The Tc was taken as the temperature corresponding to the exothermic peak in DSC scan. The extent of crystallization (α) at any temperature (T) is calculated as α = AT/A, where A is the total area of the exotherm and AT is the area of the exotherm between onset of crystallization temperature and T [30].
3. Theoretical Basis
To evaluate the activation energy of crystallization Ec from Non Isothermal experiments, two types of analysis methods are adopted iso-conversional methods and peak methods. Iso-conversional methods are also of two types. One set of methods relies on approximating the temperature integral. This set mainly includes Kissinger method [31], Kissinger-Akahira-Sunose (KAS) method [32,33,34] and the Flynn-Wall-Ozawa (FWO) method [35,36]. While another set of methods does not use any mathematical approximation but uses a determination of the reaction rate at an equivalent stage of the reaction at different heating rates such as Friedman Ozawa (FO) method [37]. For various heating rates β, the Friedman method [38] can directly be used at a specific crystallization fraction α. To study the accuracy of known isoconversional methods Starink [39] reported that the most accurate methods are KAS method and the methods developed by the author [39,40]. However the most reliable iso-conversional methods as reported by Ozawa [40] are FWO, KAS and Friedman Ozawa (FO) methods.
3.1. Kissinger-Akahira-Sunose (KAS) Method
All of the iso-conversion methods require the determination of the temperature Tai at which a fixed fraction a of the total amount is transformed. In the KAS method, the relation between the temperature Tai and the heating rate b is given by
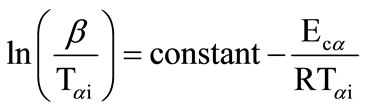 (1)
(1)
Plots of  vs. 1000/Tαi are plotted and activation energy Eca is calculated from the slopes of these plots.
3.2. Friedman-Ozawa (FO) Method
Friedman proposed this method for nth order reaction in 1964. Later Ozawa found that it is applicable to other solid-solid transformation processes. According to Friedman-Ozawa method a linear relationship of ln(β·dα/dT) vs. 1000/T exists with slope proportional to Ec which can be calculated from different temperature data for fixed value of fraction transformed α by the following relation:
 (2)
(2)
3.3. Friedman Method
For various heating rates β, the Friedman method can be used at specific crystallization fraction α as
 (3)
(3)
The parameter Ecα at this specific value of α, is then calculated from a plot of ln(dα/dT)αi vs. 1000/Tαi across different heating rates. The process is repeated for different values of α.
3.4. Flynn-Wall-Ozawa (FWO) Method
The Flynn-Wall-Ozawa (FWO) method has been developed for non-isothermal analysis of crystallization in which final reaction is as follows
 (4)
(4)
By plotting lnβ vs. 1000/Tα for the chosens value of α, activation energy Ec is determined.
3.5. Starink Method
The KAS and FWO methods can be expressed in general form, i.e.,
 . (5)
. (5)
where Tf is the temperature at which a fixed fraction α of the total amount is transferred.
In the method proposed by Starink A = 1.0008 and s = 1.92, i.e.
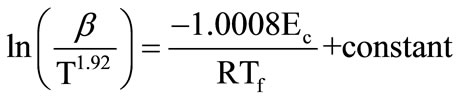 (6)
(6)
4. Results and Discussion
Typical thermo grams obtained by DSC of glassy Se80-xTe20Inx (x = 5, 10, 15, 20) at heating rate of 5 K/min are given in Figure 1 Similar DSC thermo grams were obtained at other heating rates (10, 15, 20, 25 K/min.) also. It is clear from these thermo grams that well defined endothermic and exothermic peaks are obtained at glasstransition temperature (Tg) and crystallization temperature (Tc).
4.1. Heating Rate Dependence of Crystallization Temperature
Crystallization temperatures of glassy Se80-xTe20Inx (x = 5, 10, 15, 20) at different heating rates are calculated from typical thermograms obtained from DSC. These are given in Table 1.
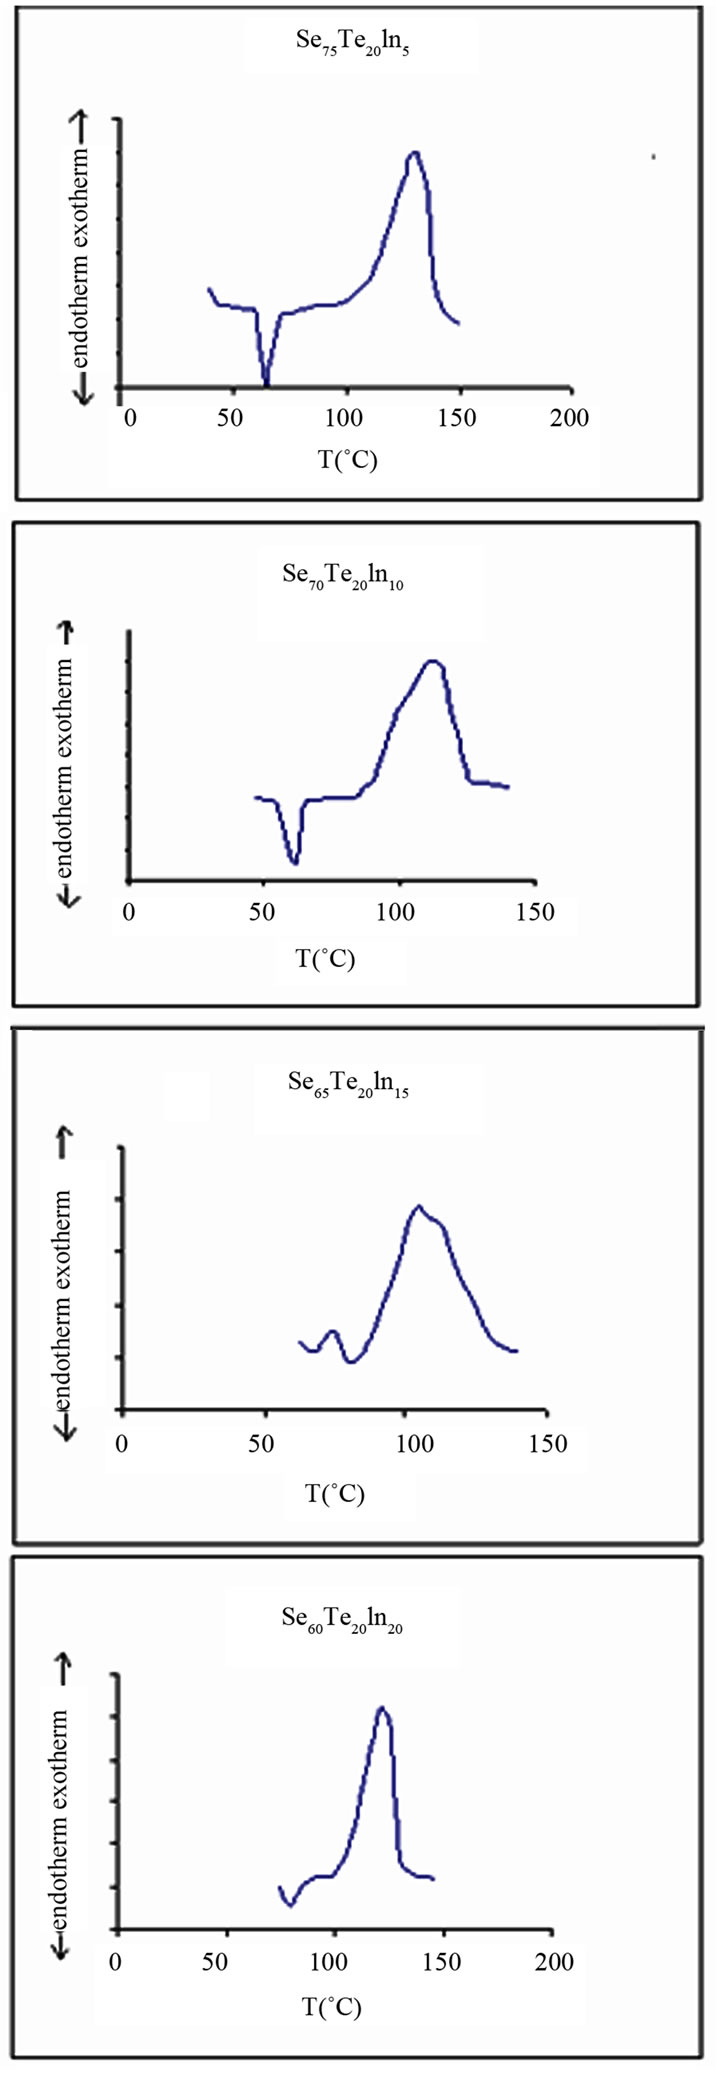
Figure 1. DSC thermograms for Se80-xTe20Inx (x = 5, 10, 15, 20) at 5 K/min.

Table 1. Heating rate dependence of crystallization temperature Tc (K).
For a particular sample, Tc increases with the increase in heating rate. It is also clear from this table that all crystallization temperatures are much higher than room temperature which prevents them from self transition from amorphous to crystalline phase. This characteristic of these materials make them useful as PC-optical recording materials.
4.2. Calculation of Activation Energy of Crystallization
Activation energy of crystallization plays a vital role in proving Chalcogenide as a basic material in various applications. Lot of research work has been done on activation energy of crystallization Ec. In the present work we have calculated Ec by using five non-isothermal and Isoconversional methods i.e., Kissinger-Akahira-Sunose (KAS), Friedman, Flynn-Wall-Ozawa (FWO), Friedman
-Ozawa (FO) and Starink methods to study the transformation process (amorphous to crystalline). To do this best fits obtained by FWO and FO methods are given in Figure 2.
Similar linear plots are obtained by KAS, Friedman and STARINK methods which are given in Figure 3.
By calculating the slopes of above linear fits, activation energy Ec is calculated at different extent of crystallization. The activation energy so obtained is given in Tables 2-5 at different values of α. Activation energy is plotted against α for each glassy alloy and plots are shown in Figure 4.
It is clear from the above figure that activation energy of crystallization Ec varies with the extent of crystallization. It is also evident from the above figure that activation energy obtained by FO method is relatively larger as compared to other methods. This disagreement is due to approximation involved in the method developed by Friedman-Ozawa. Variation of activation energy is also examined with atomic percentage of In incorporation at a particular value of α. The values of activation energy at different atomic percentage of In incorporation at α = 0.5 is given in Table 6 and values are plotted in Figure 5.
It is clear from the above figure that Ec increases with increase in atomic percentage of In in ternary Se80-x Te20Inx alloys up to 10 at %. Such an increase in Ec with increasing percentage of In concentration may be analyzed by considering the atomic weights of Se and In as Te content in each alloy is kept constant. It is known that

Figure 2. Linear plots in case of FWO, FO methods at α = 0.7.

Figure 3. Linear plots in case of KAS, Friedman & STARINK methods at α = 0.7.

Table 2. Activation energy Ec (eV) for Se75Te20In5 at different α.

Table 3. Activation energy Ec (eV) for Se60Te20In10 at different α.

Table 4. Activation energy Ec (eV) for Se65Te20In15 at different α.

Table 5. Activation energy Ec (eV) for Se60Te20In20 at different α.

Table 6. Values of activation energy of crystallization at different at % of In at α = 0.5.
activation energy of crystallization is guided by nucleation and growth process, which prevents the Chalcogenide glasses from devitrification [41,42]. The atomic weight of In is 114.8 gm/mol and that of Se is 79.0 gm/mol. Since the atomic weight of In is more than Se, the mean atomic weight of Se80-xTe20Inx alloy increases on increasing the In at the cost of Se. This increase in atomic wt. lowers the nucleation & growth rate and hence increases the activation energy In the present glassy alloys, composition dependence of Ec also shows a trend reversal at x = 15 where it shows

Figure 4. Variation of activation energy Ec with extent of crystallization.

Figure 5. Composition dependence of activation energy of crystallization at α = 0.5.
a minima. Similar kind of discontinuity is reported in various physical parameters [42-44] in Chalcogenide glasses when average co-ordination number
reaches 2.4. This is explained by Phillips and Thorpe in terms of mechanically optimized structure at critical glass composition [45]. The co-ordination number of Se and Te is 2 and that of In is 3 hence in glassy Se
65Te
20In
15, average co-ordination number comes out to be
= 2.15. This value of
is lesser than 2.4. This may be due to an important limitation of Phillips & Thorpe model [45].
Phillips considered that the interaction between atoms is purely covalent while reaching at the balanced condition. In present glasses, addition of In is expected to change the character of some of the Se-Se homo-polar bonds. The In-Se bonds are created as a result of breaking up of Se8 rings which are polar in nature and in turn disturb the covalent Se-Se bonds to some extent Thus this alteration in the bond character is responsible for the reversal trend found in ternary Se80-xTe20Inx alloy at 15 at percentage of In.
5. Conclusion
The study of crystallization kinetics is done in glassy Se80-xTe20Inx (x = 5, 10, 15, 20). DSC scans are recorded at different heating rates (5, 10, 15, 20 K/min). Crystallization temperature is found to increase with increase in heating rates. Activation energy Ec of a-c phase change is recorded by employing five non-isothermal iso-conversional methods, i.e., KAS, Friedman, FWO (Flynn-WallOzawa) FO (Friedmann-Ozawa) & Starink. Activation energy Ec is found to vary with the extent of crystallization α and also with atomic percentage of In. Ec varies on varying the extent of crystallization. Ec increases on increasing the atomic percentage of In except at x = 15 in Se80-xTe20Inx, where it shows minima. This reversal trend at x = 15 in Se80-xTe20Inx is explained in terms of lattice dissociation due to breaking up of Se8 rings to polymeric chains and due to change of nature of bonds which brings the reversal at much lower value of average co-ordination number.
NOTES