1. Introduction
Though a large number of ferroelectric oxides of different structural families (i.e., perovskite, tungsten-bronze, spinel, etc.) are now available, some compounds of perovskite and tungsten-bronze (TB) families [1-3] in pure and/or complex form, such as BaTiO3, LiNbO3, PbTiO3, Pb(ZrTi)O3, barium sodium niobate, potassium lanthanum niobate etc., have been found to be important because of their various physical properties suitable for device applications. Many ferroelectric compounds with tungsten-bronze structure have been widely investigated and found application particularly in devices such as transducers, actuators, capacitors, and nonvolatile ferroelectric random access memory because of their interesting ferroelectric, pyroelectric, piezoelectric, and nonlinear optic properties [4-8]. The tungsten-bronze structure consists of a complex array of distorted BO6 octahedra sharing corners in such a way that three different types of interstices (A, B and C) are available for cation occupying in the general formula (A1)2(A2)4(C)4(B1)2(B2)8O30. Generally, the smallest interstice C is empty, so the general formula is A6B10O30 for the filled tungsten-bronze structure. Nowadays, the research of lead-free electroceramics and their applications are extremely important as a result of implementing the strategy for the sustainable development of the world, and strengthening to the consciousness of environmental protection. Detailed literature survey shows that though a lot of work has been done on TB structured compounds [9-14]. In view of the importance of the eco-friendly (lead-free) materials of the above family, we have recently carried out the systematic structural and electrical studies of the Ba5GdTi3V7O30 compound.
2. Experimental Procedure
Polycrystalline sample of Ba5GdTi3V7O30 (BGTV) was prepared using high temperature solid-state reaction techniques. The stoichiometric mixtures of the high purity (99.9%) powders of BaCO3 (M/s Sarabhai M. Chemicals Pvt. Ltd., India), SrCO3 (M/s Sarabhai M. Chemicals Pvt. Ltd., India), TiO2 (M/s Sarabhai M. Chemicals Pvt. Ltd., India), Sm2O3 (M/s Sarabhai M. Chemicals Pvt. Ltd., India), and V2O5 (M/s. Koch Light Ltd., England) were weighed and thoroughly ground in an agate mortar to obtain homogeneous mixtures and calcined at 950˚C for 12 hrs. The calcined powders were grounded and dried, followed by mixing with organic binder polyvinyl alcohol (PVA) to prepare cylindrical pellets of 10 mm diameter and 1 - 2 mm thickness at the pressure of 4 × 10⁶ N/m2. The pellets were sintered in air at 1000˚C for 12 h to yield dense ceramics. The binder was burnt out during high temperature sintering. The formation and quality of the compound was checked by an X-ray diffraction (XRD) technique. The X-ray diffraction pattern of the compounds was recorded at room temperature using an X-ray powder diffractometer (Rigaku, Miniflex) with CuKα radiation (λ = 1.5405 Å) in a wide range of Bragg’s angles 2θ (20˚ ≤ 2θ ≤ 80˚) with a scanning rate of 3˚/minute. To study the surface morphology of the sintered pellets, both the surfaces were made flat and parallel. On the flat and clean surface gold coating was done by a sputtering method to increase the resolution of micrograph. Microstructures of sintered pellets were recorded by JEOL-JSM: 5800 model scanning electron microscope (SEM). The average grain size was determined by a linear intercept method. The electrical properties of the sintered pellets were studied with the data recorded by an impedance analyzer (HIOKI LCR Hi tester LCR meter (Model: 3532)) over a wide frequency range (102 - 106 Hz) at different temperatures (31˚C - 500˚C). The hysteresis loops (P-E Loop) of the poled samples (6 kV/cm for 24 hours in the silicon oil) were obtained at room temperature using precision material analyzer (M/S. Radiant Technologies Inc., NM and USA) integrated with 4 kV voltage amplifiers.
3. Results and Discussion
3.1. Structural and Microstructural Studies
The room temperature XRD pattern (Figure 1) of the calcined powder, which is different from those of the ingredients (JCPDS file nos. 22-1141, 02-0364 and 75- 0457), shows the formation of a single phase new compound. All the reflection peaks of the pattern are indexed in tetragonal or orthorhombic crystal system and in different cell configurations using software “POWD” [15].
Since TB compounds have tetragonal or orthorhombic crystal structure out of which an orthorhombic unit cell was selected on the basis of the best agreement between observed and calculated interplaner spacing d (i.e., ΣΔd = dobs − dcal = minimum). Then the selected lattice parameters are refined using the least-squares method, which are found to be a = 4.3691 (7) Å, b = 18.8181 (7) Å, c = 13.5254 (7) Å and volume V = 1112.05 Å3 for the compound (the number in parenthesis is estimated standard deviation of lattice parameters).
The unit cell parameters are consistent, and are in good agreement, with those reported earlier [9,16,17] for TB structural family. Unfortunately, it is not possible to determine the space group of the compound with the limited powder data. The crystallite size (P) of BDTV was roughly estimated from the broadening of a few XRD peaks (in wide 2θ range) using the Scherrer’s equation [18]: P = Kλ/(β1/2 cos θhkl) (where K = constant = 0.89, λ = 1.5405 Å and β1/2 = peak width of the reflection at half intensity). The average value of P was found to be 12 nm. The effects of strain, instrument and other defects on broadening are ignored in the calculation.
The SEM micrograph of the compounds with different magnifications at room temperature is shown in Figure 1 (inset). It is found that the grains are inhomogeneously and uniformly distributed over the entire surface of samples. The grain size evaluated from histogram is found to be in the range of 1.6 µm. A similar type of microstructure was found in many materials of this family [16,17].
3.2. Dielectric Study
Temperature dependence of dielectric constant (εr) for BGTV is shown in Figure 2(a). The value of relative dielectric constant (εr) initially increases with increase in
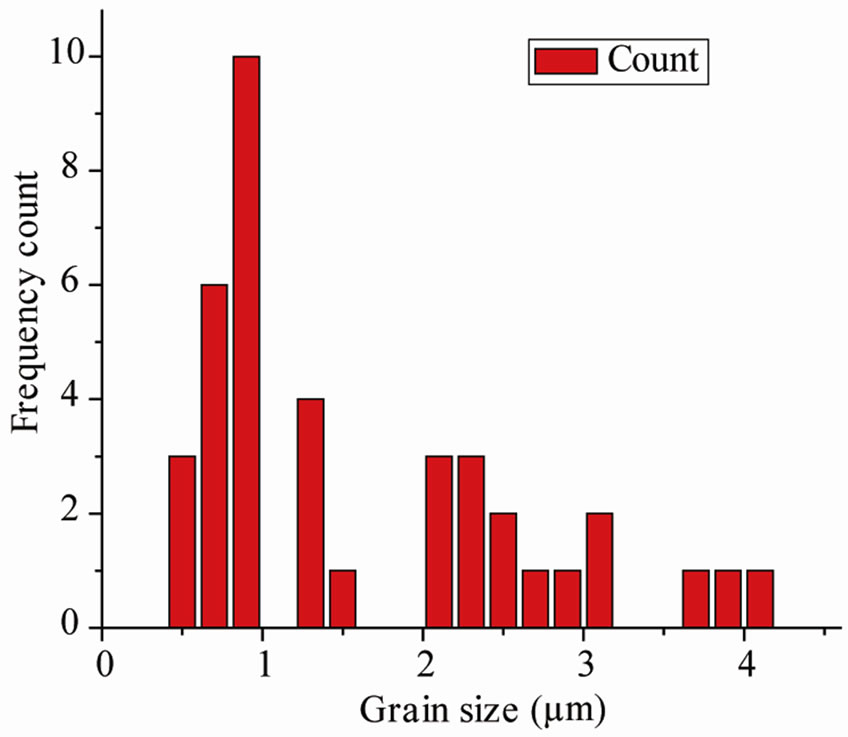
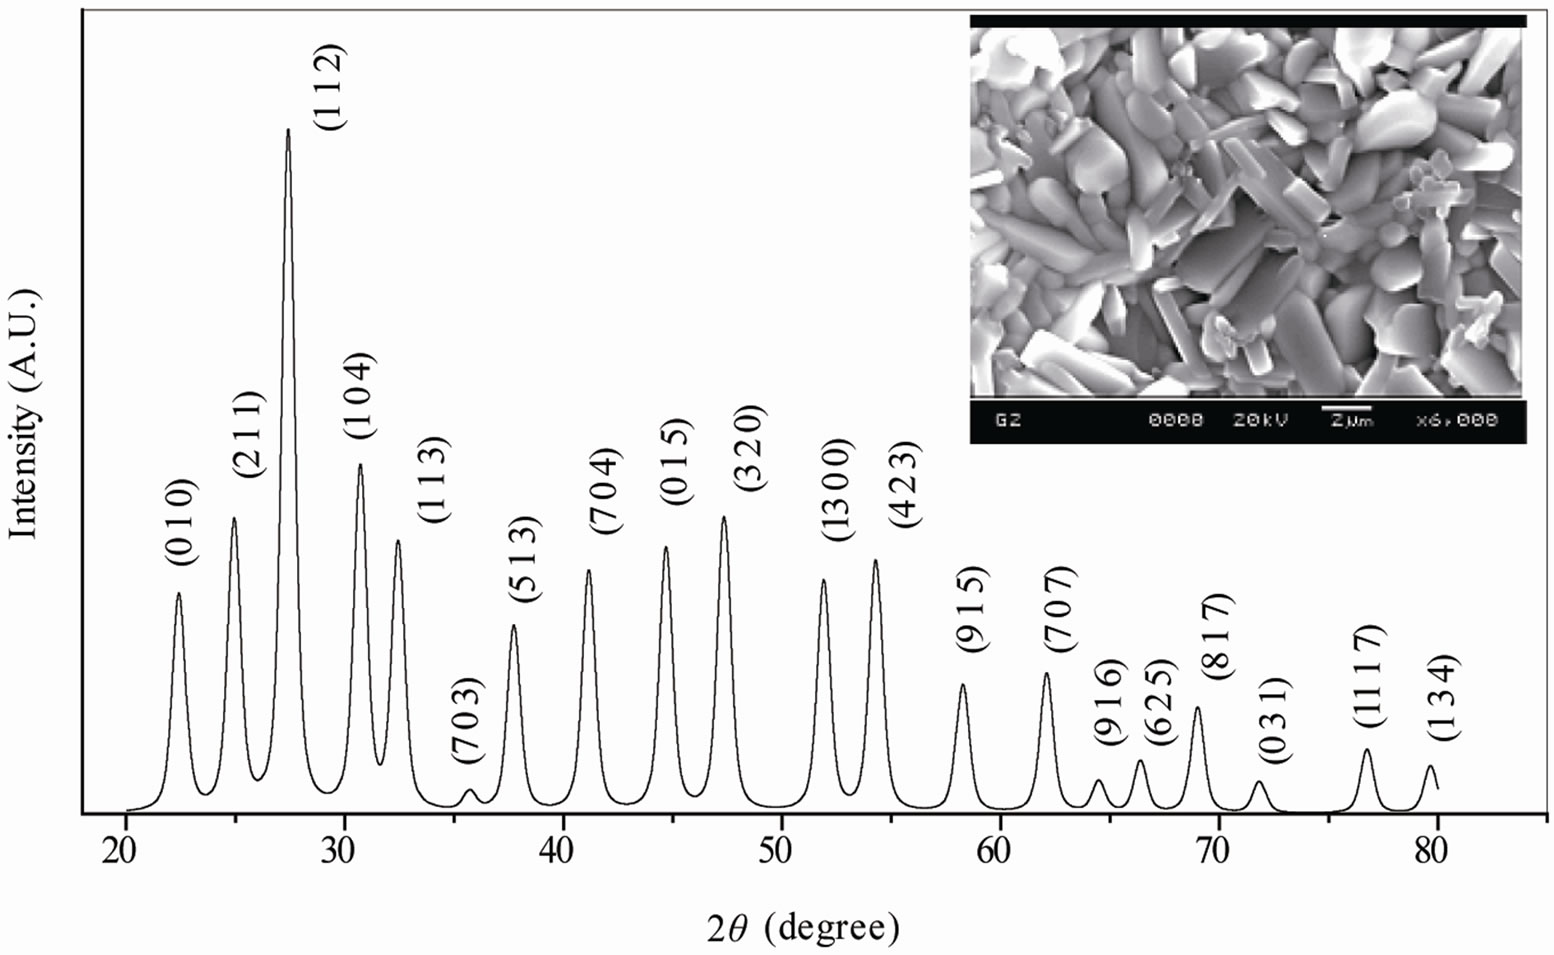
Figure 1. Room temperature XRD and SEM micrograph (inset) and histograms (right) showing the grain size distribution of Ba5GdTi3V7O30.
 (a)
(a) (b)
(b)
Figure 2. (a) Temperature variation of relative dielectric constant (εr), loss tangent (tanδ) (inset) at 5 - 500 kHz and (b) diffusivity graph of Ba5GdTi3V7O30.
temperature, reaches to a maximum (peak) value at transition temperature (Tc ~386˚C), and then decreases and on farther increasing the temperature, the εr value increases. In our previous study using the same material, no expected dielectric anomaly was observed within the measured temperature range (30˚C - 500˚C) when Sm was doped in place of Gd, where as for Dy doped compound the transition temperature was ~430˚C [19,20]. Also it is observed that the values of tanδ (Figure 2(a) (inset)) increase with increase in temperature which may be due to space charge polarization. The low value of tanδ represents the good quality of ferroelectric material under observation. At low temperature the change in the values of tanδ of the compound is found considerably small. It then increases significantly at high temperatures. This may be due to enhanced conductivity in this compound, and also the reduction in ferroelectric domain wall’s contribution at high temperatures (paraelectric phase) [15, 16]. Ferroelectric-paraelectric phase transition was confirmed by appearance of hysteresis loops (as shown in the later section).
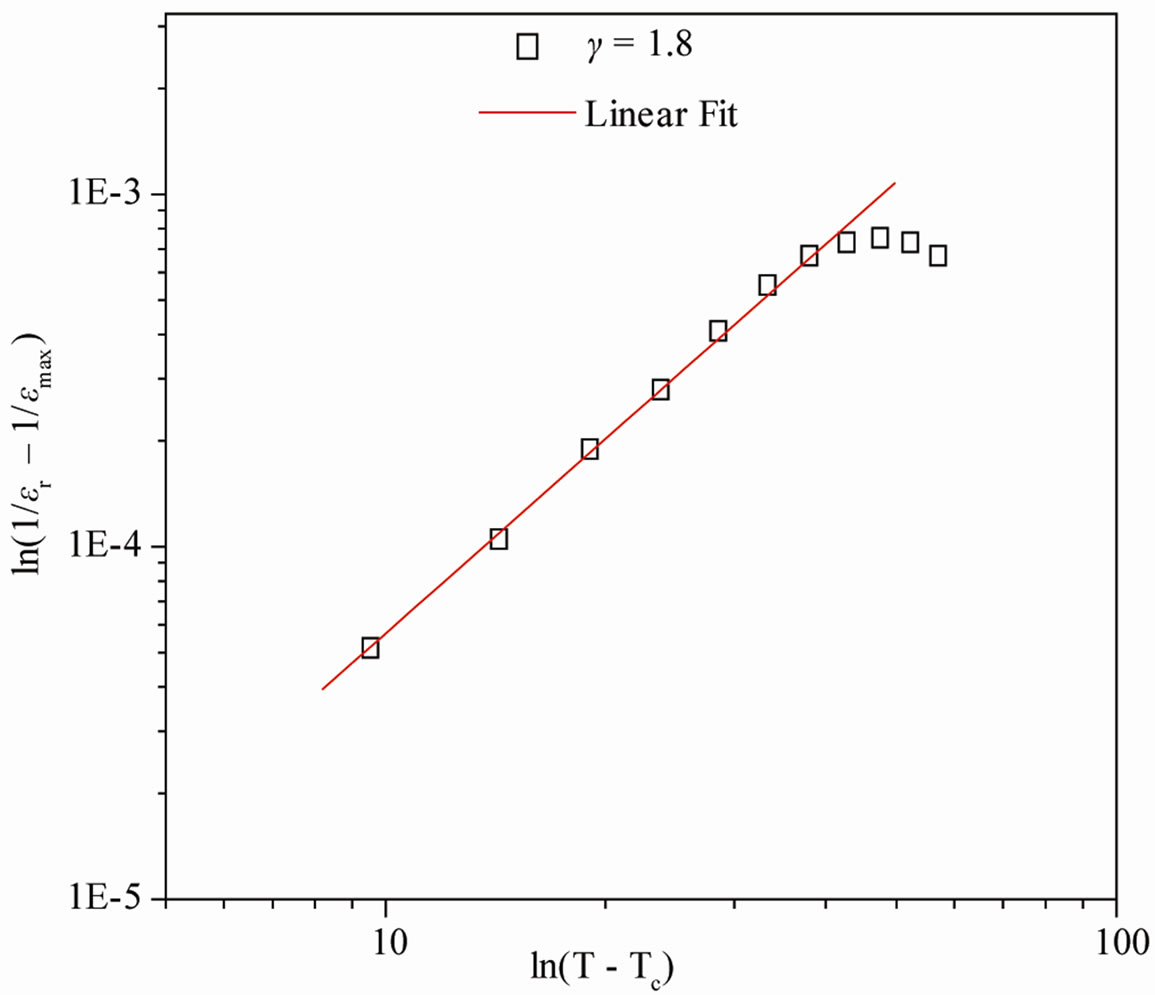
The broadening of dielectric peak indicates the existence of diffuse phase transition. The degree of disorder or diffusivity (γ) of the compound is estimated by an empirical relation; ln(1/εr – 1/εmax) = γln (T – TC) + lnK where T is the temperature and K is a constant. The value of γ at different frequency, calculated from the slope, is given in Figure 3. Generally, the value of γ is between 1 (for normal ferroelectrics) and 2 (for completely disordered system). The above value of γ (1 ≤ γ ≤ 2) shows a deviation from normal ferroelectric behavior, which indicates the occurrence of disordering in the system [17]. Kenzig [21,22] showed that when the paraelectric phase of BaTiO3 transform to the ferroelectric macro domain phase, small domains of about 100 Ǻ are formed in a temperature range of about 1˚C (above Tc). They constitute the nucleation of the low temperature ferroelectric phase. Diffuse phase transition occurs due to fluctuation or substitutional disorder in the arrangement of cations at different crystallographic sites which is found in most of the niobate compounds of TB family.
3.3. Hysterisis Study
Figure 3 shows the variation of polarization as a function of electric field on poled sample at room temperature.