Experimental Study on the Flow Characteristics of ¬-Type Groyne ()
1. Introduction
A groyne is a structure installed around the front part of the lakeside or riverside to protect the river or embankment from erosion caused by flows through the control of flow direction and velocity in a river. A groyne has the function of aquatic life’s shelter or habitat, and interest in groynes increases from the river and ecosystem restoration perspective. A groyne has advantages such as reducing velocity around the embankment and diversifying river flows through the formation of a recirculation zone. In addition, it partially disrupts the flow of a river, thereby influencing riverbed change by increasing velocity around the main channel. In Europe, groynes are mostly used for canals; thus, they have been used to secure the depth of the main channel. In Korea, however, it is difficult to find cases of groynes being installed for purposes of canal. Most groynes are installed for river environment improvement and embankment protection. Consequently, groyne design in Korea should be carried out in the direction of minimizing the existing channel changes and securing environmental functions such as ecosystem habitat. The types of groynes are highly diverse, and there are differences in the flows of the groyne area and the main channel’s flow variation according to the type of groyne. Therefore, it is very important to select the type of groyne according to installation purpose and decide flow variations depending on the types of groyne. Note, however, that studies on the types of groyne mostly deal with non-penetration, penetration, and overflow groynes, with very few studies on their unique shapes. Although various types of groynes are proposed and designed, they are constructed using empirical methods without design guidelines for each type of groyne.
Looking into the existing studies, the experimental study of Francis, et al. [1] on the recirculation zone at downstream groynes can be said to be the first study on the recirculation zone around groynes, but velocity measurement was not performed. Velocity measurement on the flow area around the groyne area was attempted by Rajaratnam and Nwachukwu [2]. Their study was carried out on two types of non-penetrated groynes with different lengths: they measured flow area by dividing into  and
and  d (x: length of channel, y: vertical distance from the embankment, b: length of groyne) around the groynes. Note, however, that they could not attempt flow analysis under various conditions since they applied only two types of groynes. Tingsanchali and Maheswaran [3] carried out numerical value interpretation on the recirculation zone at the downstream groyne and presented the main characteristics of the local flow field around groynes but dealt only with non-penetrated groynes; they did not cover the groyne’s impacts on the downstream separation area and thalweg line. A recent study was carried out by Ettema and Muste [4], but they analyzed only the reduced scale of impacts on the groyne’s downstream recirculation zone and thalweg line along with the downstream recirculation zone of the non-penetrated groyne according to length change. Ettema and Muste did not analyze various types of groynes. Uijttewaal [5] attempted hydraulic experiments on the four types of groynes (2 cases of non-penetration and 1 case each of penetration and overflow). He used a PTV (Particle Tracking Velocimetry) technique for velocity measurement and interpreted flow around groynes through the surface flow value. Nonetheless, the flow analysis was limited to around the groynes; it did not address the separation zone and thalweg line.
In Korea, study data related to groynes are very insufficient. Kang, et al. [6] proposed an experi-mental formula on the recirculation zone at the downstream area through experiments on the recirculation zone at downstream groynes on the groyne line end’s velocity penetration rate, approaching velocity, and groyne length as the major elements of maximum scour. Yeo, et al. [7] presented the separation zone and thalweg line on the I-type, nonpenetrated groyne and carried out an experimental study on the main flow variations but did not deal with various types of groynes. This study interpreted flows around groynes targeting the ㄱ-type groynes, which are extended to the end of the upstream area. Concerning the ㄱ-type groyne, the recirculation zone, flow variations in the channel and embankment, flow characteristics, and change aspect of the thalweg line and separation area were comparatively analyzed on 5 different arm length conditions and 3 types of velocity condition. This study aimed at providing basic data to forecast flow variation according to groyne type. Specifically, this study focused on offering basic data for groyne design by identifying the flow characteristics around groynes to propose the modified ㄱ-type groynes, not the horizontal groyne type.
2. Main Parameter
The flow variation section generated by groyne installation can be divided into the main flow area generated by protrusion of groyne and recirculation area (groyne area) at the downstream area of groynes; the separation line can be used as area division. The classification impacts caused by groyne installation can include riverbed change arising from velocity increase and main flow variation brought about by the change of thalweg line. The impacts on the downstream area of groynes include flows within the recirculation zone, with the generation of reverse flow as typical flow variation. Concerning the flow at the recirculation zone, velocity diminished compared to the flow at the upstream area of groynes; the reduced velocity can prevent embankment erosion because of tractive force. The flow can be used as habitat of aquatic organisms and shelter in case of flood, thanks to velocity distribution under various conditions.
This study analyzed the maximum velocity change, maximum thalweg line change in the main flow area, and velocity in the change area of the maximum thalweg line as well as the recirculation zone size and flow around the embankment at the downstream area of groynes to analyze the impacts on ㄱ-type groynes. Figure 1 shows the diagram of flow variation by groyne. Although a thalweg line means the line connecting the maximum depth from the channel toward the flow direction, this study set the riverbeds of the experimental channel to be the same and defined the channel’s central line as the thalweg line.  indicates the change scope of the thalweg. The recirculation zone can be defined by length (SL) and width
 . SL denotes the maximum downstream length of the separation line from the groyne installation spot, whereas
  means the largest side width. This study defined the angle through which flow is separated from the groyne line end as separation angle
 , and the angle on the length from the groyne end to the embankment where the recirculation zone is generated, as incidence angle
 . The sizes of these are mainly referred to when the embankment protection effect limits and habitat improvement effects caused by groyne installation are estimated. Define abbreviations and acronyms the first time they are used in the text, even after they have been defined in the abstract. Abbreviations such as IEEE, SI, MKS, CGS, sc, dc, and rms do not have to be defined. Do not use abbreviations in the title or heads unless they are unavoidable.
3. Hydraulic Experiment
The channel used for the hydraulic model experiment of the ㄱ-type groynes was straight line channel with width of 2.0 m, length of 40 m, and height of 0.8 m. For the experiment, five types of groyne models were used: 0.15 for the rate of channel width to groyne length (l/B), with arm length of 20%, 40%, 60%, 80%, and 100% of the groyne length (l) (AL/l = 0.2, 0.4, 0.6, 0.8, 1.0, respectively).

Figure 1. Characteristics and definitions of flow variations around the single ㄱ-type groyne.
The experiment was carried out by installing each model at the right embankment at the downstream area 15 m away from the upstream end as shown in Figure 2. Velocity at the inflow area was measured using the 3D ADV velocity meter and LSPIV; the experiment conditions are presented in Table 1. Concerning velocity conditions, experiments under 15 conditions were conducted on three conditions each at the scope of 0.25 m/s - 0.40 m/s. As depth condition, 0.15 m was to be maintained through water level control at the downstream area. Figure 3 shows the model channel and ㄱ-type groyne installation.
The LSPIV (Large-Scale Particle Image Velocimetry) technique, which analyzes the images obtained through video camera shooting on flow characteristics around groynes, was used. Through this, the surface flow field was analyzed. This study also reviewed flow distribution as analyzed through the LSPIV technique regarding the channel of the groyne installation section and groyne area section.
The LSPIV technique can obtain the instantaneous flow field of the entire target area by overcoming the limit of the measuring equipment based on existing sensors such as LDV and ADV. Having the same basic principle as the existing PIV technique, the LSPIV technique shoots the target area using a video camera and processes it just like software. There are no restrictions on laser examination and camera arrangement, which are essential in the existing PIV technique. The disadvantage of the LSPIV technique is that acquiring information on the 2D or 3D flow field in water is difficult because of the absence of a laser examination procedure. Depending on the cases, there are many instances of obtaining distorted images; hence the need for correlation analysis after carrying out the correction work of shot images prior to image processing. As such, accuracy is lower compared to the existing PIV technique. Despite such disadvantage, the LSPIV technique was used because the entire flow field could be measured at much less cost and effort within a short time compared to the existing equipment, manpower use in a large-scale experiment, and site survey. Therefore, the LSPIV technique is applied to hydraulic model experiments or river site [8-10]. Since the experiment sought to compare and test the effects according to the groyne design elements, the LSPIV technique adoption was considered to be advantageous because more measured data could be obtained compared to the existing measuring devices in terms of LSPIV technique-adopted surface layer flow field measurement.
Flow distribution analysis is designed to identify flow variation arising from channel installation; this study analyzed the flow in the groyne section by making the total average flow dimensionless. An experiment using the LSPIV technique and analysis section’s flow distribution was conducted. Flow field was analyzed with 50 lattices having 0.04 m gap toward the channel width direction. Through the analysis of the values of 1, 2, …, 12 on the groyne length, flow direction was identified. A digital camcorder (DCR-PC350, Sony Co.) was used for the shooting of the flow field; propped rice was used as floating particles. For the software, CACTUS 3.1 (IIT Co.) was used for basic image processing and analysis such as distorted image correction.
4. Result Analysis
The ㄱ-type groyne experiment was carried out on 5 different arm lengths, and analysis on the hydraulic characteristics change was performed including the length of the recirculation zone at the groyne end, flow separation, and flow variation at the line end on the arm length change. The data measured in the experiment as obtained using LSPIV is shown in Table 2. For the rate of groyne arm length, arm length (AL) was made dimensionless with groyne length . As for the separation length rate, separation length
  was made dimensionless with groyne arm length (AL). The separation angle
  refers to the angle extending by clash between the inflow area flow and main flow at the ㄱ-type
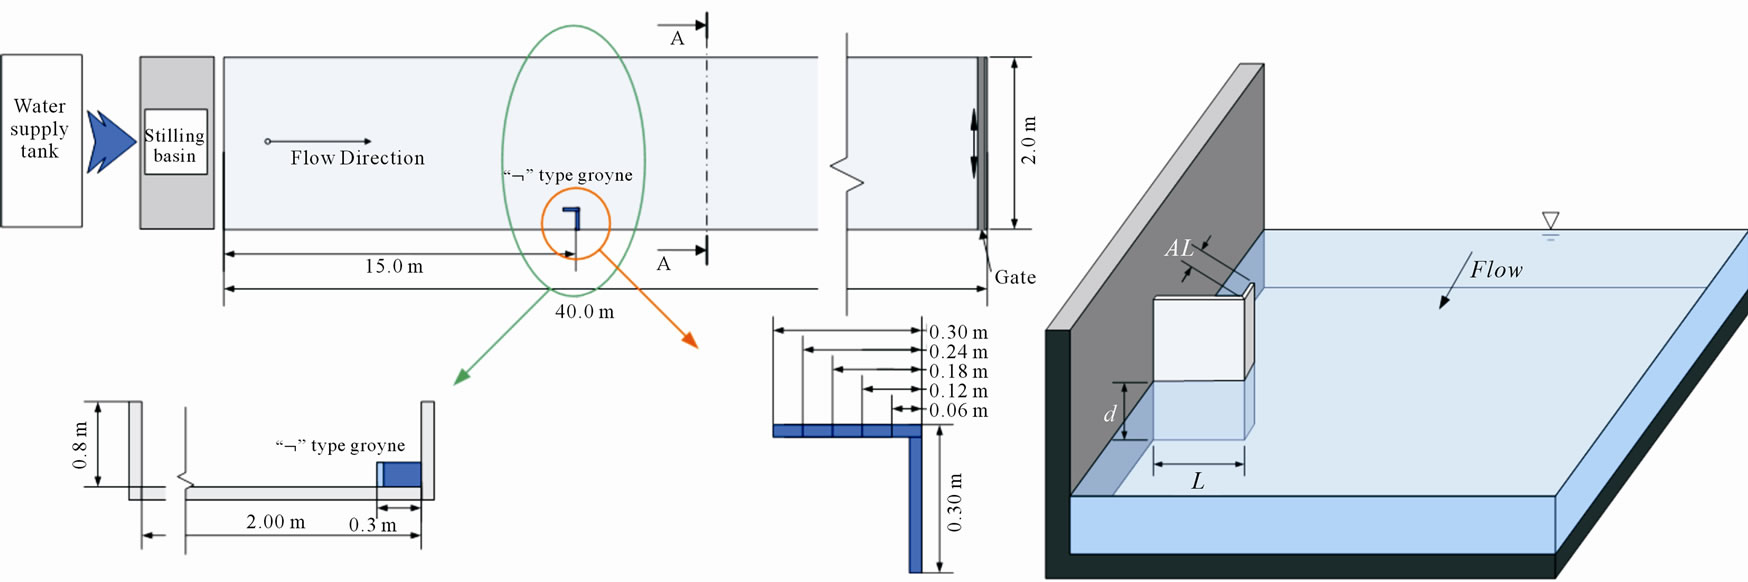
Figure 2. Plan view of ㄱ-type groyne in channel.

Table 1. Experimental conditions of ㄱ-type groyne.
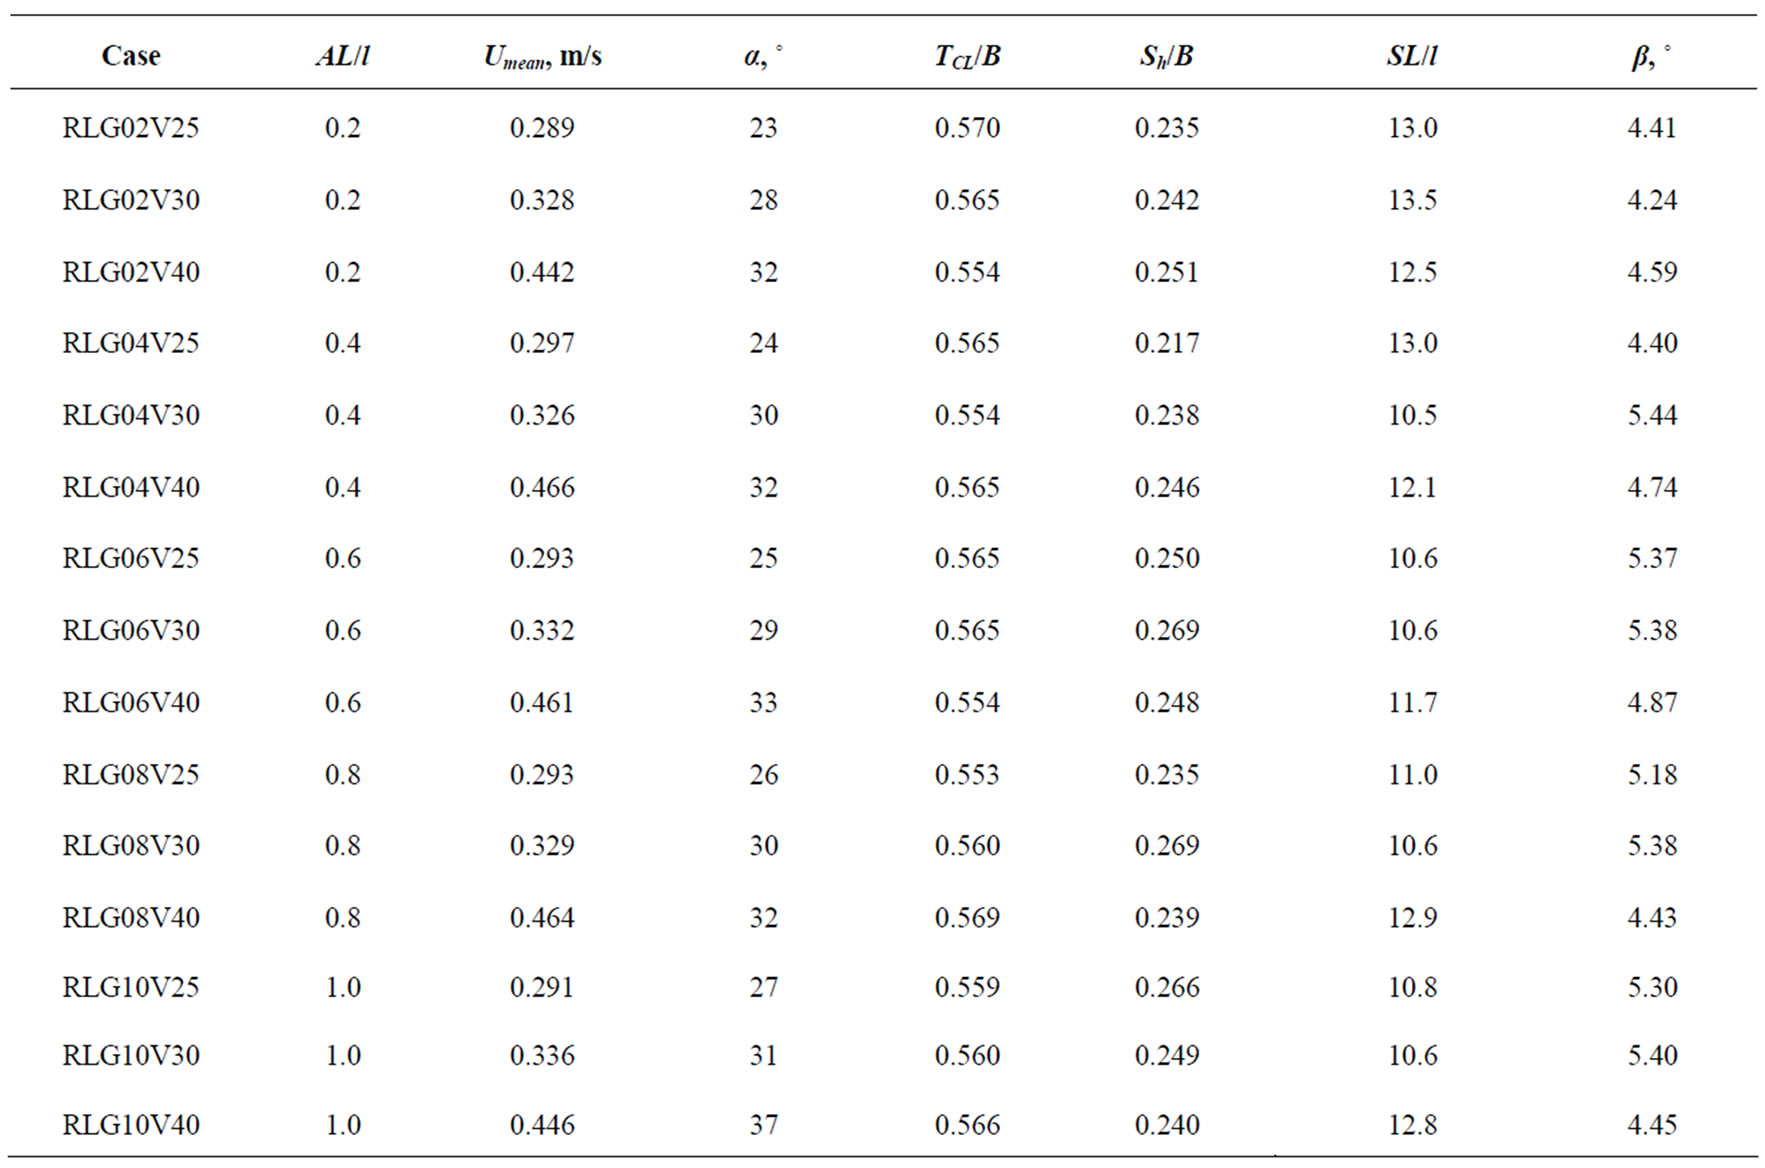
Table 2. Experimental results of single ㄱ-type groyne.
groyne line end. The incidence angle  pertains to the angle from the groyne line end to the embankment where the recirculation zone is generated.
4.1. Thalweg Line and Recirculation Zone
The flow around groynes forms the thalweg line change and recirculation zone in the main flow area, whereas flow angle changes from the groyne line end to the direction of the thalweg line. Figure 4 illustrates as the stream line the flow analysis results according to the change of ㄱ-type groyne arm lengths through which the separation angle, thalweg line, and recirculation zone can be identified.
The separation angle  on the t-type groyne was designed to identify flow variation around the end of the groyne. It was compared with Froudle (Fr) and AL/l as shown in Figures 5 and 6, respectively. The separation angle at the groyne line end was measured at the 23˚ - 37˚ section in proportion to Fr. No big difference was observed in comparison with the separation angle of the non-penetrated groyne, with the same groyne length measured between 30˚ and 35˚. At the front part flow of the ㄱ-type groyne, stagnant flow and small overflow within the groyne area covered with groyne arm from the groyne installation spot were formed. The stagnant area of the front of the groyne disrupted the flow in channel and caused the formation of the separation angle. The separation angle according to the groyne arm length extended by 3˚ - 5˚ as the arm length increased; this is related to the impacts of slip coming from the rear of the groyne.
The thalweg line was assumed to be that at the upstream of the groyne. When the riverbed height of the
 (a)
(a) (b)
(b)
Figure 4. Measured image and vector fields (AL/l = 0.2, 0.4, 0.6, 0.8, 1.0; Vapp = 0.25 m/s), (a) RLG04V25 (AL/l = 0.4, Vapp = 0.25), (b) RLG10V25 (AL/l = 1.0, Vapp = 0.25).
cross section is constant, the thalweg is the stream line where maximum velocity occurs. The change of thalweg line is an important factor in analyzing the main flow’s change and can be an element that can evaluate the riverbed change of a channel. The separation area can serve as a factor in embankment evaluation and water ecosystem habitat evaluation by evaluating the groyne area where various flows exist.
Each experiment used the surface velocity field measurement results to identify the thalweg line change and separation area size. Through the experiments, this study measured maximum thalweg distance  from the groyne installation wall as well as the separation area’s width
  and analyzed each flow condition and groyne arm length rate.
Figure 7 shows the changes of thalweg line and separation area according to the flow conditions. The length axis was made dimensionless by dividing the vertical direction length (y) by the channel width (B) from the channel installation wall. The width axis was made dimensionless by dividing the distance from the groyne installation spot to the downstream area by groyne length  with regard to the flow direction.