Nutritional Analysis and Determination of Heavy Metal Content of Some Spices from the Northern Region, Bangladesh ()
1. Introduction
Spices are mainly considered as dried products of plants viz. fruits, seeds, barks, leaves, rhizomes, roots, etc., which are commonly used as diet components to enhance the aroma, flavor, palatability, and acceptability of food [1]. These are widely consumed in all seasons for changing the world’s cuisine, as well as the most valuable items of trade [2]. During the few decades, the potential use of spices has markedly raised in different areas of the world including Asia, the Middle East, Eastern Mediterranean, and Europe due to having their nutritional, antioxidant, and medicinal values [3]. Thus, they form an important part of the pharmaceutical, chemical, Ayurvedic Pharmacopia, and food industries [4].
Spices or condiments possess macro and micronutrients as well as bioactive compounds that stimulate the digestion and absorption processes [5]. In addition, many ess’’ential (e.g. calcium, potassium, phosphorus, iron, copper, and zinc) and toxic trace elements (such as lead, mercury, cadmium, arsenic, etc.) are also present in low concentrations that play a vital role in structure and functions of metalloproteins and enzymes in human biochemical reactions [6]. From the nutritional point of view, spices and condiments are not considered to be important in a balanced diet due to the small intake in the daily meal [7]. However, few studies recommended spices as a rich source of calcium, iron, and vitamin A for low-income families [8]. Although the nutritional composition of spices and condiments from different countries [9] [10] have been reported by several researchers, the composition of Bangladeshi spices is still rare.
Admittedly, the concentration of heavy metals (mass density > 4.5 g/cm3) may be increased in the plant and food products during cultivation [11], industrial processing, and packaging [12]. A previous study revealed that spices from different regions of Austria, Egypt, and Nigeria showed the tendency to accumulate heavy metals at alarming levels [13] [14]. According to Das et al. (2015), some businessman adds color in the powder of spices to attract customer in the open local market [3]. Additionally, spices may be contaminated with heavy metals through aerial depositions during drying on the roof or ground. Despite being the essential metals that are naturally present in the plants, Agency for Toxic Substances and Disease Registry (ATSDR, 2015) had declared that Pb and Cd are the second and seventh-most toxic metals in common condiments [15]. As rural and urban peoples of Bangladesh are prone to spicy foods, and common spices (viz. red chili, turmeric, coriander, black cumin, and bay leaves) are used in daily cuisine, it is imperative to monitor the nutritive values and heavy metal contents in the spices to ensure health safety for local people. In this study, we investigate various spices in the Northern region of Bangladesh.
2. Materials and Methods
2.1. Sample Collection
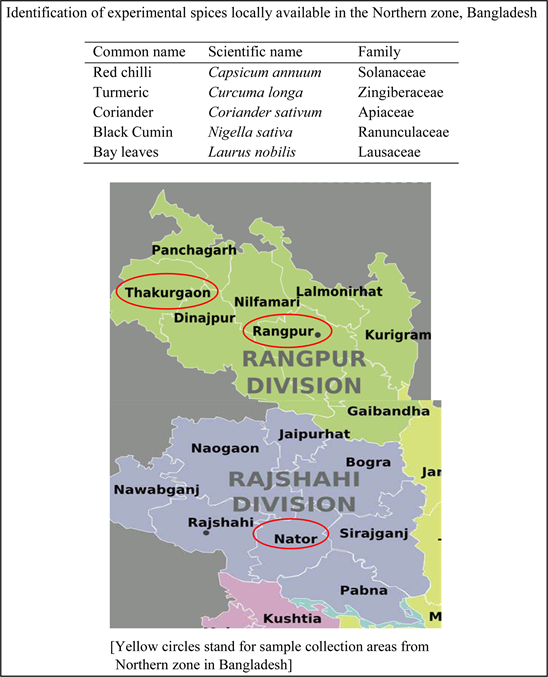
Nine samples of each spice were collected randomly from the local market of Northern zone, Bangladesh viz. Natore, Rangpur, and Thakurgaon district from November to March. Thus, a total of 45 samples were collected from different places in the selected areas and stored in polythene bags for laboratory analysis. Selected spices with scientific and family names are shown below.
2.2. Sample Preparation
Spices were thoroughly segregated, cleaned, and dried in sunlight for 12 h followed by in a thermostatically controlled oven at 40˚C - 50˚C for approximately 1 to 2 h. The dried spices were converted into fine particles using a stainless steel grinder and test sieve, no. 80 mesh [16]. The spices powder was then kept in polypropylene plastic pouches for the subsequence analysis of the study.
2.3. Nutritional Analysis
The nutrient contents of experimental spices were estimated according to the standard analytical methods mentioned by Rahman et al. (2021) [17]. Protein, fat, fiber, and ash were determined according to the AOAC (2000) method [18]. Soluble protein and non-protein nitrogen were calculated by determining soluble nitrogen by the Kjeldahl method and carbohydrate content was determined by the calculated difference method. Sodium, potassium, and calcium were estimated by the flame photometric method [19]. Vitamin C was determined using the Indophenol method described by Food Analysis Laboratory Manual [20].
For the determination of heavy metals from spices, approximately 0.5 g of sample powder were taken into a Teflon digestion vessel and dissolved with 7 ml concentrated nitric acid (HNO3) and 1 ml perchloric acid (HClO4). The samples were radiated into the microwave digestion system for 20 min. After cooling, the samples were filtered with Whatman filter paper (0.45 μm pore size) and transferred into 50 ml volumetric flasks with 1% HNO3. The concentration of heavy metals (Pb, Cd, As, Hg, Sn, Fe, Cu, Ni, and Mg) were analyzed by using graphite furnace atomic absorption spectrometry (GFAAS) [21].
2.4. Statistical Analysis
The composition of spices is expressed as mean ± standard deviation (x ± sd). The normality of the data was tested using Q-Q-plot and Shapiro-Wilk test, and the Levene test was used to test homogeneity of variance. One-way ANOVA was used to compare significant variations in nutrient content among spices. Post hoc analysis (Tukey HSD) was used for determining the mean differences within the groups. All analysis was done by appropriate statistical methods using RStudio (Version 1.4.1717) based on R (Version 4.1.0).
3. Result
3.1. Quantitative Analysis of Nutrients from Spices (per 100 g)
The proximate composition of spices is presented in Table 1. The result showed that spices are rich in carbohydrates, fiber, and fat. Among the experimental spices, turmeric and bay leaf showed the highest carbohydrate content, and black cumin was the lowest one. Free sugar was significantly (P < 0.001) higher in coriander and chili powder, while bay leaf and black cumin showed a tiny amount of sugar content (Table 1). Protein and dietary fiber content were noticeable among the black cumin, chili, and coriander powder. Fat content was ranged between 14.0% to 17.8%, except turmeric (4.11%). Moreover, saturated fat was superior in bay leaf (2.3%), and trans fat was significantly upper in chili and turmeric than other spices. The highest amount of vitamin C, sodium, and potassium content was found in black cumin. Bay leaf was the second highest. Calcium content was found in a minute amount in turmeric, but the highest level
![]()
Table 1. Proximate nutrient contents of spices powder (per 100 g).
Values are means of triplicates ± standard deviation. Values on the same row with different superscripts are significantly different (P ≤ 0.05).
was found in the bay leaf and black cumin (Table 1).
Moisture and acid insoluble ash content were almost equal in range for all the experimental samples as shown in Figure 1. The highest acid insoluble ash was found in black cumin, whereas moisture content was recorded in turmeric. Water and alcohol soluble ash content was lowest in black cumin, while the highest were found in turmeric powder, followed by bay leaves, coriander, and chili. In the case of total ash, the highest mean concentration was found for turmeric and the lowest was for bay leaves (Figure 1).
3.2. Heavy Metal Contents in Spices
This study also indicated the proximate heavy metal contents in the selected spices, available in Bangladesh. The concentration of heavy metals in the analyzed spice samples is listed in Table 2. The metal levels were determined based on the dry weight of the spices. The highest mean levels of magnesium (Mg) and iron (Fe) were detected in all spices samples, while arsenic (As), mercury (Hg), cadmium (Cd), and lead (Pb) were generally the lowest level in all samples. Turmeric showed the highest Mg (2066.24 mg/kg) and Fe (248.25 mg/kg) content, whereas, coriander was the lowest ones, which were recorded as 301.78 and 18.61 mg/kg, respectively. The mean concentrations of lead in the spices ranged from 0.11 - 0.89 mg/kg. In all the samples average Cd, As, and Hg concentration was more or less equal in range (Table 2). The tin (Sn) concentration was the highest in black cumin as 1.94 mg/kg, followed by chili (0.85 mg/kg), and the lowest in turmeric as 0.17 mg/kg. Black cumin was rich in copper (Cu) and Nickel (Ni), which were recorded as 14.78 and 6.12 mg/kg, respectively. While in other samples, it ranged from 3.55 to 9.43 mg/kg and 0.59 to 2.78 mg/kg respectively. Comparatively the heavy metal contents were the lowest in coriander,
![]()
Figure 1. Ash and moisture percentage of different spices in Bangladesh.
![]()
Table 2. Heavy metal composition of spices (mg/kg).
Values are means of triplicates ± standard deviation. Values on the same row with different superscripts are significantly different (P ≤ 0.05).
followed by bay leaves and the highest level were found in turmeric and chili.
4. Discussion
Spices are commercially important for domestic consumption and export. They are indispensable in culinary art and are also used in pharmaceuticals, perfumes, and cosmetics industries from ancient times [2]. Spices are good sources of ash, fiber, and important minerals [22]. The above results are also accordant with the previous study. The present study showed that spices were rich in carbohydrate (51.0% - 71.1%), and turmeric (Curcuma longa) had the highest carbohydrate content, but lower dietary fiber (7.44%). While, bay leaf (Laurus nobilis), red chili (Capsicum annuum), coriander (Coriander sativum), and black cumin (Nigella sativa) were recorded as 26.0%, 32.05%, 34.01%, and 40.0% dietary fiber respectively. Soluble fiber (eg. gums, pectins, hemicelluloses, and other polysaccharides) and insoluble fiber could be the reason for high values of fiber [10]. This study also found that high sugar content was present in coriander (22.76%) and red chili (23.86%), which might be due to the presence of sucrose, fructose, and poly fructosans [7]. Moreover, bay leaf and black cumin had negligible sugars (0.05%). The protein contents of the experimental spices were comparable (7.0% - 16.77%), being more than that of cereals and dry legumes [9]. The fat content was high in all spices (14.0% - 17.8%), except turmeric (4.11%). However, saturated and trans fat was at a minimal level in the case of all spices. The goal of the spice industry is to maintain the moisture between 5% - 14% because the lower moisture content prevents microbial damages, and below 5% causes crumbling and loss of shape. This study showed that the moisture content was met in all spices (Figure 1). Black cumin showed the highest vitamin C, while other spices had a negligible amount.
Many essential and toxic heavy metals were also found in low concentrations on the selected spices. The maximum permissible standard concentration of Fe in food is 300 mg/kg as recommended by WHO 2005 [23]. As revealed by analytical results (Table 2) iron content of spices samples ranged between 90.2 mg/kg for black cumin and 274.92 mg/kg for bay leaves, except coriander (18.61 mg/kg). Black cumin and bay leaf were good sources of major minerals viz. calcium, magnesium, sodium, and potassium. Minerals play a significant role in proper body function, immune system, and good health, as well as prevent numerous metabolic disorders [24].
The daily permissible intake of copper (Cu) is less than 20 mg/kg which does not affect health, but a higher level can be toxic [5]. In our study, the Cu content of spices was ranged between 3.55 to 14.78 mg/kg, while black cumin showed the highest one. As observed by Das et al. (2015), the copper concentration of coriander, red chili, and turmeric were 10.38, 9.23, and 8.3 mg/kg respectively. They also recommended the range of Cu concentration differ widely from 0.56 to 24.90 mg/kg depending on the different branded spices [3]. However, Cu concentration in all the spicy samples was recorded as less than half the WHO limit (50 mg/kg). According to the WHO (2002) limits in spices for lead (Pb), mercury (Hg), nickel (Ni), cadmium (Cd), arsenic (As), and tin (Sn), the maximum permissible standard concentration were 10, 10, 50, 0.2, 1 and 200 mg/kg respectively [25]. Toxic levels of heavy metals in food/spices have been associated with a harmful effect on the skin, lungs, liver, kidney, and bladder [26]. However, the present study found that the concentration of Pb, Cd, As, Hg, Sn, and Ni in the spices were in a range of 0.11 to 0.89 mg/kg, 0.004 to 0.22 mg/kg, 0.004 to 0.15 mg/kg, 0.17 to 0.25 mg/kg, 0.17 to 1.94 mg/kg, and 0.59 to 6.12 mg/kg respectively. Daily intake values for all samples were less than the maximum permission limit values and they are not a bright line for health risk. Comparatively coriander, black cumin, and turmeric showed the lowest heavy metal contents than red chili. From this research, spices have particularly proved to be an excellent in terms of nutrition, however, large scale study will be needed to clarify this phenomena.
5. Conclusion
Spices are important components of many diets and are a rich source of carbohydrates, fiber, fat, and minerals. Based on this study, spices are not heavily burdened with metals, and the concentrations are below the legal values for spices proposed. Black cumin and bay leaf were rich in proximate nutrients, as well as minerals like potassium, calcium, sodium, magnesium, and iron. The highest magnesium concentration was found in turmeric followed by black cumin and red chili. Heavy metal content in the investigated spices was considerable amounts that are safe for human consumption. From the nutritional point of view, spices are not considered to be important in the balanced diet due to their small intake in the daily meal but can be complemented with other food components.
Acknowledgements
The authors are thankful to the department of Applied Nutrition and Food Technology, Islamic University, Kushtia, Bangladesh.
Author Contributions
Md. Zahidul Islam: Formal analysis. Shaikh Shahinur Rahman: Formal analysis, Methodology, Data curation, Writing-original draft. Apurba Kumar Das: Writing-review & editing. Md Kamruzzaman: Data curation, Statistical analysis, Writing-review & editing. Md. Hafizur Rahman: Conceptualization, Methodology, Investigation, Writing-review & editing.
NOTES
*The authors are equal contribution to prepare this manuscript.
#Corresponding author.