Journal of Biosciences and Medicines
Vol.05 No.03(2017), Article ID:74852,8 pages
10.4236/jbm.2017.53012
Post-Hoc Comparison in Survival Analysis: An Easy Approach
Arunabh Tripathi1, Anant Pandey2
1Department of Biostatistics, AIIMS, New Delhi, India
2Center of National Injury Surveillance, PGIMER, Dr. RML Hospital, New Delhi, India

Copyright © 2017 by authors and Scientific Research Publishing Inc.
This work is licensed under the Creative Commons Attribution International License (CC BY 4.0).
http://creativecommons.org/licenses/by/4.0/


Received: February 12, 2017; Accepted: March 20, 2017; Published: March 23, 2017
ABSTRACT
Survival studies mainly deal with distribution of time to event. Often in such studies researchers are interested in comparing several treatment or prognostic groups. At the time of analysis, there is an unmeasured chance of making type I error, or finding a falsely significant difference between any two groups. The chance of making type I error is increased, if multiple groups are compared simultaneously. In this paper, survival analysis with Bonferroni correction is explained in easy way to cope up with this issue. The DLHS-3 data are taken to explain this methodology in the context of neonatal survival. Kaplan-meier plot with three survival comparison test is used to elaborate the application of Bonferroni correction.
Keywords:
Survival Analysis, Bonferroni Correction, Kaplan-Meier Plot

1. Introduction
Several biological, epidemiological and clinical studies have “time to an event” as their endpoint. Survival analysis approaches are used to find any conclusion from these studies. Survival Analysis is a statistical procedure for data analysis in which the outcome of interest is time until an event occurs [1] . Survival studies concern with distribution of time to event. Often in such studies researchers are interested in comparing several treatment or prognostic groups with one another in terms of their survival curves [2] . When this is done, the chance of making at least one type I error, or finding a falsely significant difference between any two groups, is increased above the desired level.
In these tests, the probability of making a type I error or α, an “acceptable” risk of type I errors, conventionally set at 0.05. Problems arise, when researchers perform several hypothesis tests instead of one. This is because each test again has a probability of producing a type I error, and performing a large number of hypothesis tests factually guarantees the presence of type I errors among the findings. Often such analyses are done without any adjustment for multiple comparisons, resulting in an excess of type I errors. A more appropriate criterion to control when making several comparisons is the family wise error (FWE) rate, which is the chance of making at least one type I error among all treatment comparisons being made.
The key goal of multiple testing methods is to control, or at least to quantify, the overflow of type I errors that arise when many hypothesis tests are performed simultaneously. There are different techniques of doing this as proposed by different researcher. In recent time more than twenty techniques are available. Several post-hoc procedures for pairwise comparison like Boneferroni [3] , Sidak [4] , Dunnet [3] , Tukey [5] and its modifications, Student-Newman-Keuls SNK test [5] , Scheffe test [6] and Walter & Duncan test [7] which use the Bayesian inference are being used. Every test has its advantage and disadvantage. So far Bonferroni is most appropriate post-hoc test procedure because it is simple and easy to apply.
The above mentioned correction methods are being used frequently in Analysis of Variance (ANOVA). In another sense comparison of mean is done in more than two categories of a variable by using above correction methods. But the use of post-hoc correction methods in survival analysis is hardly seen. This is the main motivation behind this endeavour to explore the post hoc comparison in survival analysis where Kaplan-Meier plot and log rank test are used to compare the survival status in different group.
In this paper, survival analysis with multiple testing has been performed on neo-natal survival status. In child mortality estimates the neonatal mortality plays a vital role because majority of deaths occurring in this age group is contributed by neonatal mortality. Neonatal survival is a very sensitive indicator of population growth and socio-economic development. For these reasons, the issue of neonatal deaths is a serious national health concern. The neonatal mortality is defined as probability of death of a newborn within 30 days from the date of birth.
2. Methods
Kaplan Meier, log rank test and post hoc adjustment are described, to complete the flow of survival analysis with post hoc comparison.
The Kaplan-Meier estimate [8] of survival function is based on discrete time approach. To understand this approach, the authorssuppose that there are n births whose survival time is being observed up to a specified time t (t = 30 days in case of neo-nates) and  are their survival times (some of these observation may be right-censored, and there may also be more than one individual with the same observed survival time). We therefore suppose that there are r death times amongst the neonates, where r ≤ n. After arranging these death times in ascending order, the jth is denoted
 , for j = 1, 2, ・・・, r and so the r ordered death times are
 . The number of neonates who are alive just before time
 , including those who are about to die at this time, will be denoted
 , for j = 1, 2, ・・・, r and
  will denote the number who die at this time. The time interval from
  -Δ to
-Δ to , where Δ is an infinitesimal time interval, then includes one death time. Since there are
  infants who are alive just before
  and
and  deaths at
 , the probability that an individual dies
during the interval from  -Δ to
-Δ to  is estimated by
 . The corresponding
estimated probability of survival through that interval is then . If we
have i(i = 1,2,3 ・・・) no. of group to be compared by survival probability then the generalized probability of survival through that interval for each group is
 . The test statistic which is used to compare the survival probability is
based on hypergeometric distribution of the number of events at distinct event times. The generalized test statistic for comparison of survival pattern among groups is as follows
 (U and V are matrix).
And 
 is the expectation of death in group i at the jth distinct observed time.
  is the weight at the jth distinct observed time.
  for the log-rank [9] test is equal to 1, and
  for the Breslow [10] [11] test is for the
  and for Tarone-Ware [12] method
  is the square root of
 . The test statistic for equality of survival across the k groups is approximately chi-square distributed on k − 1 degrees of freedom. These tests are used for the comparison of two or more groups of survival data. On the null hypothesis that the risk of death is the same in two groups, then we would expect the number of deaths at any time to be distributed between the two groups in proportion to the number at risk. The Breslow is sensitive to early deference between survival curves, while the logrank is sensitive to later ones. The Tarone-Ware test, like the Breslow test, also uses the number at risk to weight differences, but this time takes the square root of the number at risk. This can be seen by the relative weights they assign to the test. The log rank test is optimal under proportional hazard assumption .The Breslow has high power when the failure times are lognormally distributed.
In this study above mentioned three tests as well as KM plot are obtained. For pairwise or multiple comparison bonferroni correction is used. The boneferroni correction procedure is as follows:
Let  be a family of hypothesis and
  are their corresponding p values. Let n be the total number of null hypotheses. The Family Wise Error Rate (FWER) is the probability of rejecting at least one true Hi, that is, of making at least one Type I error. The Bonferroni correction rejects
the null hypothesis for each , thereby controlling the FWER at ≤α.
Bonferroni correction assumes null hypothesis true for all test in consideration. Hence it lacks power. When the number of comparisons becomes large, the test may become too conservative and no longer allows you to find anything significant [13] . Although this correction is some lacuna still it is very easy to apply and having better result in case of small no. of post-hoc test. Here in manuscript level of significance is 5% in overall comparison and in multiple comparison level of significance is taken as 5/3 = 1.7% (according to bonferroni correction if no. of post-hoc pair is 3). So for any overall comparison if p value < 0.05 then considered difference would be statistically significant. And pair wise comparison would be statistically significant if p value < 1.7%.
The Data selected to describe the survival analysis in post hoc setup is taken from District Level Household and Facility Survey (DLHS-3) [14] is third in the series preceded by DLHS-1 in 1998-99 and DLHS-2 in 2002-2004. DLHS-3 (2007-2008) is designed to provide estimates on maternal and child health, family planning and other reproductive health indicators. From this data we followed the recent child birth from 1st January 2004 to the date of survey for the state Uttar Pradesh [15] . Event was decided as death if it occurs from births to 30th day.
The two independent variable Birth order and Age of mother are taken in study to find out their effect on neo-natal survival. Both variables are divided into three categories. Birth order has first category as birth order 1, second category defined those female who have birth order between 2 - 4 and third category covers the other than above mentioned two categories. Mother age (in years) have three category first “≤19”, second “20 - 34” and third “≥35”.
3. Result
Descriptive analysis of selected variable is given in Table 1. 2.8% neonates died while 97.2% neonates survived. The highest proportion of death in various categories of Birth order is for first birth order that is 4.1%. Highest death of neonates, that is 3.7% were occurred in mothers who ≤ 19 years of age.

Table 1. Descriptive profile of selected variable.
Kaplan-meier curve is portrayed (Figure 1 & Figure 2) to visualize the pattern of survival of neonates with time among various categories of selected variables. In birth order category “else” survival experience of neonatesis totally different from another two categories of birth order. In variable mother age every categories have same neonatal survival experience at starting point but with time being,
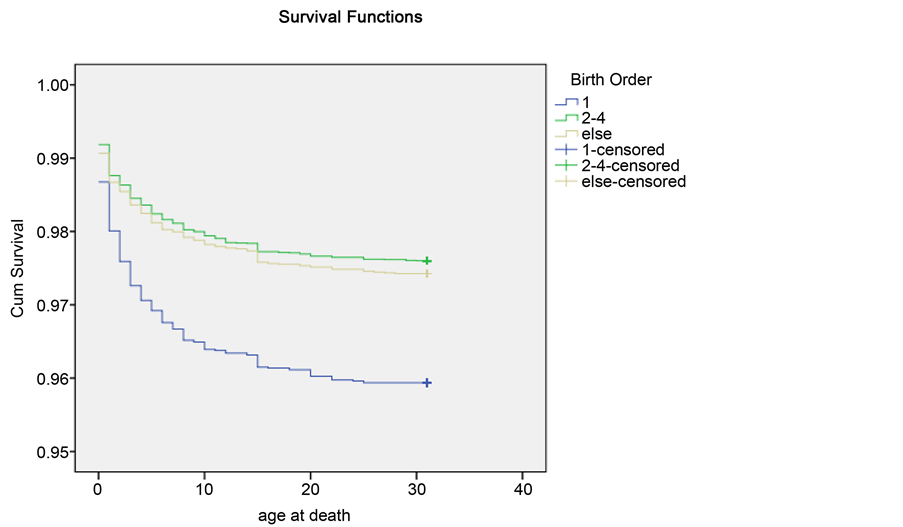
Figure 1. Survival pattern of new born according birth order.

Figure 2. Survival pattern of new born according mother age at birth.
the width among curve became wider.
To find out that whether these differences occurred by chance or the difference is really significant, According to our methodology all three test were performed with their posthoc comparison for each pair of group in every variable. The posthoc adjust p value are calculated by bonferroni correction. Both variables have shows the overall significant difference among group. To find out which pairs of groups are significant different all the three tests are done without correction and with correction by bonferroni (p value adjustment).
Table 2 shows the variable birth order in pairwise (posthoc) comparison, pair (1, 2) and(1, 3) are find out as statistically significant different in survival pattern by all three test in both case whether p value adjust or not. But in case of mother age pair (1, 2) came as significant by all the three test in adjusted as well as non adjusted p-value. The pair (2, 3) found as significant in case of non adjusted p-value by all the three test but when the p value is adjusted by bonferroni correction then these pairs did not shows any significant differences.
4. Discussion
Adjustment of p values in multiple hypothesis testing is the concern of various statisticians [6] [7] [16] [17] [18] since long but it is confusing for those who do not have a background in statistics and, they apply these corrections by using various softwares. It is easy to calculate in user friendly software like SPSS and STATA. These adjustments only limited for the case of ANOVA and in usual hypothesis procedure. But in case of survival analysis, no such direct adjustment method exists for multiple comparisons to calculate adjust p value directly so for multiple comparison in survival analysis avoids or just make two group for each independent variable. So here by using easy concept of Bonferroni correction one can find out the multiple comparisons in survival analysis with adjusted p value. In this paper Kaplan meier curve and three tests of survival pattern comparison were presented with their basic methodology and by application of Bonferroni correction the pairwise comparison in survival setup has also been explained. The data taken from DLHS-3 survey for the neo-natalsurvival and two independent variable birth order and mother age were considered to describe simple survival analysis using bonferroni correction. In case of independent variable birth order all the analysis output were found in coordinate way in other
Table 2. Comparison of survival pattern for selected variable.
*After adjusting by bonferroni correction.
words KM curve, all three test shows there is a difference in survival among categories of birth order and if we go for posthoc or multiple comparison KM curve shows a clear difference in category 1, 2 as well as 1, 3 and these finding are also supported by selected survival test with non adjusted and adjusted p values. The variable age of mother shows the significant difference in neo-natal survival among categories of mother age and this finding supported by KM curve for variable mother age, but in case of multiple/post-hoc comparison category 1, 2 shows clear difference in survival pattern and by test p values in adjusted and for not adjusted case are also significant. When we test the pair 2, 3 it shows the survival pattern differ by all three test for non adjusted p value even the KM curve also shows the difference but slightly close pattern in both group in starting of survival curve. Now p value adjusted by Bonferroni correction for comparing pair 2, 3 and it was found insignificant difference between group 2 and 3 for neo-natal survival. So this pair gives an example of correction of p value in multiple testing and it also shows the importance of p-value adjustment in multiple testing for draw a right conclusion.
Cite this paper
Tripathi, A. and Pandey, A. (2017) Post-Hoc Comparison in Survival Analysis: An Easy Approach. Jour- nal of Biosciences and Medicines, 5, 112- 119. https://doi.org/10.4236/jbm.2017.53012
References
- 1. Kleinbaum, D.G. (1996) Survival Analysis: A Self-Learning Text. Springer-Verlag, New York.
https://doi.org/10.1007/978-1-4757-2555-1 - 2. Hosmer, D.W. and Lemeshow, S. (1999) Applied Survival Analysis. John Wiley and Sons, New York.
- 3. Saville, D.J. (1990) Multiple Comparison Procedures: The Practical Solution. The American Statistician, 44, 174-180.
https://doi.org/10.1080/00031305.1990.10475712 - 4. Toothaker, L.E. (1993) Multiple Comparison Procedures. No. 89, Sage, Thousand Oaks.
https://doi.org/10.4135/9781412985178 - 5. Abdi, H. and Williams, L.J. (2010) Turkey’s Honestly Significant Difference (HSD) test. Encyclopedia of Research Design. Sage, Thousand Oaks, 1-5.
- 6. Scheffe, H. (1999) The Analysis of Variance. Vol. 72, John Wiley & Sons, Hoboken.
- 7. Duncan, D.B. (1955) Multiple Range and Multiple F Tests. Biometrics, 11, 1-42.
https://doi.org/10.2307/3001478 - 8. Kleinbaum, D.G. and Klein, M. (2012) Survival Analysis: A Self-Learning Text. 3rd Edition, Springer, New York.
https://doi.org/10.1007/978-1-4419-6646-9 - 9. Mantel (1966) Evaluation of Survival Data and Two New Rank Order Statistics Arising in Its Consideration. Cancer Chemotherapy Reports, 50, 163-170.
- 10. Breslow, A. (1970) Thickness, Cross-Sectional Areas and Depth of Invasion in the Prognosis of Cutaneous Melanoma. Annals of Surgery, 172, 902-908.
https://doi.org/10.1097/00000658-197011000-00017 - 11. Gehan, E. (1965) A Generalized Wilcoxon Test for Comparing Arbitrarily Singly-Censored Samples. Biometrika, 52, 203-223.
https://doi.org/10.2307/2333825 - 12. Tarone, R.E. and Ware, J. (1977) On Distribution-Free Tests for Equality of Survival Distributions. Biometrika, 64, 156-160.
https://doi.org/10.1093/biomet/64.1.156 - 13. Abdi, H. (2007) The Bonferonni and Sidák Corrections for Multiple Comparisons.
http://www.utdallas.edu/~herve/Abdi-Bonferroni2007-pretty.pdf - 14. DLHS-3 District Level Health Survey 3. Conducted by “International Institute for Population Sciences” on Sample Basis in All over India during the Period 2007 to 2008.
- 15. Singh, G.P., et al. (2013) Factors Affecting Neonatal Mortality in Uttar Pradesh. Proceeding of Conference on Topic “Emerging Applications of Bayesian Statistics and Stochastic Modeling”, 55-65.
- 16. Ryan, T.H. (1960) Significance Tests for Multiple Comparisons of Proportions, Variances, and Other Statistics. Psychological Bulletin, 57, 318-328.
https://doi.org/10.1037/h0044320 - 17. Games, P.A. and Howell, J.F. (1976) Pairwise Multiple Comparison Procedures with Unequal N’s and/or Variances: A Monte Carlo Study. Journal of Educational and Behavioural Statistics, 1, 113-125.
https://doi.org/10.3102/10769986001002113 - 18. Richter, S.J. and McCann, M.H. (2012) Using the Tukey-Kramer Omnibus Test in the Hayter-Fisher Procedure. British Journal of Mathematical and Statistical Psychology, 65, 499-510.
https://doi.org/10.1111/j.2044-8317.2012.02041.x