American Journal of Industrial and Business Management
Vol.08 No.12(2018), Article ID:89345,16 pages
10.4236/ajibm.2018.812159
The New Driving Force of Shenzhen’s Economic Development in the New Era*
―From the Perspective of Total Factor Productivity
Yiqing Lv1,2#, Hui Peng1,3
1China Institute for Reform and Development, Haikou, China
2Shenzhen Tourism College of Jinan University, Guangdong, China
3School of Economics and Management, Shenyang Ligong University, Laolin, China

Copyright © 2018 by authors and Scientific Research Publishing Inc.
This work is licensed under the Creative Commons Attribution International License (CC BY 4.0).
http://creativecommons.org/licenses/by/4.0/


Received: November 25, 2018; Accepted: December 21, 2018; Published: December 24, 2018
ABSTRACT
In New era, Shenzhen’s economic development needs new impetus. The paper analyzes the dynamic change mechanism, regional development potential and industrial structure upgrading efficiency of Shenzhen’s economic development from the perspective of total factor productivity. First of all, the paper analyzes and collates the mechanism of the production of total factor productivity and the way to improve it. Secondly, it calculates the total factor productivity of the whole, major region and industry in Shenzhen. The results show that the growth rate of total productivity in Shenzhen is strong, and the growth rate of total factor productivity in different regions and industries is uneven and differentiated, and the driving force of total factor productivity growth in different regions and industries is not the same. According to the conclusion, some constructive policies and suggestions are put forward. The government should grasp macroscopically to improve total factor productivity accurately and efficiently, use Multi pronged approach to deepen the reform of the economic system and making up the short board of Shenzhen’s economic development, build a modern industrial system and adhere to the general direction of industrial transformation and upgrading, and do deep tillage and meticulous work to formulate policies for service industries accurately, seize the commanding heights of human capital and optimize the structure of human capital.
Keywords:
New Era, New Driving Force, TFP, Shenzhen City

1. Introduction
In the 40 years of reform and opening up, Shenzhen as a banner of China’s reform, the frontier of reform and opening up, its economic development has been at the stage of medium and high-speed, with an average growth rate of 23%, 10% higher than Guangdong Province and 14% higher than the national level (Figure 1). On the Sixth Committee held on January 12, 2018, Wang Weizhong, member of the Standing Committee of the Guangdong Provincial Party Committee and secretary of the Shenzhen Municipal Party Committee, made a government work report on behalf of the Standing Committee of the Municipal Party Committee. It is proposed that by the middle of this century, Shenzhen will become a competitive and influential innovation-leading city. However, China’s current economic development has entered a “new era” [1] , economic development is undergoing an economic restructuring and upgrading. The transformation can improve the growth mode of total factor productivity from large-scale factor investment in the past to scientific and technological innovation, economic system reform and factor endowment allocation optimization. In the 2015 “Government Work Report”, Premier Li Keqiang proposed to “increase R & D investment and increase total factor productivity”. This is not only a requirement for cultivating new kinetic energy growth, but also a necessary condition for maintaining long-term economic growth. On April 4, 2017, President Xi Jinping made important instructions on the work of Guangdong. He hoped that Guangdong will adhere to the party’s leadership, adhere to socialism with Chinese characteristics, adhere to the new development concept, adhere to reform and opening up, and promote supply-side structural reform and implementation for the whole country. Innovation drives the development strategy, builds a new open economic system, provides support, and strives to be at the forefront in building a well-off society in an all-round way and accelerating the new journey of building socialist modernization. The report of the 19th National Congress of the Communist Party of China clearly pointed out that China’s economy has shifted from a high-speed growth stage to a high-quality development stage, and is in a critical period of transforming development mode, optimizing economic structure, and transforming growth momentum. The international trade environment is more complicated, and Sino-US trade frictions and conflicts are intensifying.
Shenzhen is the birthplace of China’s reform and opening up, the core of Guangdong, Hong Kong, Macao and Dawan District construction. How to promote the supply-side structural reform and implement the innovation-driven development strategy? At the same time, Shenzhen’s economic development is also facing the problem of optimization and upgrading of industrial structure.

Figure 1. 1980-2016 Real GDP growth rates in China, Guangdong and Shenzhen. Data source: China National Bureau of Statistics.
Therefore, it is necessary to explore the new impetus of Shenzhen’s economic development in the new era. From the perspective of total factor productivity, the paper analyses the changing trend of Shenzhen’s economic growth momentum, how to coordinate regional economic development and industrial upgrading to enhance growth efficiency and the influencing factors, so as to establish a higher level national independent innovation demonstration zone for Shenzhen, and build a modern international innovation-oriented city with strong competitiveness, culture and taste, so as to make more of it. Large enterprises with international influence grow here, providing theoretical support and policy recommendations.
2. Theoretical Mechanism and the Influencing Factors
2.1. Total Factor Productivity (TFP)
Total Factor Productivity (TFP) refers to the part of output growth that cannot be explained by the increase in input of production factors. It is usually linked to factors such as technological progress, specialization and innovation. Essentially, total factor productivity is productivity that is used to measure the productivity of economic units. Total factor productivity is defined as the ratio of all output combinations to all input combinations (Li Ping, 2016) [2] , in the form:
(1)
In formula (1), TFP is total factor productivity, Output represents output, and Input represents input. Dividing the total factor productivity, output, and input versus time, and the logarithm of both sides of formula (1), there are:
(2)
Assuming that the scale of production function returns is constant, its factor remuneration is equal to its marginal output, which is defined by the Divisia Index:
(3)
The sum in Equation (3) is the share of the various types of output and factor inputs in the total value, and meets: . When considering both capital and labor input factors, formula (3) can be simplified and extended to various industries or regions:
(4)
At present, in addition to the growth of the nuclear algorithm, the total factor productivity measurement mainly includes the Solow residual method, the extended Solow residual method (Zhang & Shi. 2003) [3] , the stochastic frontier production function (SFA) method (Liu, Zhu & Lv. 2018) [4] , the data envelopment analysis (DEA) method (Cong & Han 2018) [5] , and the DEA-Malmquist index method (Chen & Ali, 2004) [6] . And the Hicks-Moorsteen index method, and the OP and LP estimation methods for measuring micro-enterprise productivity (Yang, 2015) [7] , TFP is a core indicator of productivity. Although TFP is not easy to obtain consistent calculation results, and even academically difficult to get a rigorous and clear explanation, it contains technological progress and various innovations, including management level and entrepreneurship, and human capital quality. Etc., and in the academic field, there are many relevant materials and data available. Many scholars have shown that only relying on TFP can promote sustained economic growth; some economists even believe that TFP cannot continue to improve and is a barrier to wealth (Palent, Prescott, 2010) [8] .
2.2. DEA Malmquist Productivity Index
DEA-Malmquist index (Fare et al., 1992) [9] uses the ratio of distance function to calculate input-output efficiency, which is used to evaluate dynamic productivity in different periods. Equation (5) is as follows:
(5)
In Equation (5), denotes the matrix of inputs and outputs; denote input vectors of period t and period t + 1; denote output vectors of period t and period t + 1. TEPCH, EEFCH, TECH, SECH and PTECH represented respectively the changes of total factor productivity, comprehensive efficiency, technological progress, scale efficiency and pure technological efficiency. Relationships among variables are as follows:
(6)
Therefore, . If m0 > 1, it shows that the total factor production efficiency of decision making unit has been improved; if m0 < 1, it indicates that the total factor productivity of decision making unit is decreasing and deteriorating. If a change ratio of the m0 index is greater than 1, it indicates that the change index is the root of the increase of total factor productivity, and vice versa, it will lead to its decrease.
2.3. The Path of Total Factor Productivity (TFP) Improvement
The Soro residual method under the growth accounting framework of this paper measures the TFP value and growth rate of Shenzhen. In a sense, TFP is a “black box”, although the broad definition of TFP is a technological advancement. Any unobserved factors may be attributed to the total factor growth rate. In the industry and regional TFP calculations, the study uses the DEA-MI model, which starts with the concept of the production frontier boundary surface, considers the technology and efficiency between multiple inputs and multiple outputs, and the TFP index can be decomposed into technological advances and efficiency. Technological advancement is an extrapolation and expansion of the frontier interface of production, which is manifested in the improvement of economic production capacity brought about by technological innovation. The improvement of technical efficiency is the gap between the actual production frontier interface and the potential production frontier interface, which is mainly reflected in the management efficiency of the economic unit, the economic scale and the optimization and upgrading of the organizational structure of the enterprise. Therefore, the change of total factor productivity (TFP) is mainly reflected in the two aspects of technological progress and technological efficiency improvement, while technological innovation, economic structural transformation and upgrading and deepening economic system reform are three important means (see Figure 2). Next, we will conduct in-depth discussions on specific measures affecting scientific and technological innovation, economic structural transformation and upgrading, and economic system reform from the macro, meso and micro dimensions.
From a macro level, technological innovation is the most direct means to promote technological progress. In terms of technological innovation, developed countries are at the forefront of global technology because of technological innovation. They can only continue to develop and innovate independently, while developing countries are in the stage of catching up and running. In addition to independent innovation, we can also use the technology transfer of foreign countries to improve the frontier technology level of the country through the method of “introduction-digestion-absorption-re-innovation”. So, what factors have affected the transformation of technological innovation and technological achievements? First, there is a need for sustained and adequate R & D funding, including basic research inputs and technology development inputs. The research results of systematic and organized modern research institutes all have a large amount of R & D expenditure as a guarantee expenditure (Isaksson, 2007; Syverson, 2011) [10] [11] . Second, there needs to be sufficient human capital
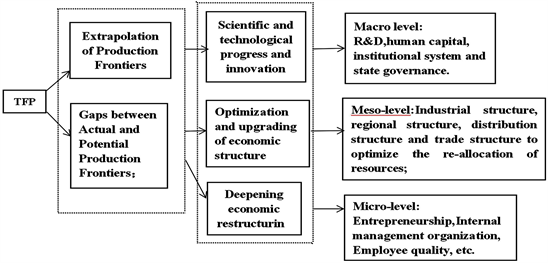
Figure 2. The path of total factor productivity improvement.
accumulation. Whether it is independent innovation or imitative innovation, it requires a large amount of human capital accumulation. Human capital is mainly reflected in the number of R & D personnel and the comprehensive quality of R & D personnel. The latter includes individual knowledge reserve, R & D experience, innovation ability, and ability to digest and absorb new technologies. Wait. Third, it is necessary to support relevant institutional mechanisms, such as research funding allocation management mechanism, income distribution mechanism, technology transfer and diffusion channels, and the improvement of intellectual property rights and legal systems (Keller and Yeaple, 2003) [12] . At the same time, the government formulates macroeconomic development strategy, optimizes and upgrades the economic structure, deepens the reform of economic system, handle the relationship between market and government to improve total factor productivity.
From the meso level, through industrial agglomeration and integration, huilding high-end instrial value chain and other industrial policies, we can improve the overall innovation ability of industry and promote the overall production efficiency of the industry. The optimization of economic structure is manifested in the improvement of technical efficiency. The structural transformation of industrial structure, regional structure, distribution structure and trade structure is used to optimize the re-allocation of resource elements and increase the utilization efficiency of factor resources. For example, the main industrial structure, the performance is rationalized and advanced in the industrial structure. From the internal perspective of the industry, it is from the low TFP industry to the TFP high industry transformation and upgrading. The regional structure mainly includes urbanization, regional coordination, and overall planning of urban and rural areas. China’s urbanization rate plays an important role in the improvement of human capital and the optimal allocation of production factors, to formulate industrial policies and optimize the competitive environment of the industrial market under the guidance of the situation.
At the micro level, manufacturers strive to improve and optimize their production activities to improve input and output efficiency and TFP growth. For example, improve the internal management organization model of the enterprise and increase the synergy between the elements by improving production management. Second, improve the quality of employees and increase enterprise R & D investment in the company. The quality of enterprise employees is an important factor in management level and technical efficiency. The improvement of enterprises’ innovation ability is directly related to enterprises’ R & D ability. Third, companies should improve the modernization of information and communication technologies. Numerous studies have shown that ICT can improve the synergy between elements and bring about TFP growth (Bartel, Ichniowski and Kathran Shaw, 2007) [13] .
3. The Trend and Analysis of the TFP in Shenzhen
3.1. The Overall Change Characteristics of TFP in Shenzhen
The report of the 19th National Congress made some remarks on the development of high quality, and proposed to promote the quality transformation of economic development, efficiency change, power change, the improvement of the quality of the supply system as the main direction, significantly enhance the economic quality of China, and upgrade the industrial structure. The new economy and new kinetic energy and technological innovation have been elaborated. High-quality economic development is also an important task for China’s economic development in the future, and high-quality development is largely due to the improvement of total factor productivity. It can be seen from Table 1 that since the reform and opening up 40 years ago, China’s economic growth rate has been positively correlated with TFP’s share of GDP, that is to say, the speed of economic growth and the quality of economic development are not mutually exclusive and mutually antagonistic, but rather Positive feedback process that promotes and influences each other.
Shenzhen’s economic growth rate has been at a relatively high level. In addition to the policy advantages and location advantages that were relied on in the early stage, after the policy advantages disappeared, the factors of high market-oriented institutional advantages and technological innovations affecting the growth of TFP are to promote Shenzhen’s economic competitiveness. Key factors (Table 2). From the perspective of the factors of production and the contribution of TFP to Shenzhen’s GDP growth rate, Shenzhen’s economic development has shifted from the early misplaced growth driven by capital investment to the innovation-driven intensive growth mode. The TFP to GDP between 2006 and 2010, the contribution of growth has exceeded the contribution of capital to economic growth. A core issue in the future is how to maintain the role of sustained TFP in economic growth. Economic growth overcomes excessive dependence on physical capital accumulation and natural resources, and increases the use of human resources, natural resources and capital, and technological progress to maintain sustained economic growth, vigorously develop the knowledge economy and circular economy, and continuously improve economic growth. The quality and efficiency of further enhancing the contribution of total factor productivity to economic growth will be an important direction for Shenzhen to become a world-class central city by the middle of the 21st century.
3.2. Characteristics and Trends of Regional TFP
The input and output data of Shenzhen and the six districts from 2000 to 2016 were used to measure and decompose the total factor productivity of Shenzhen and various regions. The original data was derived from the Shenzhen Statistical Yearbook. The calculation method is the DEA-MI model. The economic unit of Shenzhen is selected as the regional decision-making unit, and the economic panel data of the decision-making unit from 2000 to 2016 is compiled. The DEAP-MI model-specific DEAP Version 2.1 software is used, and the output-oriented method is adopted for 2000-2016. The total factor productivity of Shenzhen and the six districts is measured. The results are shown in Table 3 and Table 4. From 2000 to 2016, the average growth rate of Shenzhen TFP is 5.2%. From the decomposition results, Shenzhen TFP growth mainly benefits from science, innovation and technological advancement.

Table 1. GDP growth rate and TFP growth rate in various periods in China since the founding of the People’s Republic of China.
Source from: Perkins and Rawaki, “Predicting Economic Growth by 2025,” edited by Brandt and Roskey, The Great China Economic Transformation, Gezhi Press, 2009.
Table 2. Preliminary analysis of Shenzhen’s economic power from 1979 to 2016.
Source of data: The author calculated it himself.
Table 3. Malmquist productivity index and decomposition of shenzhen city in 2000-2016.
Data source: DEAP Version 2.1 The result of the calculation is compiled.
Table 4. Average malmquist productivity index and decomposition in various regions of shenzhen city.
Data source: DEAP Version 2.1 The result of the calculation is compiled.
It can be seen from Table 4 that the total factor productivity growth in Futian District, Nanshan District and Luohu District was mainly driven by technological innovation and technological progress during 2000-2016. Technical efficiency has a certain hindrance to TFP growth, while Longgang District and The growth of total factor productivity in Yantian District has the effect of scientific and technological progress, and technical efficiency also plays a certain role. The technological progress in Baoan District is the main driving rate of TFP. This shows that while promoting technological innovation and technological progress, Futian, Nanshan and Luohu Districts should further increase the level of scientific management, improve the utilization rate of innovative technologies, and pay attention to the role of economies of scale in the promotion of regional TFP.
It can be seen from Figure 3 that in addition to Baoan, Shenzhen has a strong positive relationship between economic growth rate and total factor productivity in other regions, which also indicates that the economic growth of various regions in Shenzhen since 2000 is mainly driven by total factor productivity. Table 5 shows the changes in total factor productivity between the six districts of Shenzhen in 2000 and 2016. In 2002, the TFP in Nanshan District and Luohu District showed negative growth, which may be related to the Internet bubble. During the 2008 financial crisis, the TFP in Luohu District and Baoan District experienced negative growth. On the whole, the financial crisis has fallen back to the TFPs in various districts of Shenzhen, but the impact is not great. At the same time, in the past two years, Nanshan District, as the core area of Shenzhen’s technological innovation, experienced a negative growth in its TFP. From 2000 to 2016, the average TFP growth rate in Shenzhen was 5.2%, Yantian District was 16.6%, Longgang District was 15.9%, Nanshan District was 9.8%, Luohu District was 8.3%, Futian District was 7.5%, and Baoan District was 4.6%.
Table 5. DEA-Malmquist composite index for shenzhen industry and segment industry.
Data source: DEAP Version 2.1 The result of the calculation is compiled.

Figure 3. Average growth rate of TFP and GDP in various districts of Shenzhen from 2000 to 20161.
3.3. The Changing Characteristics and Trends of TFP in the Industry
Based on the panel data of Shenzhen industry, service industry and sub-sectors from 2000 to 2015, DEAP2.1 software is used to measure the total factor productivity Malmquist index, technology progress index (TECH) and technical efficiency index (EFFCH). Table 5 shows the DEA-Malmquist index of Shenzhen industry and sub-sectors. It can be seen from Table 5 that from 2000 to 2015, the industrial Malmquist composite index in Shenzhen has a downward trend year by year, with an average annual increase of 5.8%. In the industry, the main manufacturing industry Malmquist composite index and industrial trends are basically the same, the efficiency has a downward trend, an average annual increase of 5.5%, while the construction industry’s production efficiency is relatively low compared to the manufacturing industry. The average growth rate in 2000-2015 is 1.5%. From 2000 to 2015, the trend of the Malmquist composite index in Shenzhen’s service industry is opposite to that of industry, with an increasing trend year by year. The average annual growth rate is 8.4%, and its efficiency is higher than that of the industry. Further, comprehensive analysis of the six major services of the Shenzhen service industry Industrial production efficiency, between 2000 and 2015, the Malmquist Composite Index for information transmission, computer services and software (II) increased by an average of 20.5% per year, showing high efficiency in the service industry. The Malmquist composite index for the wholesale and retail (SH) and financial and insurance (SF) sectors has fallen by 4% and 1.3% respectively; the Malmquist index for the remaining three services has increased, transportation, warehousing and postal services. Industry (ST) has an annual growth rate of 8.8%, wholesale and retail (SW) has an annual growth rate of 3.9%, and real estate (SE) has an annual growth rate of 5.9%.
1Note: FT, NS, LH, LG, BA and YT in Figure 3 represent Futian District, Nanshan District, Longhua District, Longgang District, Baoan District and Yantian District respectively. The data are calculated by the author.
According to the TECH index of the Malmquist index decomposition (see Table 6): Overall, the average annual growth rate of industrial technology progress during the period from 2001 to 2015 was 4.2%, while the average annual growth rate of technological progress in the service industry was 8.4%, especially at the high end. Producer services, such as transportation, warehousing and postal services (ST) and information transmission, computer services and software (II), grew by an average of 18.3% and 6.8% respectively; from the results of various sub-sectors, Shenzhen The technological progress of the manufacturing and real estate industries in the city is particularly strong, with an average annual growth rate of 7.3% and 8.4%, respectively. The technical progress of the two traditional industries of the retail, accommodation and catering industries in the service industry is slow, with an average annual increase. It is −9.1% and −8.2%. Secondly, it analyzes the technical efficiency changes of various industries and various industrial sectors. From the EFFCH index, it can be seen that the industrial technology efficiency is higher than that of the service industry. The average annual growth rate is 3.9% and 2.2%, respectively, especially the technical efficiency of the manufacturing industry. The growth rate is 5.8%. From the perspective of industry internal sub-sectors, the technical efficiency of sub-sectors has a trend of increasing year by year. Among them, the information transmission, computer service and software industry within the service industry (II) has significantly improved its technical efficiency after the global Internet bubble in 2001, when the technical efficiency growth rate was 113%, in 2014 transportation, warehousing and postal services (The technical efficiency of ST) is also growing very fast, with an annual growth rate of 152%.
Table 6. Malmquist productivity index and decomposition of industry and segment industry in shenzhen city from 2000 to 2015.
Data source: DEAP Version 2.1 The result of the calculation is compiled.
From the above analysis, it can be seen that the technical efficiency of Shenzhen’s industry is higher than that of the service industry, and the advancement of industrial technology is not as fast as the technological progress of the service industry. From the perspective of various sub-sectors, the producer service industry has a strong growth trend in technology and technology efficiency, while the technical progress and efficiency of the traditional service industry lacks motivation. The overall Malmquist composite index of the manufacturing industry has declined, but the technical efficiency of the manufacturing industry is quite effective.
4. Conclusions and Policy Suggestions
4.1. Main Conclusions
Starting from the overall total factor productivity research in Shenzhen, the TFP is measured by the growth of the nuclear algorithm and the extent of the impact of capital, labor, and total factor productivity on GDP growth is calculated. At the same time, using the DEA-MI model to measure the total factors of the six major regions and sub-sectors in Shenzhen, and to decompose the technological progress index and technical efficiency indicators that affect its changes, the following conclusions are drawn:
1) There is a strong positive correlation between total factor productivity and economic growth rate. Both China and Shenzhen have data characteristics in this respect. The overall total factor productivity of Shenzhen has increased year by year, and the growth rate has fluctuated from the early fluctuations to the current stage. In 1986, events such as Shenzhen’s fiscal adjustment, 1992 Deng Xiaoping’s southern tour speech and the 2008 financial crisis had an impact on TFP fluctuations.
2) There are differences in the growth of TFP in the six major regions of Shenzhen. Except for Bao’an District, the economic growth of other regions is also positively correlated with the growth rate of TFP. From the perspective of TFP decomposition, the growth rate of TFP in Futian District, Nanshan District and Luohu District is mainly driven by technological innovation; the growth rate of TFP in Yantian District is the result of the combination of technological progress and technological efficiency, possibly due to the higher total economy of Yantian Port. At the same time, the growth rate of TFP in Bao’an District is also driven by technological progress, but the growth rate of other five districts is slower.
3) The driving force performance of TFP in Shenzhen industry and sub-industry sector is different. The driving force of TFP in industrial sector is manifested in technical efficiency and the driving force of TFP in service sector is more in the aspect of technological progress, driven by manufacturing TFP. Force is also more technically efficient. Within the service industry, the TFP of the producer service industry is higher than that of the traditional consumer service industry, and the driving force for technological progress and technical efficiency is stronger.
4.2. Policy Suggestions
Through research and analysis, Shenzhen has entered a new era of technological innovation driving TFP growth, but there is still huge room for improvement in the technological innovation capability of some regions and industries. The key factor for promoting Shenzhen’s economic competitiveness in the future will be the total factor productivity. In combination with Shenzhen’s three-step strategy, the current Shenzhen government should focus on fostering highly market-oriented institutional advantages and cultural advantages of multiple freedoms and equality, vigorously tapping, nurturing and forming a technological innovation environment, comprehensively upgrading TFP, and forming an innovative leadership global city, the specific measures are as follows:
1) At the macro grasp, improve the total factor productivity accurately and efficiently. The improvement of total factor productivity is the main driving force for Shenzhen’s future economic growth. In response to the downward trend of total factor productivity, Shenzhen should start from the overall situation, through the deep reform of the market economic system, cultivate the soil for scientific and technological innovation, optimize the industrial structure, and give full play to reformers and reformers spirit and entrepreneurship, improve the efficiency of economic development in all directions. The original innovation ability in some areas, industries and other fields is still not strong, the basic research investment is still insufficient, and the education funds and R & D funds are invested heavily to adapt the development level of higher education and the total number of innovative talents to the needs of innovation and development.
2) Multi-pronged approach is used to deepen the reform of the economic system and fill the shortcomings of Shenzhen’s economic development. In view of the driving force of total factor productivity, it is necessary to improve the speed of industrial technological advancement, from the original imitation model to the innovation-driven transformation, and in the process of increasing the proportion of service industry year by year, it is necessary to deepen the reform of the service industry system and better release the service sector. The technical efficiency, especially in the traditional consumer service industry, requires more technological advancement and technical efficiency. We will deepen reform of the economic system, improve various incentive systems, break the constraints of irrational systems on productivity, and further highlight the contribution of organizational system innovation to economic development, correctly handle the relationship between the government and the market, improve the government’s decision-making level, clean up and optimize Shenzhen’s relevant systems, policies, and regulations, and achieve integration with international practices, so that economic activities have greater openness and freedom, and better adapt to Export-oriented economic development and overall social progress.
3) Build a modern industrial system and adhere to the general direction of industrial transformation and upgrading. Accelerate the adjustment of industrial structure, promote the vigorous development of modern service industries such as finance, information transmission, software and information services, logistics, exhibitions and tourism; foster new economy, new business and new kinetic energy, and new industries will become an important support for future economic growth. It is also the core driving force for the continued strong economic growth of Shenzhen. Strengthen the pillar position of high-tech industries, accelerate the upgrading of high-tech industries, strengthen information construction, comprehensively improve the level of urban informatization, and gradually phase out a number of labor-intensive enterprises with low added value and obvious comparative advantages, and comprehensively improve the public quality of life and the efficiency of the entire society.
4) Intensive cultivation and precise formulation of service-oriented industrial policies. In-depth understanding of the development characteristics and laws of the segmentation service industry, the development of targeted service-oriented industrial policies, promote the upgrading of traditional service industries, and improve the total factor productivity of traditional service industries. At present, the proportion of services in Shenzhen has exceeded two-thirds. It is necessary to optimize the internal structure of the service industry, increase the openness of the service industry, and increase the total factor productivity, especially in the wholesale and retail industries, accommodation and catering industries, and its total factor productivity. Has a large lifting space.
5) Seize the commanding heights of human capital and optimize the structure of human capital. Scientifically formulate real estate policies to reduce the cost of living for high-end talent. Renewing urban culture, cultural self-confidence is a powerful cohesive force for talent gathering, and must be applied to those cultures that are incompatible with the norms of modern social civilization. Improve the remuneration of workers, further strengthen the basic status of education, increase investment in education hardware and software, especially the investment level of institutions of higher learning and research institutes, absorb and introduce high-level talents, and develop vocational education and optimize economic development. In combination, we will improve the vocational skills of workers and the knowledge level of the whole society, and create a population, resources and space intensive society.
Conflicts of Interest
The authors declare no conflicts of interest regarding the publication of this paper.
Cite this paper
Lv, Y.Q. and Peng, H. (2018) The New Driving Force of Shenzhen’s Economic Development in the New Era. American Journal of Industrial and Business Management, 8, 2375-2390. https://doi.org/10.4236/ajibm.2018.812159
References
- 1. Xi Jinping Made the Nineteen Report with Live Broadcast of the Full Text. http://www.mlr.gov.cn/qrsy/zyzt/19/201711/t20171106_1670862.htm
- 2. Li, P. (2016) The Path and Influencing Factors of TFP Upgrading—Analysis of Growth Accounting and Frontiers Decomposition. Management Word, 9, 1-11.
- 3. Zhang, J. and Shi, S.H. (2003) Total Factor Productivity Change in China’s Economy: 1952-1998. World Economic Papers, 2, 17-24.
- 4. Liu, Y.M., Zhu, Y.Q. and Lv, Y.Q. (2018) Research on the Efficiency and Potentiality of Sino-Rusia Bilateral Trade under “the Belt & Road Initiative”—Based on the Stochastic Frontier Gravity Model. Reform of Economic System, 5, 78-84.
- 5. Cong, R.J. and Han, J.P. (2018) Research on Ecological Efficiency of High Energy Consumption Industry in China under New Normal of DEA Model. Ecological Economy, 34, 86-90.
- 6. Chen, Y. and Ali, A.I. (2004) DEA Malmquist Productivity Measure: New Insights with an Application to Computer Industry. European Journal of Operational Research, 159, 239-249. https://doi.org/10.1016/S0377-2217(03)00406-5
- 7. Yang, R.D. (2015) Research on Total Factor Productivity of Chinese Manufacturing Enterprises. Economic Research Journal, 2, 61-74.
- 8. Parent and Prescott (2010) The Barrier to Wealth. Renmin University of China Press, Beijing.
- 9. Fare, R., Grosskopf, S., Lindgren, B. and Roos, P. (1992) Productivity Change in Swedish Pharmacies 1980-1989: A Non-Parametric Malmquist Approach. Journal of Productivity Analysis, 3, 85-102. https://doi.org/10.1007/BF00158770
- 10. Anders, I. (2007) Determinants of Total Factor Productivity: A Literature Review. Research and Statistic Branch, UNIDO, Staff Working Paper, 02/2007.
- 11. Chad, S. (2011) What Determines Productivity? Journal of Economic Literature, 49, 326-365. https://doi.org/10.1257/jel.49.2.326
- 12. Keller, W. and Yeaple, S.R. (2003) Multinational Enterprises, International Trade and Productivity Growth: Firm-Level Evidence from the United States. NBER Working Paper No. 9504. https://doi.org/10.3386/w9504
- 13. Bartel, A., Ichniowski, C. and Shaw, K. (2007) How Does Information Technology Affect Productivity? Plant-Level Comparisons of Product Innovation, Process Improvement and Worker Skills. The Quarterly Journal of Economics, 122, 1721-1758. https://doi.org/10.1162/qjec.2007.122.4.1721
NOTES
*Fund Projects Support: China Post-doctoral Science Foundation of 63 batches of funding projects “Structural Effects of China’s Economic Fluctuation in the Context of New Era Economic Transition” (Grant No. 2018M631051); Shenzhen Philosophy and Social Sciences “Thirteenth Five-Year Plan” project “Shenzhen Total Factor Productivity Research” (No. 135B011); Young and Middle-aged Science and Technology Innovation Talent Support Program of Shenyang “Research on Measurement Methods, Influencing Factors and Development Path of Steel Indirect Export” (2017018).