Optics and Photonics Journal
Vol.06 No.08(2016), Article ID:70295,6 pages
10.4236/opj.2016.68B005
The Study of Full-Size Objects’ Bistatic Rader Cross Section Measurement Based on Photoelectric Conversion
Yilong Chen1, Tao Hong1, Zhihua Chen2
1College of Electronic and Information Engineering, Beijing University of Aeronautics and Astronautics, Beijing, China
259th Research Institute of China Ordnance Industry, Chongqing, China


Received 22 April 2016; accepted 19 August 2016; published 25 August 2016

ABSTRACT
In the past years, bistatic Radar Cross Section (RCS) characteristic has been caught increasing attention. The paper presents a bistatic RCS measurement system of full-size goals, which uses photoelectric conversion technology to solve the problem that excessive electrical signal attenuation exits because of the large distance between sending and receiving antenna. The paper analyzes the basic principle of photoelectric conversion and RCS measurement system, applies photoelectric conversion technology to RCS measurement system, and tests whether RCS measurement system works well while using photoelectric conversion technology. The test results show that the system can efficiently obtain the bistatic RCS characteristic of full-size targets.
Keywords:
Full-Size Targets, Bistatic RCS Characteristic, Photoelectric Conversion Technology

1. Introduction
The main purpose of stealth technology is to reduce the Radar Cross Section of target. Today, RCS measurement can be divided into Near-field, Outdoor-field measurement, as well as single and double station measurement. Near-field measurement as an advanced measurement technology has been widely used in radiation scattering measurements and radar target imaging. Without requiring a huge outdoor testing field, Near-field measurement can acquire a large amount of information, high precision and small interference by outside, good privacy. In addition, Near-field measurement can work around the clock and have a series of advantages such as diagnostic function [1]. Compared with the Near-field measurement, the main features of Outdoor-field measurement are: size of the object can be within a wide range; the measurement results are closer to the real situation of the target; Far-field measurement condition is easy to satisfy, and can be directly used for the acceptance of products’ electromagnetic scattering properties [2]. Because of the advantages of Outdoor-field measurement, it is now at home and abroad to build a lot of Outdoor test field, such as the US RATSCAT [3], Range 8, UK Underwood Quarry, etc. with the development of bi/multi-static radar system [4] and radar detection of hypersonic target in Near Space [5].
Bistatic RCS measurement has been gradually developing at home and abroad. Compared to traditional single-station RCS measurements, bistatic RCS measurement can simulate multi-base anti-stealth system to measure the measured target stealth performance at different pitch angle, which reflects the targets’ actual stealth performance. Thus, the bistatic RCS measurement systems have sprung up in recent years, which have been applied in the Near field and Outdoor games, and developed rapidly.
Today, the bistatic RCS anti-stealth is applied to an increasing number of occasions, for example, 52E6MU Struna-1MU/Barrier E (NNIIRT, Russia) is the proposed multistatic system that can detect against low RCS targets [6].
2. Bistatic RCS Testing System
Figure 1 is a schematic diagram of the RCS linear sweep system [7], RF signal source emits a sweep wave signal. After coupling, the signal is divided into two signals, one of which is :
:
 (1)
(1)
 (2)
(2)
 is the bandwidth of the sweep,
  is scan time,
  is the initial phase,
  is the signal amplitude. The remaining signal after amplification is transmitted out by the transmitting antenna.
One signal is received by the receiving antenna, enlarged by LNA, and become echo signal. R is the distance from the measured target to the receiving antenna, which causes time delay 

 (3)
(3)
 (4)
(4)
 is Echo signal,
  is the phase shift by target scattering,
  is the attenuated signal amplitude.
  is IF signal obtained after mixing. A is amplitude of the IF signal. By processing the IF signal, we can get the measured target’s one-dimensional, two-dimensional, and even three-dimensional image.

Figure 1. Schematic diagram of the RCS linear sweep system.
3. Photoelectric Conversion System
3.1. Theory
Figure 2 is a process of the photoelectric conversion, the modulation mode is AM modulation. Firstly, unmodulated signal can be modulated by laser source, and become modulated optical signal [8]. Then, the signal is transmitted to photo detector, demodulated and filtered. Finally, we can get the initial electric signal [9].
 (5)
(5)
 (6)
(6)
Laser source is , unmodulated signal is
 ,
,  is the amplitude of the modulated signal,
  is the frequency of the modulated signal,
  is the amplitude of the modulated signal,
  is the frequency of the modulated signal,
  is initial phase. Modulated optical signal is
 :
:
 (7)
(7)
The process of demodulation:
 (8)
(8)
 (9)
(9)
Finally, optical signal becomes electric signal :
:
 (10)
(10)
3.2. Applied to RCS
Figure 3 shows the processthat the receiving anttena’s signal transports back to the processor by photoelectric conversion systerm. Electrical signal , after modulated by the optical modulator, becomes the light signal
 . Transported by optical fiber,
  becomes the signal
 . Undemodulated by photodetection, the
light signal is converted to the electrical signal . Finally,
  is mixed with
  to get the signal
 , which is critical to RCS characteristic.
 (11)
(11)

Figure 2. Process of the photoelectric conversion.

Figure 3. Transfer chart of the received signal.
 (12)
(12)
 (13)
(13)
 (14)
(14)
 (15)
(15)
 is optical insertion loss,
  is fiber loss. The equation may also be expressed as:
 (16)
(16)
 (17)
(17)
S is light sensitivity of the detector. After filtering, signal become . After mixing, we get
 .
.  is mixer insertion loss.
 (18)
(18)
 (19)
(19)
3.3. Testing
Figure 4 is the result of phase delay. Obviously, the phase delay is linear. This result indicates that, after transmission of the photoelectric conversion system, the phase delay of the signal is linear and distortion does not happen. Figure 5 is a phase noise plot, the black broken line represents the phase noise of the original signal, red polylines indicates signal’s phase noise after transported by the system. Obviously, after transmission of the photoelectric conversion system, the phase noise of the signal does not deteriorate.
4. The Actual Test of RCS
Figure 6 is a test result of RCS characteristic. Measured object can be clearly distinguished from the background. This suggests that by applying photoelectric conversion system to the RCS, we have successfully measured objects’ RCS characteristic in Outdoor-field measurement.
5. Conclusions
By testing photovoltaic systems, we know that, transported through the photoelectric conversion transmission system, the phase and amplitude of the signal vary linearly, which guarantees the accuracy of signal transmission. At the same time, transported through the system, the changes of phase noise is within the error range.

Figure 4. The result of phase delay
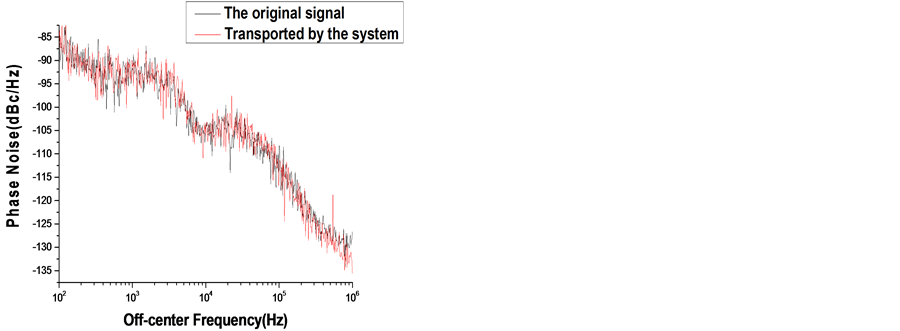
Figure 5. Phase noise plot.

Figure 6. The result of RCS characteristic.
This solves the problem of long-distance transmission of the received signal.
In a word, applying photoelectric conversion system to RCS measurement technology does solve the problem of signals’ long transmission, which makes it possible to measure full-size objects’ bistatic RCS characteristics.
Cite this paper
Yilong Chen,Tao Hong,Zhihua Chen, (2016) The Study of Full-Size Objects’ Bistatic Rader Cross Section Measurement Based on Photoelectric Conversion. Optics and Photonics Journal,06,24-29. doi: 10.4236/opj.2016.68B005
References
- 1. Zhai, W.-G. (2012). Study of Near-Field Measurement Methods for the Determination of the Scattering Characteristics of the Targets. Master, Xidian University, Xi’an.
- 2. Zhang, X.H., Peng, G., Wang, Z.R., Liu, Z.H. and Chen, X. (2010) The Design and Imple-mentation of a 2 - 18 GHz Outdoor RCS Measurement System. Application of Electronic Technique, 6, 95-98.
- 3. McCool, T.D. (1990) Analysis and Testing of a Bistatic Radar Cross Section Measurement Capability for the AFIT Anechoic Chamber. M. S. Thesis, Air Force Inst. of Tech., Wright-Patterson AFB OH School of Engineering.
- 4. Xu, X.-J. (2011) Bi/Multi-Static Radar System Based on Motion Platform and Its Key Technologies. Shipboard Electronic Countermeasure. 3rd Edition, 43-46.
- 5. Wang, L.-D., Zeng, Y.-H., Gao, L. and Lu, J. (2014) Technology Status and Development Trend for Radar Detection of Hypersonic Target in Near Space. Journal of Signal Processing, 30, 72-85.
- 6. Zikidis, K., Skondras, A. and Tokas, C. (2014) Low Observable Principles, Stealth Aircraft and Anti-Stealth Technologies. Journal of Computations & Modelling, 4, 129-165.
- 7. Shi, G. and Xue, M.H. (2012) Research on Radar Target Scattering Measurement in Vacuum Tank. Modern Electronics Technique, 35, 18-20.
- 8. An, Y.-Y., Liu, Y.-F. and Li, Q.H. (2007) Optoelectronic Technique. 2nd Edition, Electronic Industry Press.
- 9. Zeng, X.-D. (2004) Photoelectric Detaction Principle. Xidian University Press.