Journal of Software Engineering and Applications
Vol.7 No.4(2014), Article ID:44913,9 pages DOI:10.4236/jsea.2014.74027
A Novel Operational Partition between Neural Network Classifiers on Vulnerability to Data Mining Bias
Charles Wong
Theta Rhythms, LLC, Cambridge, USA
Email: ccwong@bu.edu
Copyright © 2014 by author and Scientific Research Publishing Inc.
This work is licensed under the Creative Commons Attribution International License (CC BY).
http://creativecommons.org/licenses/by/4.0/


Received 22 February 2014; revised 19 March 2014; accepted 26 March 2014
ABSTRACT
It is difficult if not impossible to appropriately and effectively select from among the vast pool of existing neural network machine learning predictive models for industrial incorporation or academic research exploration and enhancement. When all models outperform all the others under disparate circumstances, none of the models do. Selecting the ideal model becomes a matter of illsupported opinion ungrounded on the extant real world environment. This paper proposes a novel grouping of the model pool grounded along a non-stationary real world data line into two groups: Permanent Data Learning and Reversible Data Learning. This paper further proposes a novel approach towards qualitatively and quantitatively demonstrating their significant differences based on how they alternatively approach dynamic and raw real world data vs static and prescient data mining biased laboratory data. The results across 2040 separate simulation runs using 15,600 data points in realistically operationally controlled data environments show that the two-group division is effective and significant with clear qualitative, quantitative and theoretical support. Results across the empirical and theoretical spectrum are internally and externally consistent yet demonstrative of why and how this result is non-obvious.
Keywords:Machine Learning, Neural Networks, Data Mining, Data Dredging, Non-Stationary Time Series Analysis, Permanent Data Learning, Reversible Data Learning

1. Introduction
Prior research is extremely mixed in terms of demonstrating which of the many forms of neural network predictive models provides superior performance under specific laboratory data set conditions. Resolving this apparent contradiction is of great interest both to industry in their search for the appropriate technology to pursue and to academia in their search for the appropriate model to explore and enhance. This paper provides clear and potential answers to this contradiction.
The tasks are twofold: first to clarify and classify the dozens of disparate models into two main, descriptive families; and second to theoretically and empirically explore their operational characteristics in real world settings such that their past published performances become understandable and the two main family approaches become proscriptive.
In accomplishing these two tasks, this paper hopes to point out how two modeling approaches initially appearing very similar are in fact qualitatively different, with different goals, different perspectives, and potentially very different outcomes—both in terms of model operations and in terms of their ensuing spiral effects on the users.
2. A Novel Approach towards Classifying Classifiers
There are a myriad ways to classify the available neural network predictive machine-learning models ranging from date of first publication, complexity, speed, preand post-processing layers, and more. These model features are analog in nature; there are no clear-cut boundaries whereby members on one side qualitatively differ from members on the other. Any model can trade off speed performance for more complexity and higher accuracy performance and vice versa. Prior attempts at categorical subdivisions also fall short. For example, a division between instance-based lazy learning vs. generalized eager learning also captures insignificant differences since shifting the bulk of the processing towards training or testing phases is irrelevant besides needing to know which arbitrary training or testing set is larger. Similarly, localized min/max vs globalized min/max also captures ephemeral differences since even a nominally local k-NN model can simply expand k to shift from a locally dependent result to a generalized, global one.
By using real world model operational characteristics on non-stationary, heteroskedastic data, this paper categorically divides the models along a novel characteristic descriptor boundary. The two families are Permanent Data Learning and Reversible Data Learning. While they both nominally perform the same duty with nominally very similar pattern recognition and prediction mechanisms, they have subtle differences in data processing that have profound cascading effects on their users’ ensuing approaches towards predictive modeling.
2.1. Permanent Data Learning
A Permanent Data Learning (PDL) model irretrievably folds all training example data into a boundary classifier representative of neurological synaptic weights. Members include all forms of regression models, Perceptrons [1] , Support Vector Networks with any kernel [2] , Back propagation Networks [3] , Jordan Networks [4] , Elman Networks [5] , Echo State Networks [6] , and Cascade Correlation Networks [7] . The members range over five decades and include a disparate list of supervised learners, vector instance selectors, time series specialists, and self-organizing maps. The members can accommodate non-stationary time series data to greater or lesser degrees. Major processing typically occurs when encountering training data. The members can typically automatically correct for noisy data by combining or comparing them with the training set whole. All members require a fixed laboratory set of data for meta-developmental division into training and testing since their operations do not allow flexibly reversing or extracting a training example’s influence on the boundary. This concept differs from the slow or batch learning vs. the fast or online learning division since these details can be easily forced on a PDL model (e.g. a Perceptron can operate in batch or online mode) to accommodate the data without changing the permanence due to the underlying boundary-centric character.
The following equations characterize the core training and pattern storage mechanisms for regression networks, back propagation and time series derivatives, and support vector networks, respectively.
 (1)
(1)
 (2)
(2)
 (3)
(3)
The constant theme underlying Equations (1)-(3) is that all PDL model learning is operationally permanent. In Equation (1), all X-vector independent variables operate together to with the Y-vector variables to irrevocably produce the B-vector learned components. In Equation (2), all upstream  and downstream
  layer connections work together across all training data x to compress and irrevocably embed into the learned weight components,
 . In Equation (3), the sum of all training data vectors
  affects finding the saddle point,
  , and ensuing support vectors,
 ![]() , with maximum margin boundary,
, with maximum margin boundary, .
.
On encountering a new training data point for incorporation, all prior learning partitions–be they nodes, neurons, support vectors, or boundaries and margins—need to be checked and modified. This causes the PDL models to be generalized global learners. There are no means to isolate any data point, retrieve a specific pattern in memory, and encapsulate its effects on the whole. This causes the PDL models to be fixedly global learners. They have no flexibility to be otherwise. To carry out any change in the knowledge base of incorporated training data points, including adding new data or unlearning past data requires a complete destruction and recreation of a new model using the entire updated training set.
Translating this computational behavior into the physiological realm reads the PDL model as a black box, nonspecific brain. Translating this computational behavior into the cognitive realm reads the PDL as forming stereotypes. There is no ability to explain exactly why and how it generates its output classifications beyond the mechanical equations. It cannot extract which case history or precedent supports its response. It is technically very noise resistant and robust such that physical damage to any of its storage partitions leads to only commensurate degeneration across the entire network. It is operationally very noise sensitive in that a single badly positioned data point could potentially corrupt the entire system in a noisy real world environment.
2.2. Reversible Data Learning
A Reversible Data Learning (RDL) model stores all training example data into reversible and dynamic categories and classes representative of neurological cells, with a specific example including the granule cells in the hippocampal complex. Members include k-NN [8] , certain forms of a posteriori Probabilistic Neural Networks, subforms of Hidden Markov Models [9] , Cerebellar Models [10] , ARTMAP networks [11] , and Echo ART Networks [12] . The members range over two decades and include a disparate list of supervised learners, unsupervised clustering, time series specialists, and self-organizing maps. The members can also accommodate nonstationary time series data to greater or lesser degrees. Major processing may typically occur when encountering either training data or testing data. The members can typically automatically correct for noisy data by isolating them and reducing their influence. All members can accommodate the lack of exogenous laboratory division between training and testing since their dynamic category-centric approach enables forward and reverse operations. This differs from instance based-learning since members can avoid duplicate instance biases via clustering and can process when encountering training data without compromising their dynamic category-centric character.
The following equations characterize the core training and pattern storage mechanisms for ARTMAP and Echo ART network derivatives and k-NN, respectively.
 (4)
(4)
 (5)
(5)
 (6)
(6)
Equations (4) and (5) refer to ARTMAP and Echo ART networks incorporating new training data by first checking all prior learning partitions, selecting the single optimal target, and modifying only that target partition as needed. Equation (6) refers to a simple k-NN network storing the pattern for later retrieval in a group of k matches. Especially by enhancing k to include the entire set, this causes RDL models to be generalized global learners. There are several means to isolate a data partition, retrieve a specific pattern in memory, and encapsulate its effects on the whole. This allows the RDL models to be flexibly global or local learners. To carry out any change in the knowledge base of incorporated training data points, including adding new data or unlearning past data requires simply locating the optimal partition to update or extract.
Translating this computational behavior into the physiological realm reads the RDL model as a white box, specialized cerebellar or hippocampal-like structure with specifically encoded neurons. Translating this computational behavior into the cognitive realm reads the RDL as forming episodic memories available for retrieval and narration. There is full ability to explain exactly which case history or precedent supports its output decision. It is technically not very noise resistant or robust on a local scale because physical damage to a partition destroys that particular memory pattern. It is operationally very noise resistant and robust on a global scale since all other functions are completely normal and unimpaired, while impaired functions can be detected and encapsulated.
The next section discusses how models grouped into PDL and RDL families operated and performed in the prior literature.
3. Comparing Permanent Data Learning vs. Reversible Data Learning in the Literature
Hinton, Osindero, and Teh [13] use a modified derivative of a Permanent Data Learning model (PDL), a Restricted Boltzman Machine (RBM), trained on 60,000 samples of handwritten digits and tested on 10,000 reserved handwritten digit samples drawn from the MNIST data set. Their RBM provided the highest published accuracy. The RBM included a complex series of multiple hidden layers to closely fit the complexly mined data. The training data combined 440 consecutive subdivisions of 100 training samples each, with each RBM layer was trained separately in sequence on each subdivision. Additional adjustments to the RBM for fine-tuning occurred during the 10,000 remaining training samples as the validation set. Finally, a new RBM with parameters optimized over the prior training and validation trains and fixates on the entire 60,000-sample training set.
Versace, Bhatt, Hinds, and Schiffer [14] train a PDL model derivative, an Elman network, on 300 daily prices pegged to the Dow Jones Industrial Average index before testing it on 63 reserved test days. They used a genetic algorithm to stochastically assist in generating and enhancing complexity among the model parameters and the data mining. They found that the complexity-boosted parameter selection and data mining could enhance prediction accuracy on the test set.
Zhang, Jiang, and Li [15] use a PDL model, a Multi-layer Perceptron network, on seven years of daily Shanghai Composite Index data. Their heuristic enhancements to enhance the data mining included kernel smoothing and directional price change feature magnification. Their findings indicated that enhancing the data mining could significantly enhance prediction accuracy with a PDL.
Kim [16] uses a PDL model with a genetic algorithm-enhanced learning rule on seven years of daily Korean Stock index prices. For comparison, the study also used the genetic algorithm to enhance the training data mining complexity by incorporating stochastic instance selection. Their findings indicated that enhancing the data mining complexity could significantly improve performance.
Medeiros, Terasvirta, and Rech [17] use a PDL model with Lagrange Multiplier-enhanced training on 30 years of monthly Standard and Poors index prices and on 300 years of annual sunspot data. Their model setup allowed the PDL network to expand its network size like a self-organizing map, but then froze the modifications and pruned or regularized the network after the fixed training phase completed.
West, Dellana, and Qian [18] used an ensemble of Boosting and Bagging approaches with PDL models on a credit-scoring task. The test data included individual German and Australian credit scores and Standard and Poor’s corporate bankruptcy data. The features were fixed, non-time series fundamental data such as applicant balance size, loan amount, and employment status for individuals and five corporate ratios for the bankruptcy data set. The ensemble approach applied a complex series of 100 PDL models working in series to subdivide the data set into unique subsets. Using this complexity-enhanced data mining technique of manipulating the data resulted in significant improvements in credit scoring accuracy when compared to the actual, expert assigned scores.
Saad, Prokhorov, and Wunsch [19] compare Permanent Data Learning (PDL) and Reversible Data Learning (RDL) models set up and performances on daily stock prices for 10 different stocks over a one-year period. The PDL and RDL models used different approaches towards the data, with PDL being more variable and RDL being more fixed. Their findings indicated no significant differences in performances across all models, but the RDL model was simpler to set up and operate.
West [20] compared a variety of models, including PDL and RDL models on a credit-scoring test of 1000 sample applications. The features were fixed, non-time series fundamental data such as applicant balance size, loan amount, and employment status. Findings indicated that a PDL model could provide the best prediction accuracy only when enhanced in a complex mixture of experts setup with a series of data mining complexity enhancements performed on the subdividing unique subsets in the data. Otherwise, the RDL model was both simpler to set up and produced better prediction accuracy on un-mined data.
Ng, Quek, and Jiang [21] use an RDL model derivative, a Fuzzy Cerebellar Model Articulation Controller, to predict bank failures over a 21 year sample of 3655 banks in the US. Features included 9 simple annual fundamental ratios over time. Results showed the RDL model was 80% - 90% accurate in predicting bankruptcy up to two years beyond the last reported fundamental ratios.
Wong and Versace [12] compare temporal contextual enhancements to both PDL and RDL models on over 75,000 daily data points encompassing daily prices for 30 members of the Dow Jones Industrial Average. Findings indicated that while PDL and RDL models provided similar accuracy-adjusted rates of return in the same simple, controlled data environment, the RDL models were easier set up and more amenable to data neutral, context sensitivity enhancement modules with no data mining. Extending an RDL model with physiologically modeled temporal working memory yielded statistically significant performance enhancements; extending a PDL with the same yielded no significant difference.
The next section discusses a hands-on demonstration comparing a PDL and RDL model on real world data with respect to data mining complexity and bias.
4. Comparing Permanent Data Learning vs. Reversible Data Learning Empirically
The goal of this experiment is to empirically explore their operational characteristics in various real world settings with respect to varying levels of data mining complexity. The hypothesis is that PDL is more vulnerable to data mining bias with performance more correlated to data mining complexity than an RDL with 95% confidence. This would lead to a conclusion that the PDL/RDL division is qualitative and significant. This would also show that PDL models provide more incentive for users to concentrate on data mining performance gains while RDL models provide more incentive for exploring and understanding the model itself for similar gains. The null hypothesis is that there are insignificant correlation differences between the PDL and RDL model divisions on data mining complexity and the PDL/RDL division is thus not significant.
To represent the PDL family, this paper uses a typical multi-layer Perceptron [8] with 4 training nodes, 2 hidden nodes, and 1 output node with training until error stability of less than 0.001. Network size is dictated by input feature size. Varying the network structure had insignificant effects on performance. To represent the RDL family this paper uses a fuzzy ARTMAP [22] coded as per prior publication.
The universe of data includes 30 members of the Dow Jones Industrial Average with weekly-adjusted closing prices (http://finance.yahoo.com ) over 10 years (2001-2010). This encompasses 15,600 total data points. This data sample includes uptrending bull and downtrending bear states both within the index aggregate and variously within each index member. This paper uses the 10-period moving average crossover rule stock data subdivision protocol as used in [23] . This paper judges the results based on an industry standard Sharpe ratio [24] incorporating both annualized excess rate of return and the volatility or stability of returns. Transaction costs of 0.1% per round-trip position pair are included in each trade. Both the PDL and RDL representative trade constantly, resulting in a constant 5% penalty to annual returns.
To represent the data mining complexity, this paper designates four novel subdivisions in the data for exploration: No Mining, Basic Mining, Moderate Mining, Heavy Mining, and Extreme Mining. See Figure 1.
In the No Mining Case, the data is un-partitioned so as to remove all user preconceptions of the data. The models train on the first year (2001), then test on the subsequent year (2002). The models proceed to incorporate the just-tested year into their training (2001 + 2002) before testing on the subsequent year (2003). To maximally use the data, both models end with training on (2002-2010) and testing on (2001). PDL models need to self-destruct, reset, and restart training at each step. Across 30 different stocks, the PDL model generates 300 simulated runs encompassing 15,600 test points. RDL models need not restart until the final testing year (2001) reversal and thus generate 60 simulated runs incorporating 15,600 test points.
In the Basic Mining case, the data is partitioned as per standard textbook guidelines [25] . This represents where users assume the data are stationary and homogenously representative. The models train on (2001-2005) and test on (2006-2010) in a 50% partition. To maximally use the data, the models end by training on (2006- 2010) and testing on (2001-2005). Both PDL and RDL models generate another 60 simulated runs encompassing 15,600 test points.

Figure 1. Varying levels of data mining data partitioning. The No Mining shows data conditions preventing any pre-conceived assumptions. The Basic Mining shows a static training/testing split on all data, typically seen in research studies. Moderate Mining shows a 1-year forward moving window with 1-year train and 1-year test. Heavy Mining shows manually targeted train and test data known in advance to be similar. Extreme Mining shows a violation between training and testing segregation with models testing yearly on prior trained data.
In the Moderate Mining case, the data partitions into one-year forward sliding windows. This represents where users assume the data are slowly non-stationary such that adjacent years are sufficiently similar. All models train on one year and test on the subsequent year. To maximally use the data, all models end with training on (2002) and testing on (2001). Both PDL and RDL each generate another 300 simulated runs encompassing 15,600 test points.
In the Heavy Mining case, the data partitions presciently into similar predefined states. Allowing the users to peek into the future tracks downtrending state years (2001-2002 vs. 2007-2008), uptrending state years (2003- 2004 vs. 2009-2010), and non-trending state years (2005 vs 2006). In each case, the models train on the first subdivision and test on the other and vice versa. Both PDL and RDL each generate 180 simulated runs encompassing 15,600 data points. Clearly, this is the most unrealistic back-tested case where the training and testing is highly corrupted with processing focused on the user rather than the PDL or RDL model.
In the Extreme Mining case, the models purposely violate training and testing segregation by testing on prior trained data years. All models train on one year and test on the same year. This process repeats ten times, once for each year. Both PDL and RDL each generate another 300 simulated runs encompassing 15,600 test points.
This paper calculates the aggregate correlation coefficients between PDL and RDL across all 2040 simulations over the varying levels of data mining complexity. This paper also compares aggregate annual rates of return between PDL and RDL for significant differences in keeping with prior literature.
5. Results and Discussion
Figure 2 shows the comparative results between the PDL model and the RDL model over varying data mining complexities.
The PDL model benefits most with increasing data mining complexity. Under the No Mining case (annual percent rate (APR) = 2.7%, 2-tailed p < 0.01 vs. RDL), the PDL model attempts to generalize on all available past data to predict a given year. Since all financial data are notoriously chaotic, heterogeneous, and non-stationary (e.g. [26] ; [27] ; [28] ), it follows that a fixedly globalized PDL model will attempt to incorporate vast amounts of non-representative and noisy training data that may be irrelevant to the current test data. The pro-
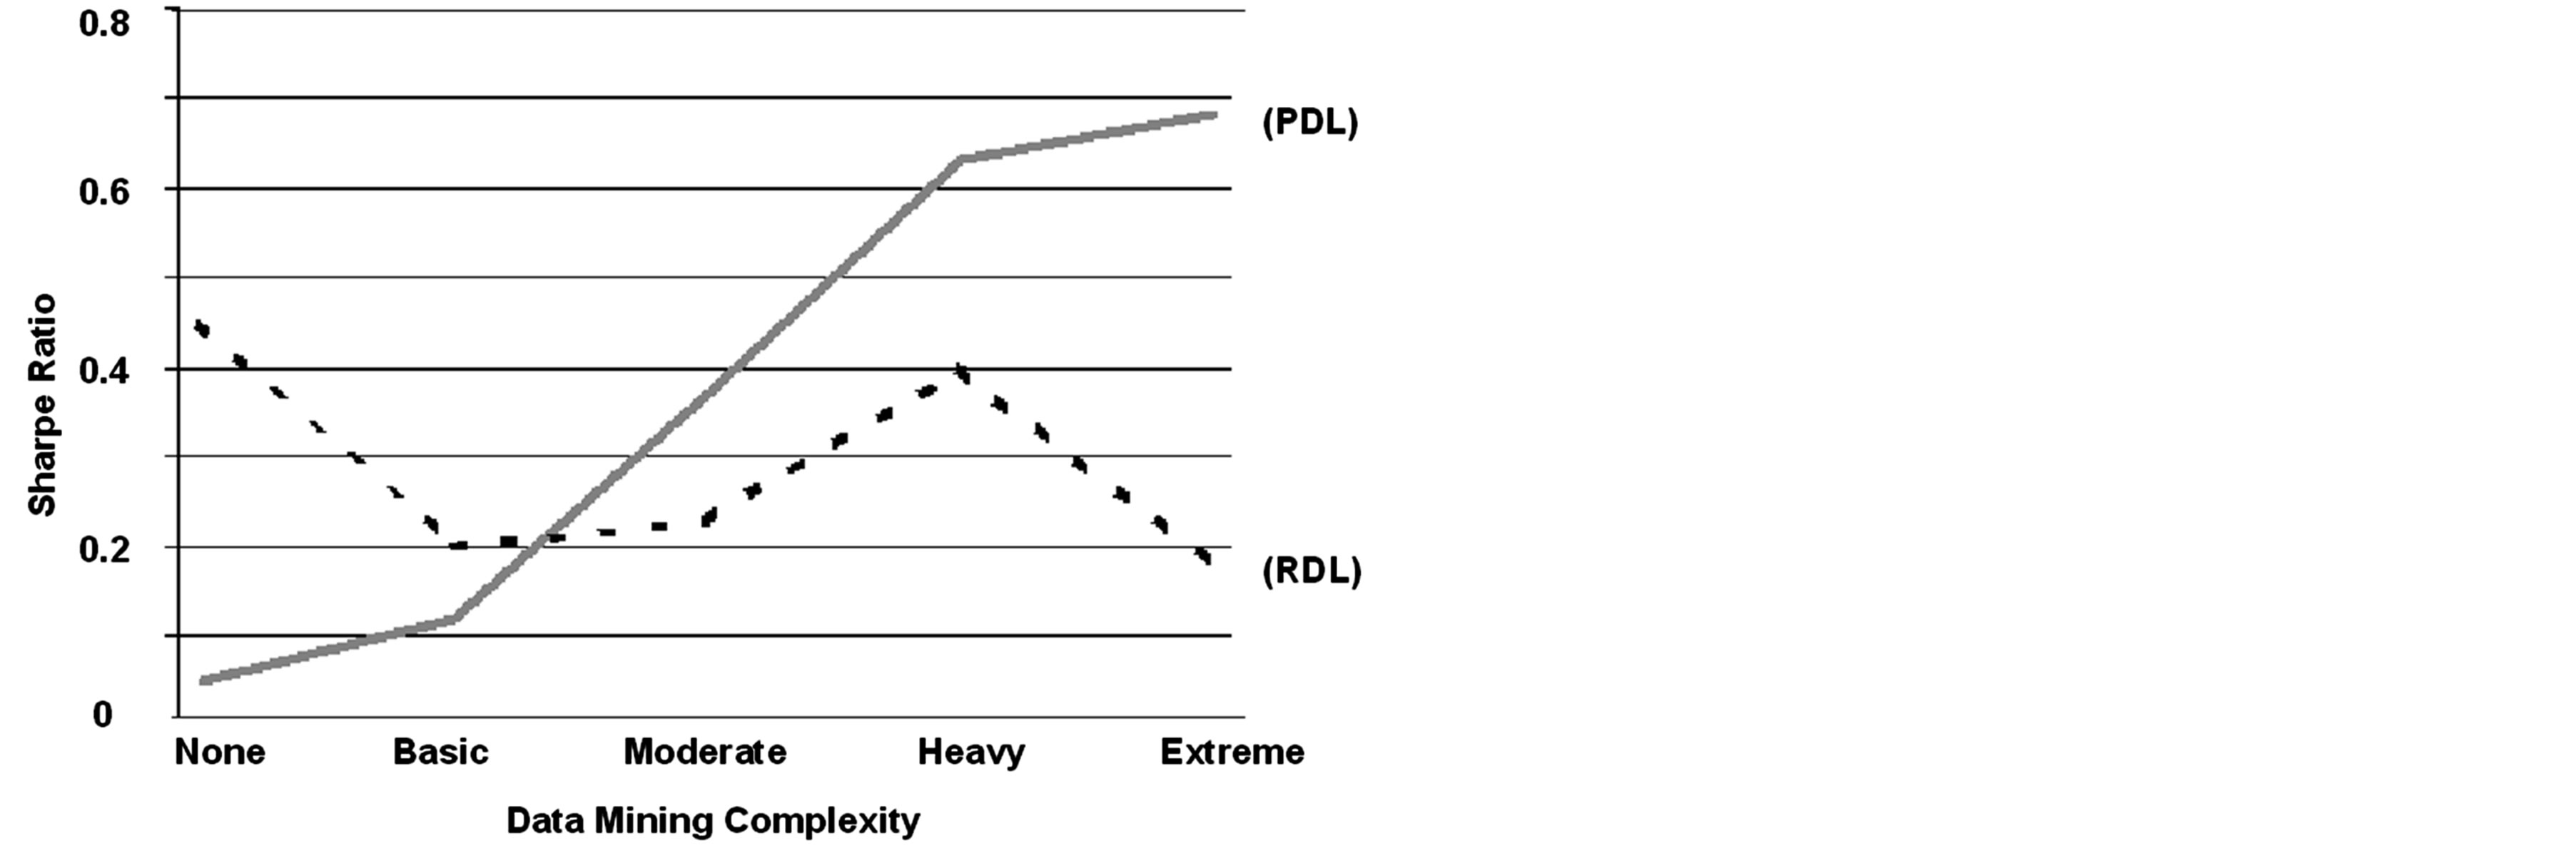
Figure 2. Comparative 10-year, 2040 simulated-run average annual accuracy-and-precision-adjusted returns (Sharpe Ratio) for Permanent Data Learning (PDL) and Reversible Data Learning (RDL) models on increasing levels of data mining complexity. Besides the data complexity levels, all else remained unchanged. The PDL performance curve is strongly positively correlated. The RDL performance curve is moderately negatively correlated. Comparative model performances were significantly different.
gression through Basic Mining (APR = 2.1%, p < 0.10), Moderate Mining (APR = 5.1%, p < 0.02), Heavy Mining (APR = 9.0%, p < 0.01), and Extreme Mining (APR = 12.2%, p < 0.01) helps greatly to clean, filter, and select the data such that it becomes stationary and noise-corrected. This allows the PDL model to attain monotonically higher performances. Under the Heavy Mining case for example, the PDL model generated the highest average feasible APR at 9.0% net of trading costs. The Extreme Mining case was not feasible, but included as a demonstration of the trend. This leads to a PDL correlation coefficient of 0.98 (p < 0.01 vs. RDL). This shows a strong incentive for the user to replicate and extend the Heavy Mining case in order to enhance a PDL model performance. The user research and development focus thus may shift exogenous to the PDL model in an attempt to limit and sanitize the data.
The RDL model benefits are unclear with respect to the data mining complexity. The Sharpe ratio performance was neither monotonic nor increasing. The RDL model performed best under the No Mining condition (APR = 6.6%, 2-tailed p < 0.01 vs. PDL) where the user is barred from introducing any preconceived notions on the data and the RDL model can make full use of all historical data in an automatically separated episodic memory manner. Progressing to the Basic (APR = 2.3%, p < 0.10) and Moderate Mining (APR = 4.3%, p < 0.02) cases only served to unnecessarily restrict the RDL model’s experiences by imposing artificial multi-year lags and restricting data access to fiveand one-year historical data periods, with greater lag and restriction resulting in worsening performance. The Heavy Mining case (APR = 5.7%, p < 0.01) performance approaches the initial No Mining performance due to its forced stationarity and larger two-year historical data periods. The Extreme Mining (APR = 3.4%, p < 0.01) case continued the decline in performance similar to the Moderate Mining case; this unusual and unintuitive trend may be due to the fact that RDL models attempt to generate episodic memory categories rather than an optimal boundary. The one-year historical data window size in each Extreme Mining case run may have severely restricted the RDL model’s ability to form sufficient separate episodic memory categories vis-à-vis the No Mining and Extreme Mining cases where much larger windows were available. The artificially shorter window sizes may have had a larger negative impact than the artificially positive impact from forced stationary data periods. This is a related operating characteristic of RDL models.
The RDL correlation coefficient showed −0.43 (p < 0.01), significantly different from the PDL. The twotailed differences in average returns were also significantly different at the 95% level between PDL and RDL in all cases except under the Basic Mining case. Partitioning the data in varying levels of data complexity clearly shows that separating the models into PDL and RDL families demonstrates significant empirical differences and is therefore an effective qualitative partition. That the PDL and RDL were not significantly different at 95% under the typically used Basic Mining case confirms the two representatives and their operations were appropriately selected and only further explained why this result was unnoticed earlier without more extensive data mining complexity analysis.
These results are also consistent with the theoretical analysis and prior literature review showing PDL models with relatively complex data and model setups (e.g. [13] -[18] ) vs. prior research methodologies using RDL models with relatively simple data and model setups (e.g. [12] , [19] -[21] ). The theoretical and empirical results could help explain and confirm that published users of PDL and RDL models already diverge in their research and development methodologies.
The resulting cognitive impacts of this among the users and researchers cannot be overstated. Neural network models rely on the users to provide the training data for exposure and produce results that subtly train the user as to the next steps in the user-network interaction. As the users train the network, so too might the network train the user.
6. Concluding Remarks
A mass of prior research explores a variety of neural network and machine learning predictive models all with varying relative performances where comparable. Prior attempts to quantitatively and qualitatively isolate and extract utility from among this pool have heretofore been wanting. This paper proposed dividing the model population into two families along a novel boundary line—Permanent Data Learning (PDL) and Reversible Data Learning (RDL)—based on operational and theoretical experience with real world data environments. It further proposes demonstrating the differences in behavior along a novel dimension—increasing levels of data mining complexity towards the prescient, exogenous user. The results show that PDL and RDL models are qualitatively and quantitatively different when viewed through the lens of real world data environments along this dimension. The PDL-RDL family grouping is effective and immediately lends itself to qualitative and quantitative behavioral differences that can greatly help industrial users and academic researchers select appropriately for utility and modeling.
PDL models are highly responsive to more complex data mining and so can theoretically produce better statistical machine learning results that can be misleading and less robust in dynamic, non-stationary, real world environments. Long-term PDL users may be increasingly subtly trained to rely on more complex, exogenous data mining complexity in pursuit of short-term, stationary results on known, laboratory datasets as indicated by strong theoretical support incentives and by reviewing the literature. RDL models are unresponsive to complex data mining and produce socially and cognitively plausible approaches towards the unknown in realistic decision making. Long-term RDL users may have incentive to focus on data-neutral, model-centric approaches to research and development enhancements.
References
- Rosenblatt, F. (1958) The Perceptron: A Probabalistic Model for Information Storage and Organization in the Brain. Psychological Review, 65, 386-408. http://dx.doi.org/10.1037/h0042519
- Cortes, C. and Vapnik, V. (1995) Support-Vector Networks. Machine Learning, 20, 273-297. http://dx.doi.org/10.1007/BF00994018
- Rumelhart, D., Hinton, G. and Williams, R. (1986) Learning Internal Representations by Error Propagation, Parallel Distributed Processing: Explorations in the Microstructure of Cognition. Vol. 1, Foundations, MIT Press, Cambridge.
- Jordan, M.I. (1986) Serial Order: A Parallel Distributed Processing Approach. Institute for Cognitive Science Report 8604, University of California, San Diego.
- Elman, J. (1990) Finding Structure in Time. Cognitive Science, 14, 179-211. http://dx.doi.org/10.1207/s15516709cog1402_1
- Jaeger, H. and Haas, H, (2004) Harnessing Nonlinearity: Predicting Chaotic Systems and Saving Energy in Wireless Communication. Science, 304, 78-80. http://dx.doi.org/10.1126/science.1091277
- Fahlman, S. and Lebiere, C., (1990) The Cascade-Correlation Learning Architecture. In: Duda, R., Hart, P. and Stork, D., Eds., Advances in Neural Information Processing Systems 2, Morgan Kaufmann, Pattern Classification, Wiley-Interscience, Hoboken, 524-532.
- Duda, R., Hart, P. and Stork, D. (2001) Pattern Classification. Wiley-Interscience, Hoboken.
- Rabiner, L. and Juang, B. (1993) Fundamentals of Speech Recognition. Prentice Hall, Upper Saddle River.
- Albus, J. (1975) A New Approach to Manipulator Control: The Cerebellar Model Articulation Controller (CMAC). Transactions of the ASME Journal of Dynamic Systems, Measurement, and Control, 97, 220-227.
- Carpenter, G. and Grossberg, S. (2003) Adaptive Resonance Theory. In: Michael, A.A., Ed., The Handbook of Brain Theory and Neural Networks, 2nd Edition, MIT Press, Cambridge, 87-90.
- Wong, C. and Versace, M., (2011b) Context Sensitivity with Neural Networks in Financial Decision Processes. Global Journal of Business Research, 5, 27-43.
- Hinton, G., Osindero, S. and Teh, Y. (2006) A Fast Learning Algorithm for Deep Belief Nets. Neural Computation, 18, 1527-1554. http://dx.doi.org/10.1162/neco.2006.18.7.1527
- Versace, M., Bhatt, R., Hinds, O. and Schiffer, M. (2004) Predicting the Exchange Traded Fund DIA with a Combination of Genetic Algorithms and Neural Networks. Expert Systems with Applications, 27, 417-425. http://dx.doi.org/10.1016/j.eswa.2004.05.018
- Zhang, D., Jiang, Q. and Li, X. (2005) A Heuristic Forecasting Model for Stock Decision Making. Mathware and Soft Computing, 12, 33-39.
- Kim, K. (2006) Artificial Neural Networks with Evolutionary Instance Selection for Financial Forecasting. Expert Systems with Applications, 30, 519-526. http://dx.doi.org/10.1016/j.eswa.2005.10.007
- Medeiros, M., Terasvirta, T. and Rech, G. (2006) Building Neural Networks for Time Series: A Statistical Approach. Journal of Forecasting, 25, 49-75. http://dx.doi.org/10.1002/for.974
- West, D., Dellana, S. and Qian, J. (2005) Neural Network Ensembles for Financial Decision Applications. Computers and Operations Research, 32, 2543-2559. http://dx.doi.org/10.1016/j.cor.2004.03.017
- Saad, E., Prokhorov, E. and Wunsch, D. (1998) Comparative Study of Stock Trend Prediction Using Time Delay, Recurrent and Probabilistic Neural Networks. IEEE Transactions on Neural Networks, 9, 1456-1470. http://dx.doi.org/10.1109/72.728395
- West, D. (2000) Neural Network Credit Scoring Models. Computers and Operations Research, 27, 1131-1152. http://dx.doi.org/10.1016/S0305-0548(99)00149-5
- Ng, G., Quek, C. and Jiang, H. (2008) FCMAC-EWS: A Bank Failure Early Warning System Based on a Novel Localized Pattern Learning and Semantically Associative Fuzzy Neural Network. Expert Systems with Applications, 34, 989-1003. http://dx.doi.org/10.1016/j.eswa.2006.10.027
- Carpenter, G., Grossberg, S., Markuzon, N., Reynolds, J. and Rosen, D. (1992) Fuzzy ARTMAP: A Neural Network Architecture for Incremental Supervised Learning of Analog Multidimensional Maps. IEEE Transactions on Neural Networks, 3, 698-713. http://dx.doi.org/10.1109/72.159059
- Wong, C. and Versace, M. (2012) CARTMAP: A Neural Network Method for Automated Feature Selection in Financial Time Series Forecasting. Neural Computing and Applications, 21, 969-977. http://dx.doi.org/10.1007/s00521-012-0830-8
- Sharpe, W. (1994) The Sharpe Ratio. Journal of Portfolio Management, 21, 49-58. http://dx.doi.org/10.3905/jpm.1994.409501
- Witten, I. and Frank, E. (2002) Data Mining. Morgan Kaufman Publishers, San Francisco.
- LeBaron, B. (2002) Short-Memory Traders and Their Impact on Group Learning in Financial Markets. Proceedings of the National Academy of Sciences, 99, 7201-7206. http://dx.doi.org/10.1073/pnas.072079699
- Hussain, A., Knowles, A., Lisboa, P. and El-Deredy, W. (2008) Financial Time Series Prediction Using Polynomial Pipelined Neural Networks. Expert Systems with Applications, 35, 1186-1199. http://dx.doi.org/10.1016/j.eswa.2007.08.038
- Bodyanskiy, Y. and Popov, S. (2006) Neural Network Approach to Forecasting Quasi Periodic Financial Time Series. European Journal of Operational Research, 175, 1357-1366. http://dx.doi.org/10.1016/j.ejor.2005.02.012