Smart Grid and Renewable Energy
Vol.4 No.3(2013), Article ID:33413,9 pages DOI:10.4236/sgre.2013.43036
High Impedance Fault Detection of Distribution Network by Phasor Measurement Units
![]()
Department of Electrical and Computer Engineering, Shahid Beheshti University (SBU), Tehran, Iran.
Email: mo.monfared@sbu.ac.ir, h_kazemi@sbu.ac.ir, h.ashrafi@sbu.ac.ir, mi.monfared@iran-transfo.com
Copyright © 2013 Mohsen Ghalei Monfared Zanjani et al. This is an open access article distributed under the Creative Commons Attribution License, which permits unrestricted use, distribution, and reproduction in any medium, provided the original work is properly cited.
Received November 18th, 2012; revised January 2nd, 2013; accepted January 11th, 2013
Keywords: Fault Detection; High Impedance Fault; Phasor Measurement Units
ABSTRACT
This paper proposes a new algorithm for High Impedance Fault (HIF) detection using Phasor Measurement Unit (PMU). This type of faults is difficult to detect by over current protection relays because of low fault current. In this paper, an index based on phasors change is proposed for HIF detection. The phasors are measured by PMU to obtain the square summation of errors. Two types of data are used for error calculation. The first one is sampled data and the second one is estimated data. But this index is not enough to declare presence of a HIF. Therefore another index introduces in order to distinguish the load switching from HIF. Second index utilizes 3rd harmonic current angle because this number of harmonic has a special behaviour during HIF. The verification of the proposed method is done by different simulation cases in EMTP/MATLAB.
1. Introduction
High-impedance faults on distribution feeders are abnormal electrical conditions that cannot be detected by conventional protection schemes because of the low fault current due to the high impedance fault at fault point. These faults often occur when an overhead conductor breaks or touches a high impedance surface such as asphalt road, sand, cement or tree and pose a threat on human lives when neighbouring objects become in contact with the line’s bare and energized conductors.
HIF can occur in two cases. In one case, a conductor breaks and fall to ground and fallen phase current decreases and protection relays cannot detect fault because current is not more than setting current of relays. In other state conductor isn’t break but it touches a high impedance thing such as tree limbs. In this state feeder current increase but it is not enough to detect by conventional protection relay. Therefore this type of fault is very difficult to detect also it is very dangerous for human life and necessary to detect.
So far, many models have been proposed to show high impedance faults features such as nonlinearity, asymmetry and the low frequency of HIF current. In 1990, a model for HIF is proposed which is based on arc nature when a Conductor breaks or touches a high impedance thing. This model is obtained from laboratory measurements and theoretical components [1]. A model Using Two Series Time-Varying Resistances was proposed in 2001 [2]. In 2004, a model was proposed in which two inverse diodes, dc source and resistance were used for modeling. The resistance and dc source changed every half cycle to show asymmetrical current of HIF [3]. A model based on dynamic model of arc was presented in 2008 [4]. Based on Emanuel model, a model was proposed in 2010 [5] to show more features of HIF. This model shows that when a broken conductor falls on earth, some arcs occur. These arcs have been shown by several parallel of Emanuel model. Therefore, it is necessary to have a perfect model of HIF to accurately detect it.
In the past two decades many techniques have been proposed to improve the detection of HIFs in power distribution systems. They can be roughly divided into two groups: time domain algorithms and frequency-domain algorithms.
In the time domain, a ratio ground relay, a proportional relay algorithm [6,7] and a smart relay based on timedomain feature extraction [8] have been proposed.
In the frequency domain, using Fourier transforms, several articles have been published based on harmonic components [3-9], inter harmonic component [10] and high-frequency spectral [11].
Because wavelet methods analyse the transient behaviour of a signal in time and frequency domains, the wavelet transform has been proposed recently to achieve a better solution in HIF detection [12].
Previous researches show that low frequency very affected when a HIF occurred on distribution feeder, HIF detection is done by notice to change of 3rd harmonic [13,14] by increase of application of phasor measurement units in reliability and protection of power system a method for HIF detection published in our previous research [15].
This paper proposes an algorithm for detection HIFs based on changing of current phosors during the transient states. Two indexes for detection of fault are utilized.first index detects increase or decrease in amplitude of faulted phase current during HIF. But it is not enough and another index introduces to recognize normal condition such as load switching from HIF.
The remainder of this paper is organized as follows: Section 2: Transient response of PMUs. Section 3 derived HIFs detection index in detail .simulation of a distribution network in EMTP and Evaluation of HIF detection method are presented in Section 4. Conclusion is drawn in Section 5.
2. Transient Response of PMUs
In this paper data that is obtained from PMU is used to detect HIFs. Therefore it is necessary to study Transient response of PMUs.
There are transient phenomena occurring on power systems due to a variety of causes which produce transient components in current and voltage waveforms. PMU calculates phasors from sampled data continuously, and it is certain that some of these phasor estimates will involve sampled data containing transient components.
In this paper the nature of PMU response to power system transients is investigated. To consider the transient response of a PMU, we must consider the chain of components in the signal path from the power system up to the phasor output delivered by the PMU. Principal elements of this chain are shown in Figure 1. Power system transients result from faults, switching operations, and relative movement of large generator rotors. These sources of transients are represented symbolically in Figure 1.
The voltages and currents of the power system are converted to lower-level signals by current and voltage transformers (instrument transformers). The signals are then processed by analog and digital filters serving the purpose of surge suppression, anti-aliasing filtering, and
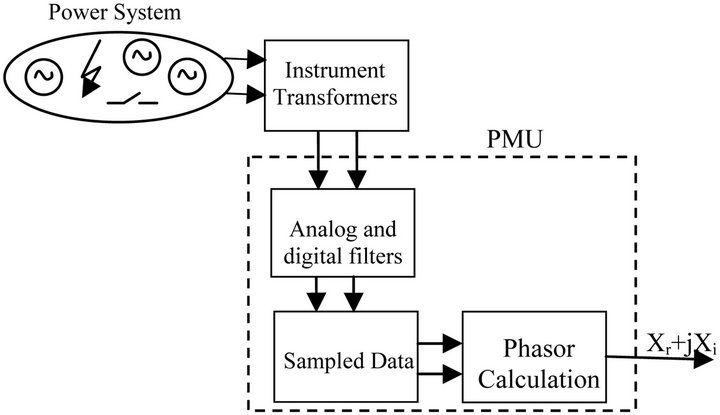
Figure 1. Generation and passage of transient phenomena from power system to the output of the PMU.
decimation filtering as appropriate. The filtered signals are then sampled before phasor computation is performed in the PMU processor. Each of the components identified in Figure 1 affects the transient waveforms and therefore the final phasor output produced by the PMU.
It is worthy to note that high-frequency transients will be removed from PMU inputs by the filtering stage. What remains important for our consideration is the effect of step changes in voltages and currents brought about by faults and switching operations. Using the recursive phasor estimation process [16] with one cycle data window, the phasor estimate of the pre-fault waveform would be obtained in data windows which contain only the pre-fault data. This is illustrated by data windows 1, 2, and 3 in Figure 2. The corresponding phasor is X1 in Figure 2. When the data window is fully occupied by post-fault data as with windows N and N + 1 in Figure 3 the phasor estimate becomes X2 for all succeeding windows. However, while the windows contain both the preand post-fault data as with windows 4, 5, 6, … , the phasor estimate travels along a trajectory from X1 to X2 as shown in Figure 2. These phasor values are not representing the state of the power system, and must be discarded in application of the phasor data.
Therefore an algorithm presents to detect transient states such as switching and faults particularly HIF because this type of fault cannot be detected by overcurrent protection relays.
Finally it should be noted that performance of PMUs should be evaluated by testing procedure. Test procedure helps us to have better results and close to reality measurements of PMU. Using this procedure test signals can be compared with the results from the PMU. For development of a great variety of applications based on PMU the user should be able to generate all possible signals which the PMU could receive. By the comparison of the signal and the phasors provided by the PMU it is possible to evaluate the measurement of the PMU.
The general procedure of PMU testing is depicted in Figure 3. In this method important factors of PMUs per
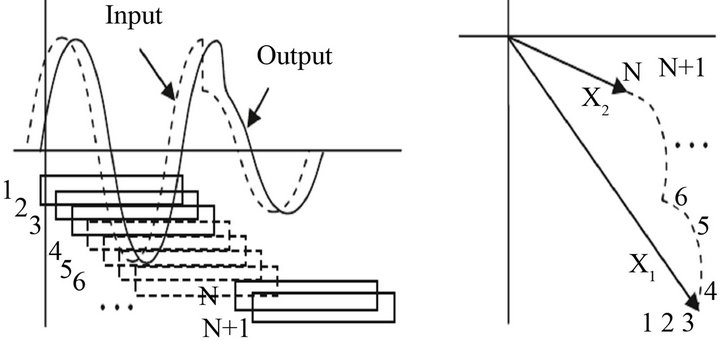
Figure 2. Response of PMU to step changes in input signals due to faults or switching operations.
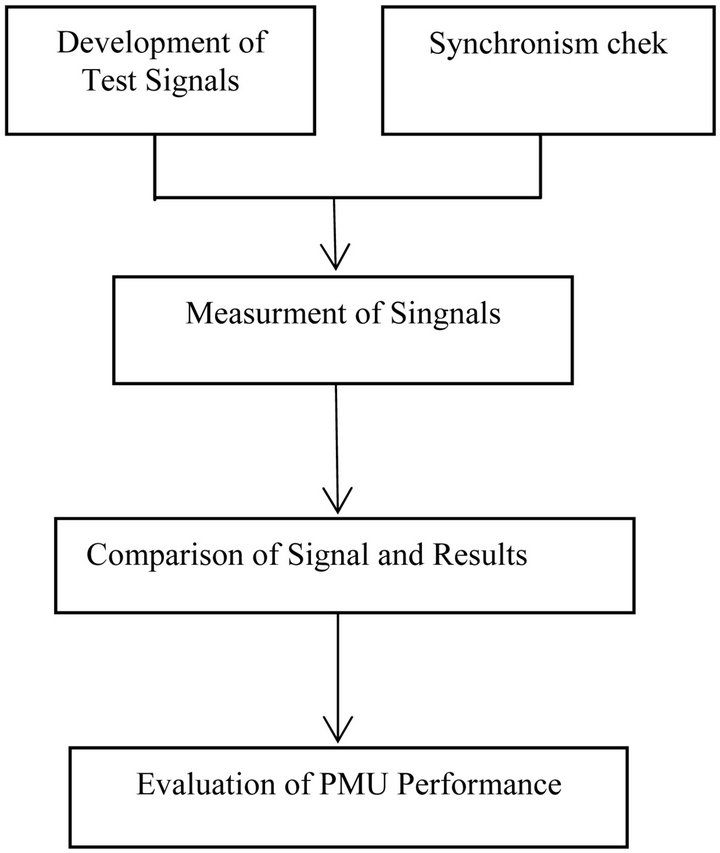
Figure 3. Testing procedure of PMUs.
formance such as time synchronization is considered. The measurements of the PMUs are synchronized by the Pulse per Second (PPS) provided by GPS. In addition PMU require time information for time stamping of the results. Details of test procedure are explained completely in Ref. [17].
3. Proposed Method
Proposed method is divided to two parts: at first change of current phasor detect by PMU and it can be consider for a factor of presence of HIF then HIF detect with use of 3rd harmonic angle.
3.1. Detection of Current Changing
When HIF occurs, depends on type of fault feeder current increase or decrease. If conductor fall onto ground current decrease but if conductor don’t break and just touch high impedance things, feeder current increase. Both of them illustrate in Figures 4(a) and (b).
This paper presents an algorithm to detect this change. It is based on errors between samples and estimated samples that are obtain from PMU phasors. This process is as
 (a)
(a) (b)
(b)
Figure 4. (a) HIF current for broken conductor; (b) HIF current for unbroken conductor.
follows:
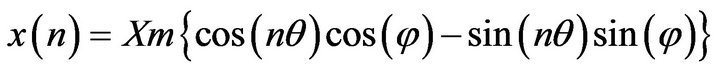
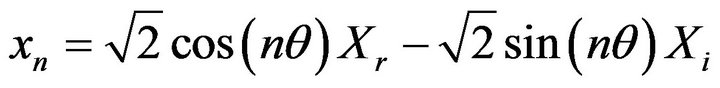
Consider a sampled signal with N samples in one cycle:
 (1)
(1)
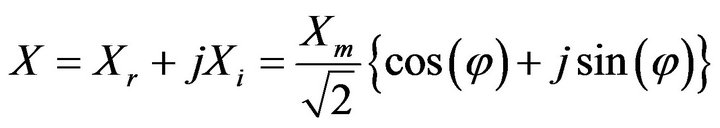
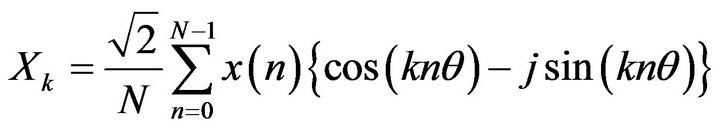
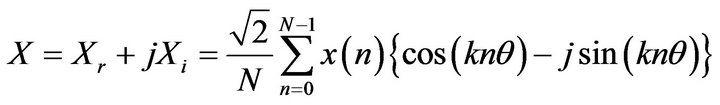
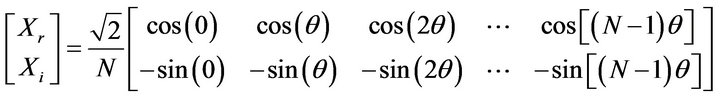
Xm is the maximum value of signal and θ is sampling angle that is equal with 2π/N. Phasor of this signal is:
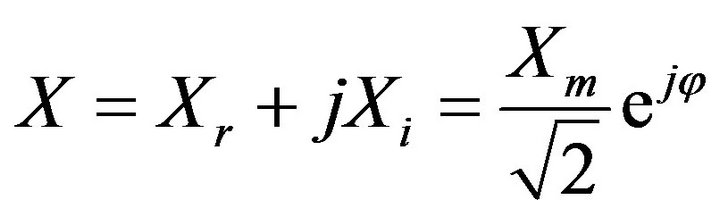 (2)
(2)
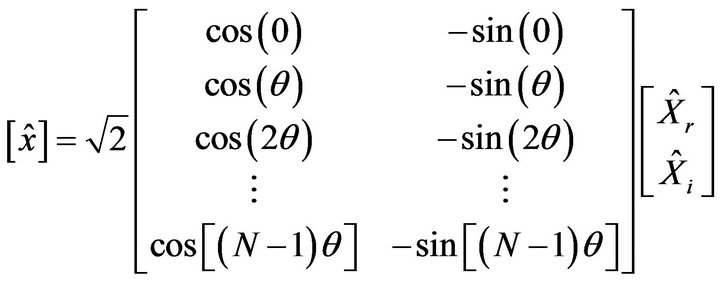
By simplifying of Equation (1) and substituting Equation (2) in it, estimated samples can be obtained from output phasors of PMU.
 (3)
(3)
 (4)
(4)
 (5)
(5)
When a fault occurs on the power system, there is a series of data windows which contain preand post-fault data. This is illustrated in Figure 5.
It should be clear that although a phasor estimate will be available for all data windows (including the ones that are shaded in Figure 5). Only phasors which belong entirely to the preor post-fault periods are of interest. The phasors computed for the shaded windows of Figure 5 do not represent any meaningful system state, and a technique is needed to detect the occurrence of mixed states within a data window. A technique is proposed to provide a measure to indicate a quality of the estimate, and can also be used to detect the condition when a data window contains mixed-state waveforms.
In condition without fault, estimated samples that are obtained from PMU phasors are equal with real samples. But when a fault occurs, and data window had faulted samples, phasors change and estimated samples will be different from real samples. This error shows that fault has occurred in the system. This method can be used to detect fault and it will be explain by formula in detail.
The data samples  in a window from the estimated phasor which has been estimated from a sample set
 :
:
 (6)
(6)
 and
and  obtain from real samples by DFT of sampled signal [15]. And it is showed in Equation (7).
 (7)
(7)
For fundamental frequency .
.
 (8)
(8)
 (9)
(9)
By multiplying the matrices in Equation (6) and Equation (7) and simplifying:
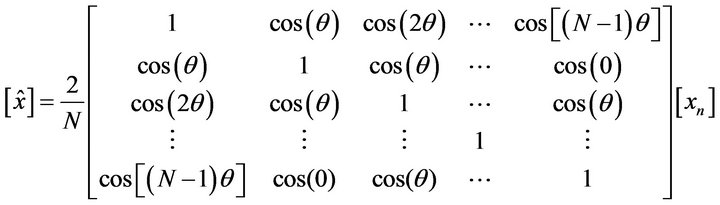 (10)
(10)
where use has been made of the fact that . The difference between the input data and the recomputed sample data from the phasor estimate is the error of estimation tn:
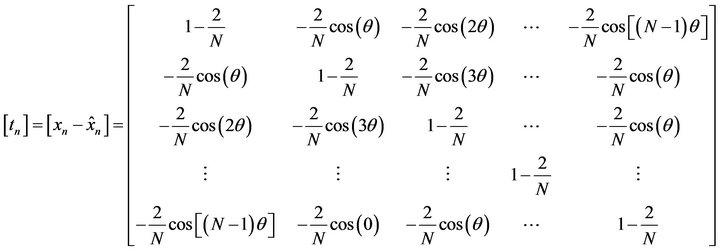 (11)
(11)
If the input signal is a pure sinusoid at fundamental frequency, all entries of tn will be identically equal to zero. However, when the input signal is noisy or contains a composite window of two different sinusoids, tn is not Zero and one may use the sum Tn of the absolute values of its elements as a measure of the error of estimation:
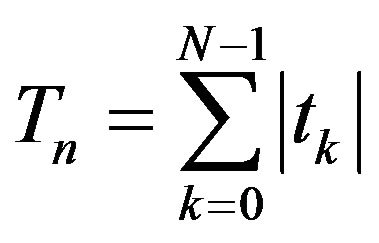 (12)
(12)
This sum can be used as a measure of the quality of the phasor estimate and detection of fault. Fault detection index (T) influence from number of samples in a cycle
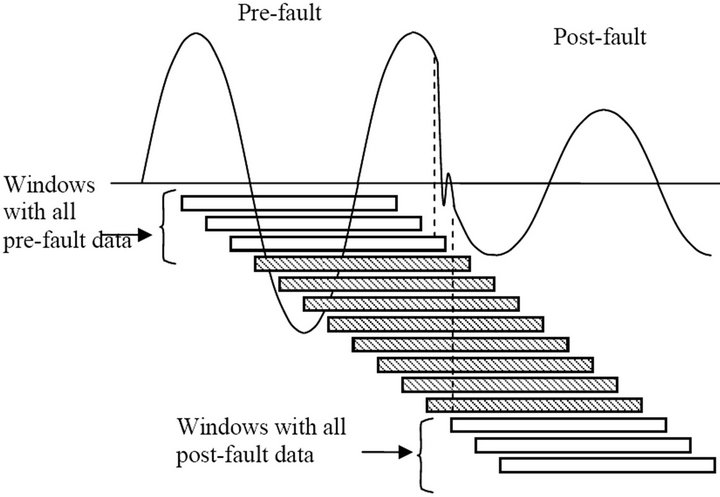
Figure 5. Transition from pre-fault to post-fault waveforms. The shaded windows contain mixed waveform data.
because it results from summation of errors between samples and estimated samples. Therefore if there is a noise in system, estimated samples are different from real samples and fault detection index increases. Now whatever sampling frequency be higher, number of summation will be more and fault detection index increases more and it will make us confuse that this is fault or nofault condition .therefore we should determine a Tthreshold that it depends on sampling frequency. Also when a change such as load switching occurs in system, fault detection index increases and it will be converge to another constant value. In new state if a change occurs in line current, fault detection index should be compared with last value of T instead of zero. With this work we can change setting of relays and make an adaptive protection with PMU in the station.
3.2. Analyse of 3rd Harmonic Phasor
In second step, algorithm proposed an index in order to distinguish normal condition such as load change from HIF pervious research shows that 3rd harmonic phasor very affected when a HIF occurred and it will arrive to a number between 50, 90 degree. This happens after 0.02 sec. Harmonic phase angel is measured with respect to system voltage, not with respect to load current. Also feeder current and voltage phase will be in same phase after HIF.
With these explanations, in this paper an algorithm is proposed for detection of HIF as follow:
A microprocessor is put in PMU that it uses fundamental phasor and 3rd harmonic phasor to detect HIF. And it can send trip to center when PMU send their data. Depend to PMU model it sends its information every 1 per 1cycle or 1 per 2 cycle or 1 per 5 cycle therefore PMU is not suitable for fast fault and it can use for back up protection and faults that time is not important .
Flowchart of detection and location of HIF depicted in Figure 6 all of explanation verified in next part with simulation of a distribution network in EMTP.
4. Simulation and Evaluation
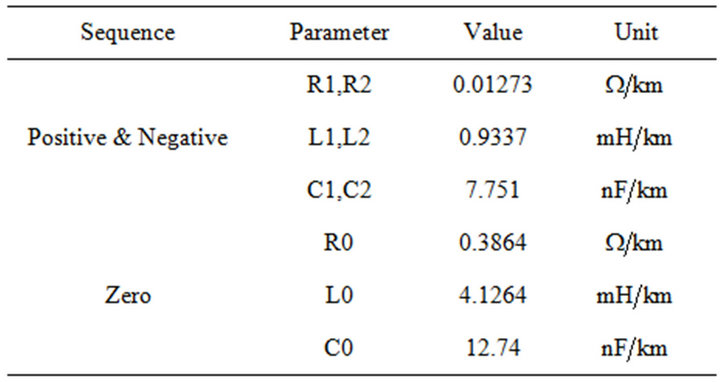
To evaluation method of HIF detection, a model based on Emanuel model for HIF is utilized in this paper [18], which is depicted in Figure 7. Depends on ground of fault, current changes between 0 and 100 Amp and it obtains with change of Emanuel parameters. A list of Emanuel parameter that is result from practical test [19] is brought in Table 1.
Simulation of HIF in a Distribution Network
In this section, data in Table 1 are used to simulate a HIF in a distribution feeder that is shown in Figure 8. The network parameters are brought in Appendix.
Simulation is divided to three cases. At first, phase
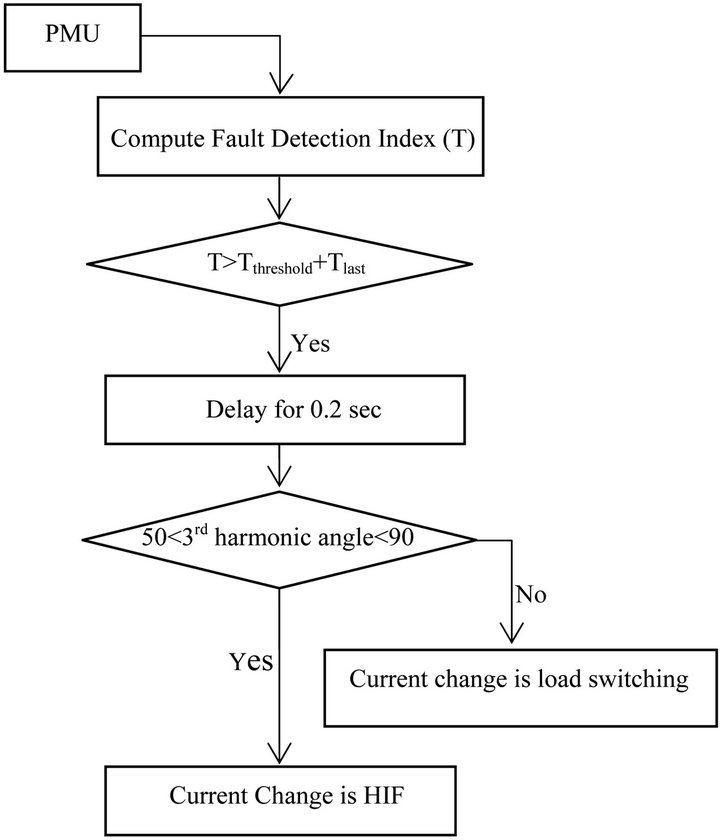
Figure 6. HIF detection diagram.
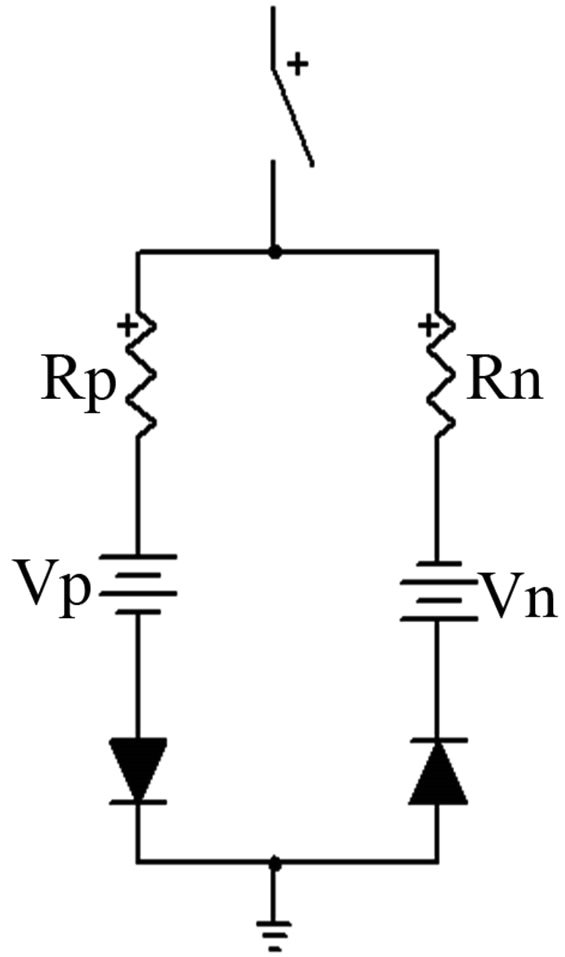
Figure 7. Emanuel model for HIF.
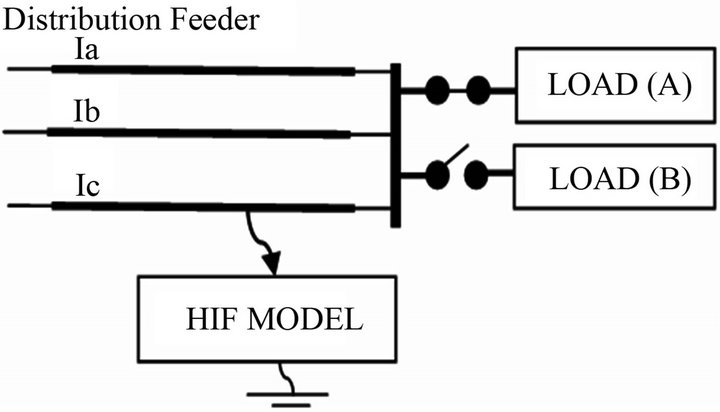
Figure 8. Distribution network with HIF.
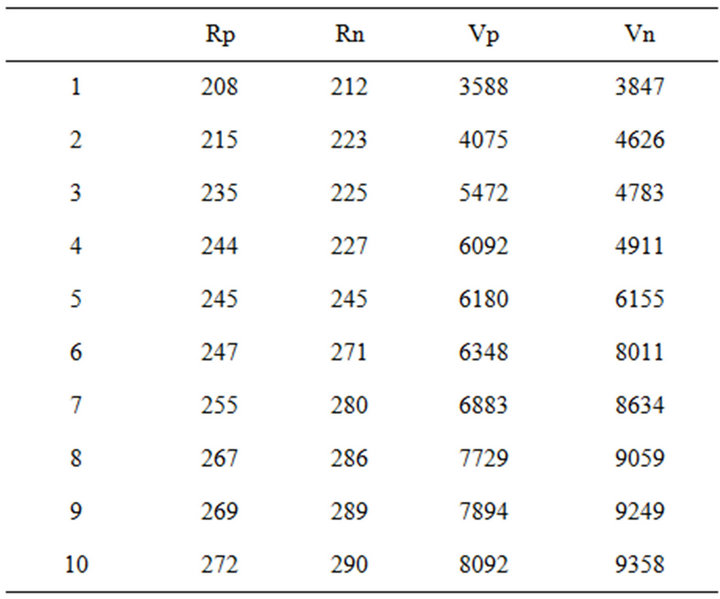
Table 1. Value of Emanuel model parameter.
don’t break and just touch a high impedance thing such as tree limb but in second case one phase beaks and fall to ground. In both case, HIF distinguish from normal switching. In third case, load switching and HIF occurred. These cases are summarized in Table 2.
Fault time is selected by notice to this point that arcs current of HIF takes about 200 - 500 ms and nonlinear behavior of it, is considerable during this time.
Case A:
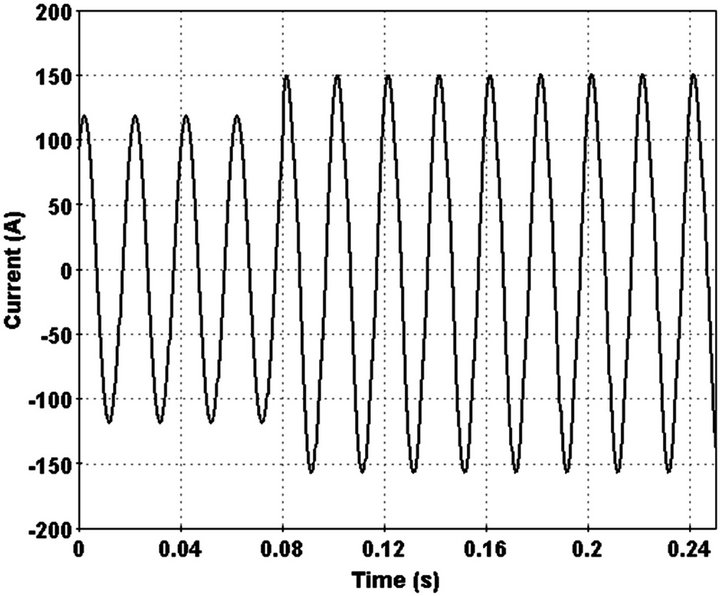
In this case one phase of overhead line touches a high impedance surface at 15 km of feeder and a HIF occurred. Current in faulted line a little increase (Figure 9). Increase in phase current detects by index that is explained in pervious section. HIF occurred in 0.08 sec and index detects it at the same time (Figure 10). After this step 3rd harmonic phasor is used for certain this change is HIF. This is recognized after 0.02 sec because 3rd harmonic arrived to a constant number between 50 and 90.this is illustrated in Figure 11.
In order to distinguish HIF from normal condition such as load switching, a load is added to end of feeder instead of HIF. In this state, 3rd harmonic don’t converge to a constant value therefore PMU recognize it is not HIF. Feeder current and 3rd harmonic phase change in this load switching, is shown in Figures 12 and 13 respectively.

Figure 9. Current waveform in faulted phase.
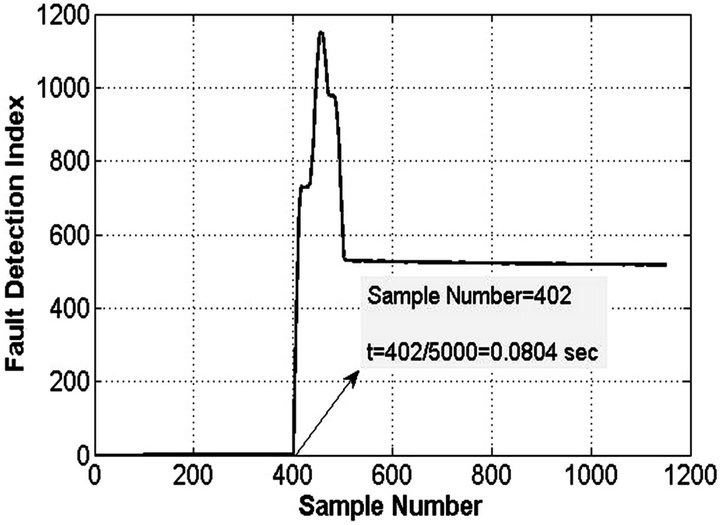
Figure 10. Fault detection index.
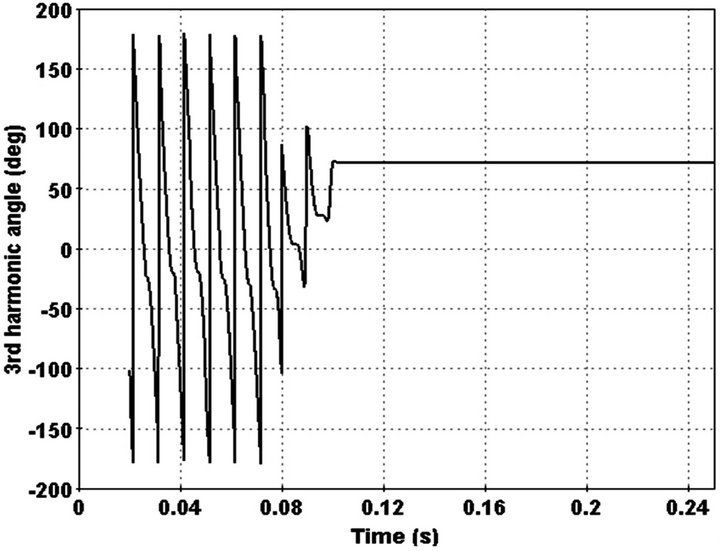
Figure 11. 3rd harmonic angle in faulted phase.
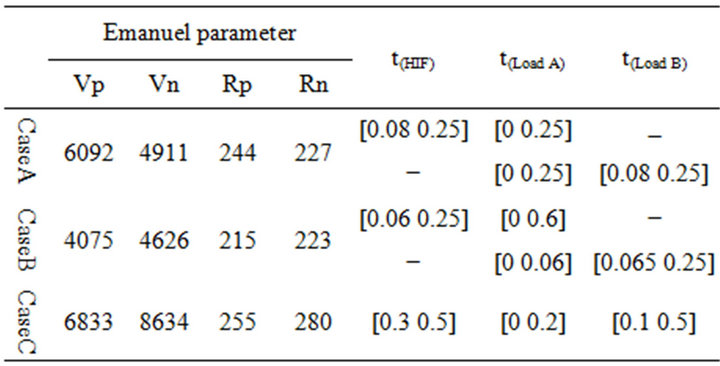
Table 2. Summarize of simulation.
Case B:
In this case on phase of overhead line breaks and fall to ground (Figure 14). This case certainly cannot detect by conventional protection relay because current decrease fault detection index and 3rd harmonic illustrated in Figures 15 and 16 respectively.
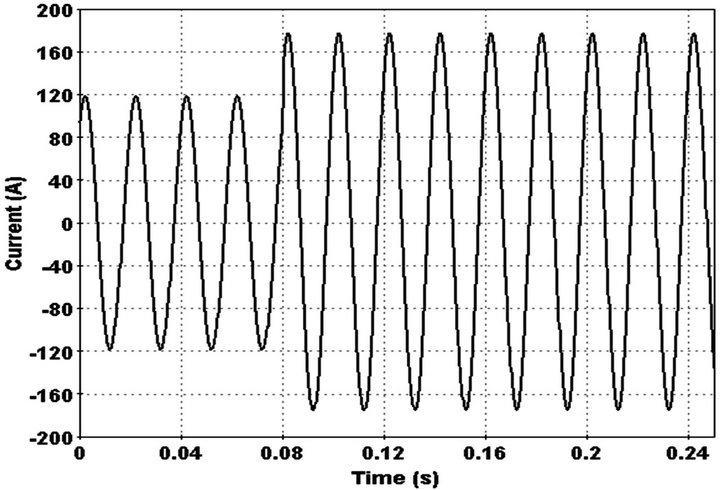
Figure 12. Current waveform in load switching.
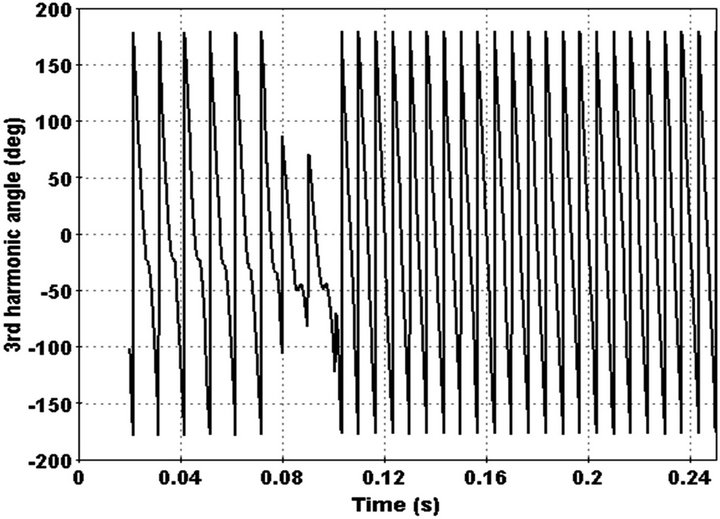
Figure 13. Distribution network with HIF.
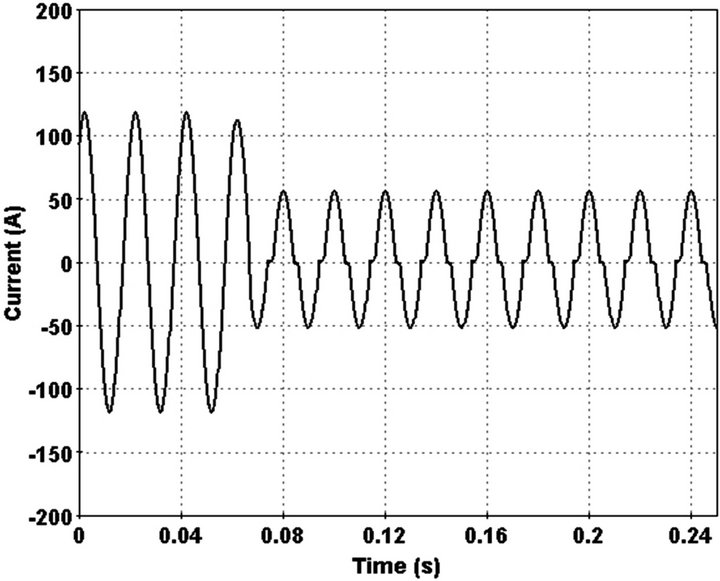
Figure 14. Current waveform in faulted phase.
Change of current detected by index and 3rd harmonic phase converge to a constant number between 50 - 90 degree after 0.02 sec. Also 3rd harmonic behaviour differs with state that feeder load decrease at the same time. In order do this, pervious added load replaced with main load at the end of feeder. Feeder current and 3rd harmonic in this state illustrated in Figures 17 and 18.
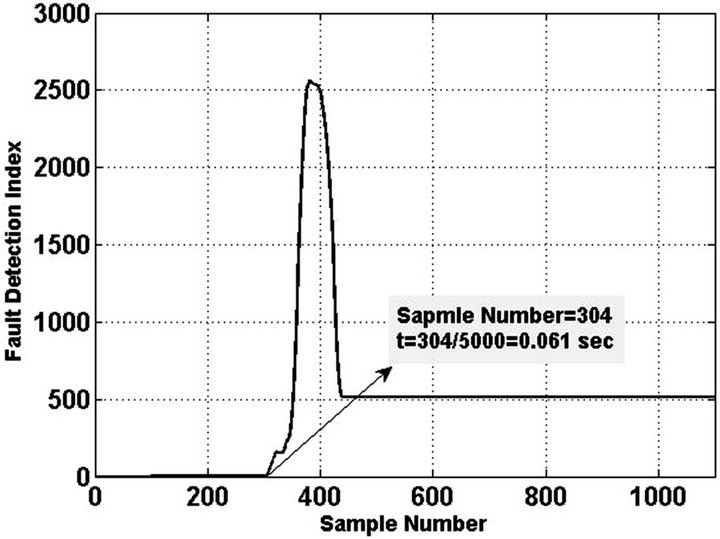
Figure 15. Fault detection index.
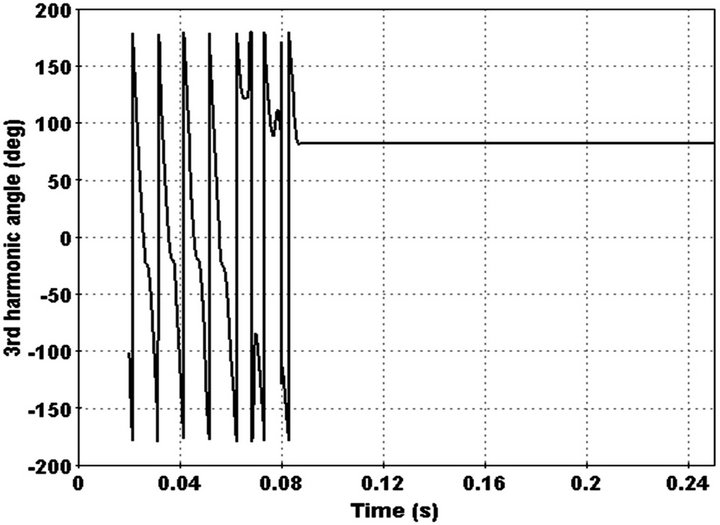
Figure 16. 3rd harmonic angle in faulted phase.
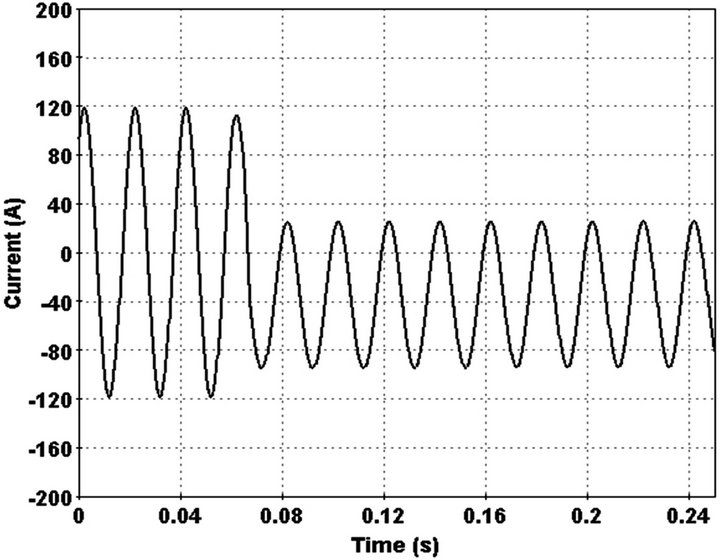
Figure 17. Current waveform in load switching.
Case C:
Finally in order to consider a perfect state, it is assumed that before occurring the HIF, current in feeder changes because of load switching. By modification of detection index, when current change is not HI,  will reset to last value of detection index(T) because during of load switching detection index converge to another constant value and it is not zero. With this modification, switching times detects and protection of network improved because we can able change relays setting to new value. Faulted phase current, fault detection index and 3rd harmonic phase are shown in Figures 19-21 respectively.
5. Conclusion
This paper proposes a new algorithm for HIF detection using PMU. The method is based on current phasors and HIF detection index obtains with summation of error between current samples and estimated samples which is obtained by current phasors. In order to have a perfect

Figure 18. 3rd harmonic angle in load switching.
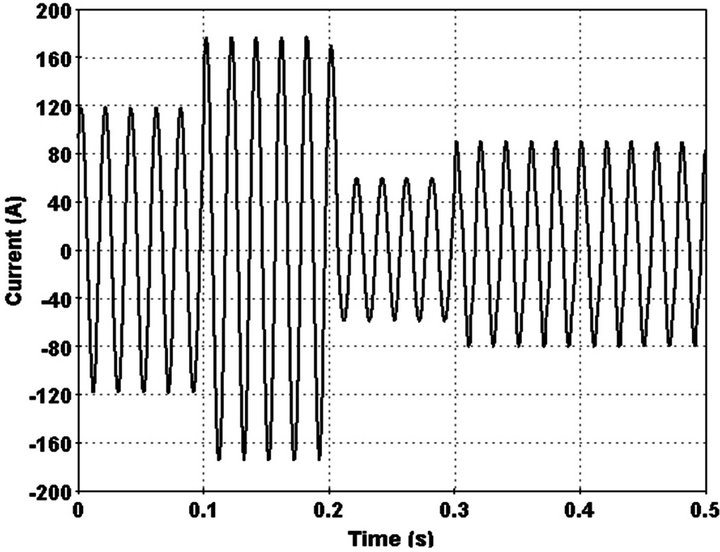
Figure 19. Current waveform in faulted phase.
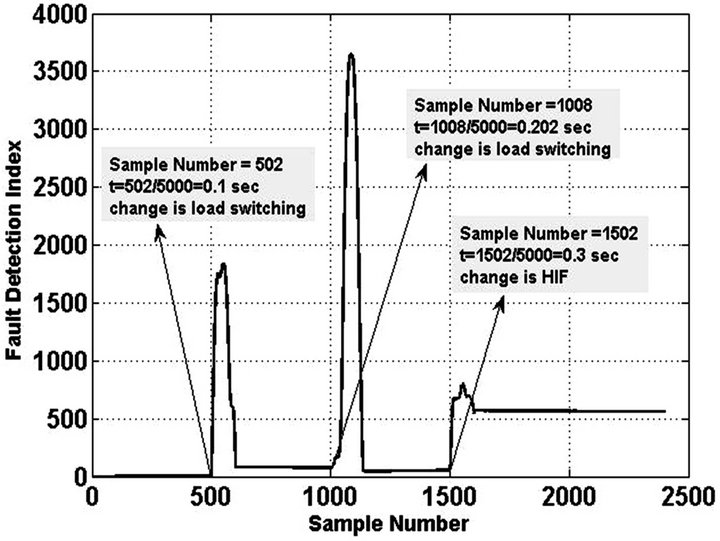
Figure 20. Fault detection index.
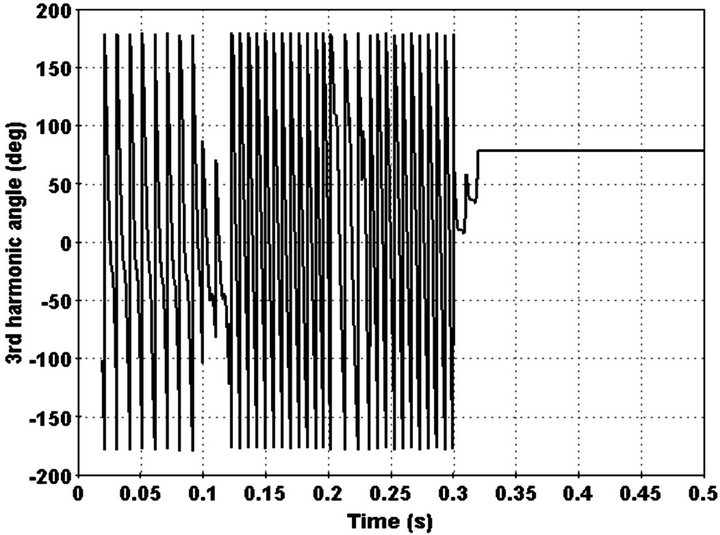
Figure 21. 3rd harmonic angle in faulted phase.
modeling of HIF detection, three HIF simulated in EMTP in this three case, different Emanuel parameter are used to consider various surfaces of fault. Also, in order to evaluate accuracy of method, feeder current increased or decreased in this states. Method can detect HIF, after one cycle of fault and it results that, we can achieve to adaptive protection with PMUs by modification of phasor change detector.
REFERENCES
- G. A. E. Emanuel, D. Cyganski, J. A. Orr, S. Shiller and E. M. Gulachenski, “High Impedance Fault Arcing on Sandy Soil in 15 kV Distribution Feeders: Contributions to the Evaluation of the Low Frequency Spectrum,” IEEE Transactions on Power Delivery, Vol. 5, No. 2, 1990, pp. 676-686. doi:10.1109/61.53070
- S. R. Nam, J. K. Park, Y. C. Kang and T. H. Kim, “A Modeling Method of a High Impedance Fault in a Distribution System Using Two Series Time-Varying Resistances in EMTP,” IEEE Power Engineering Society Summer Meeting, Vancouver, 15-19 July 2001, pp. 1175- 1180.
- Y. Sheng and S. M. Rovnyak, “Decision Tree-Based Methodology for High Impedance Fault Detection,” IEEE Transactions on Power Delivery, Vol.19, No. 2, 2004, pp. 533-536.
- Cui, X. Z. Dong, Z. Q. Bo and S. Richards, “Integrated Scheme for High Impedance Fault Detection in MV Distribution System,” Latin America IEEE/PES Transmission and Distribution Conference and Exposition, Bogota, 13-15 August 2008, pp. 1-6.
- A. R. Sedighi and M. R. Haghifam, “Simulation of High Impedance Ground Fault In Electrical Power Distribution Systems,” International Conference on Power System Technology, Hangzhou, 24-28 October 2010, pp. 1427- 1435.
- C. L. Huang, H. Y. Chu and M. T. Chen, “Algorithm Comparison for High-Impedance Fault Detection Based on Staged Fault Test,” IEEE Transaction on Power Delivery, Vol. 3, No. 4, 1988, pp. 1427-1435.
- H. Calhoun, M. T. Bishop, C. H. Eiceler and R. E. Lee, “Development and Testing of an Electro-Mechanical Relay to Detect Fallen Distribution Conductors,” IEEE Transaction on Power Apparatus and Systems, Vol. PAS-101, No. 6, 1982, pp. 1643-1650.
- A. M. Sharaf and S. I. Abu-Azab, “A Smart Relaying Scheme for High Impedance Faults in Distribution and Utilization Networks,” Proceedings of Canadian Conferance on Electrical and Computer Engineering, Halifax, 7-10 March 2000, pp. 740-744.
- A. Lazkano, J. Ruiz, L. A. Leturiondo and E. Aramendi, “High Impedance Arcing Fault Detector for Three-Wire Power Distribution Networks,” 10th Mediterranean Electrotechnical Conference, Lemesos, 29-31 May 2000, pp. 899-902.
- B. D. Russell and R. P. Chinchali, “A Digital Signal Processing Algorithm for Detecting Arcing Fault on Power Distribution Feeders,” IEEE Transaction on Power Delivery, Vol. 4, No. 1, 1989, pp. 132-140.
- B. M. Aucoin and B. D. Russell, “Distribution High-Impedance Fault Detection Using High-Frequency Current Components,” IEEE Transaction on Power Delivery, Vol. PAS-101, No. 6, 1982, pp. 1596-1606.
- C. H. Kim, H. Kim, Y. Ko, S. H. Byun, R. K. Aggarwal and A. T. Johns, “A Novel Fault-Detection Technique of High-Impedance Arcing Faults in Transmission Lines Using the Wavelet Transform,” IEEE Transaction on Power Delivery, Vol. 17, No. 4, 2002, pp. 921-929.
- D. I. Jeering and J. R. Linders, “Unique Aspects of Distribution System Harmonics Due to High Impedance Grand Faults,” IEEE Transaction on Power Delivery, Vol. 5, No. 2, 1990, pp. 1086-1094. doi:10.1109/61.53126
- Huges Aircraft Company, “High Impedance Fault Detection Using Third Harmonics Current,” EPRI Report, EL 2430, 1982.
- M. G. M zajani, H. K. kargar and M. G. M zanjani, “High Impedance Fault Detection of Distribution Network by Phasor Measurement Units,” Proceedings of 17th Conference on Electrical Power Distribution Networks, Tehran, 2-3 May 2012, pp. 1-5.
- A. G. Phadke and J. S. Thorp, “Computer Relaying for Power Systems,” Research Studies Press Ltd., John Wiley & Sons, Inc., 2009, pp. 151-153. doi:10.1002/9780470749722
- M. Balabin, K. Görner, Y. Li and I. Naumkin and C. Rehtanz, “Evaluation of PMU Performance during Transients,” International Conference on Power System Technology, Hangzhou, 24-28 October 2010, pp. 1-8.
- T. M. Lai, L. A. Snider and E. Lo, “Wavelet Transform Based Relay Algorithm for the Detection of Stochastic High Impedance Faults,” International Conference on Power System Transient, New Orland, 2003, pp. 1-6.
- T. M. Lai, L. A. E. Lo and D. Sutanto, “High-Impedance Fault Detection Using Discrete Wavelet Transform and Frequency Range and RMS Conversion,” IEEE Transactions on Power Delivery, Vol. 20, No. 1, 2005, pp. 397- 407.
Appendix
Parameters of simulated distribution feeder are given here:
Sampling frequency of PMU 
Network frequency
Feeder voltage
Line length
Load power (A) 
Load power factor 
Load power 
Load power factor 
Feeder impedance parameters: