International Journal of Geosciences
Vol.4 No.10(2013), Article ID:41173,11 pages DOI:10.4236/ijg.2013.410133
Urban Spatial Expansion Characteristics in China’s Rapid Urbanization Region—A Case Study of SXC Region
1College of Architecture and Urban Planning, Guizhou University, Guiyang, China
2School of Geographic and Ocean Geographic Sciences, Nanjing University, Nanjing, China
Email: moneymin@126.com
Copyright © 2013 Min Qian et al. This is an open access article distributed under the Creative Commons Attribution License, which permits unrestricted use, distribution, and reproduction in any medium, provided the original work is properly cited. In accordance of the Creative Commons Attribution License all Copyrights © 2013 are reserved for SCIRP and the owner of the intellectual property Min Qian et al. All Copyright © 2013 are guarded by law and by SCIRP as a guardian.
Received October 11, 2013; revised November 13, 2013; accepted December 7, 2013
Keywords: Spatial Expansion Characteristics; Expansion Index; Fractal Dimension; Town-Level; Rapid Urbanization Region
ABSTRACT
Urban spatial expansion characteristics are the responses of urbanization acts on the geographical space. Analyzing the characteristics can reveal the process of urban expansion and mechanism which is one of useful methods to find out the sustainable land use strategy balancing development and protection. In this paper, two main methods have been deployed in analyzing the spatial expansion characteristics of rapid urbanization region. One is the expansion index method and the other is fractal dimension method. And the results show that town-level urban sprawl has increased in a non-linear way since 1985, and even the increments of the urban expansion intensity are fluctuated. Morphology transformation from scatter to concentration is common phenomenon in the process of urbanization in the towns. From the morphology point of view, downtowns are more homogenous than towns with less variation. The concentration is the leading development trend in downtowns. And the more distance from the downtown is, the more spatial pattern morphology will be observed. These characteristics indicate that macro-scale policies of economic development and land use management have great impacts on the formation and characteristics of spatial patterns of urban dynamic patterns.
1. Introduction
Urbanization is the certain product of modernization [1]. And it may be the most important human activities, creating enormous impacts on the environment at variety scales [2]. Study on the urban spatial expansion characteristics can make clear the process and mechanization of urbanization. In China, urbanization level has been over 50% until 2011 [3]. Now there are many rigorous challenges such as environment, transportation, employment, etc. Sustained rapid development of economy not only brings this region GDP increasing quickly, but also the sharp increasing amount of cities and immigrant population. The directive outcome is all kinds of benefits from rapid urbanization accompanied with the original fertile and ecological agricultural lands rapidly vanishing. To maintain economic development and sufficient agricultural production for population, it is desirable to investigate a link for the conflict between economic development and agricultural land protection. Urban spatial sprawl is the important expression of urbanization [4]. Studying on urban spatial sprawl and searching urban expansion regular pattern are useful methods to find out the sustainable land use strategy balancing development and protection.
SXC region which is refer to Suzhou city, Wuxi city and Changzhou city is the typical rapid urbanization region in China since 1980s. As the core region of the Yangtze River Delta, SXC region is one of the highest levels of urbanization. Enormous population and limited land resource are distinctive characteristics of this region. Rapid urbanization brings about massive land use and land cover change (LUCC) in China which is considered as the most prominent form of global environmental change phenomenon occurring at spatial and temporal scales [5]. Many scholars pay close attention to it and quite a few papers can be found in the similar region [6-8]. In the existing papers, scholars focus on range of scales from region to city but uncommonly to county scale. It’s well-known that different geography scale may lead the same research to a different result. So it is helpful to analyze the characteristics of urban sprawl based on county scale. This may broaden the scope of research and obtain diverse spatial expansion characters comparing to existing researches and give some valuable suggestions for sustainable development in town-level land use.
In this paper, two main methods have been deployed in analyzing the spatial expansion characters in SXC region. One is the expansion index method and the other is fractal dimension method. In this study, expansion index method includes Expansion Intensity Index (EII) and Expansion Rate Index (ERI) which have been used to evaluate the intensity and speed of urban expansion area compared with previous period. And then we compare the EII of each stage, such as the EII in 1985-1995 to 1995- 2000, to test whether every county in each city is continuously increasing its expansion. This quantitative method can analyze the impact from environment in math formula which can make complex problem simple. In Knox’s the process of urbanization theory that morphology is the result of urbanization [9] which means that the direct consequence of the spatial expansion is the morphological transformation. To quantify the morphology of the urban and rural construction can make clear the urbanization process in the past and then forecast the trend of urban sprawling. Early research showed that the built-up could be conceptualized as a fractal under serious of correlation scale. Fractal dimension index (FDI) could describe various attributes of built-up independently including the complexity, the compactness and the heterogeneity [10]. FDI has been used to indicate the meaning of urban morphology change during the period. From the opinion new economic increasing theory and new economic geography, city is the product of economy of scale and agglomeration economies [11]. As one of the core cities in the Yangtze River Delta, the city spatial construction reflects the characteristic of the urban system. The spatial distribution of urban system has apparent scale-free property which presents random fractal structure [12]. Otherwise national policy plays important roles in the form of urban system [13] which means the spatial distribution characters may provide some presentation in the morphology according to the policies. So it’s necessary to introduce FDI method to analyze the transformation.
This paper studies the patterns of dynamic urban expansion in SXC region which is the typical rapid urbanization region in China during the period 1985-2008. The main characteristics of spatial patterns and temporal changes of urban expansion are investigated. By calculating various indices which indicate the rate of change to the urban sprawl and the morphology, the process of urban expansion can be described. Then the mechanism of this process will be discussed. And according to the process and mechanism some optimized urban spatial expansion suggestions will be proposed for decision support.
2. Material and Methods
2.1. Study Area
SXC region is located in Jiangsu province with an administrative extent of Suzhou city, Wuxi city and Changezhou city including 12 county-level cities with 139 counties. Its east longitude is 119˚7' - 121˚20' and northern latitude is 30˚47' - 32˚2'. Since time immemorial SXC region is the superior place in China which is an abundant place with dense population. Today the number of cities and economy rises more rapidly in this region than in other place in China which leads to severe land use change. Due to the birth control policy local natural birth rate is very low, but high speed development attracts a huge number of migrant workers to this place searching for job opportunity brings about population growing sharply. According to the statistical yearbook there are people in SXC region in 1985 and this number increase to nearly in 2008. People and the limited space contradict distinctly.
In this paper 5 time phase remote sensing 1985, 1995, 2000, 2005 and 2008 Landsat TM and TM+ images are adopted to interpret land use change vector image correspondingly. The original resolution ratio is 30 m ×30 m. And some necessary social economy data is adapt from the “Suzhou statistical yearbook” (1995-2008), “Wuxi statistical yearbook” (1995-2008), “Changzhou statistical yearbook” (1995-2008).
2.2. Methods
2.2.1. Index for Indicating the Translation of Urban Construction Land
EII and ERI are applied to calculate the state of urban construction land expansion which can indicate the speed and strength of urban construction land change. EII is the comparable index through standardization the urban construction land growth strength each year [14] which can be calculated in the equation below:
 (1)
(1)
In this equation,  means the number of area urban construction land i has expanded during the period of Δt; Sti is the total land use area.
And to make clear if the EII is increasing continuously, we compare 2 periods of EII and use increase, decrease and invariant to indicate the result  that bigger than 0, less than 0 and equal to 0. For example, if ΔEII2000-1985 = EII1995-2000-EII1985-1995 > 0 then using increase to indicate the EII is rising in this stage.
ERI means how fast the urban construction land has expanded during period of Δt and can be calculated in the equation below:
 (2)
(2)
In this equation, Ati means the total urban construction land area at the beginning of period Δt.
2.2.2. Fractal Dimension Index
Fractal theory is focus on non-linear or irregular geometry object and disorder system which is widely found in social activity [15]. This method describes the character of geometry object by calculating its fractal dimension. It is helpful to judge the similarity between cities in living, construction and planning trend by analyzing the character of built-up [16]. Fractal can be seemed as effective method for explanation, calculation, analysis and modeling [17]. Early research showed that built-up could be conceptualized a fractal with a series relevance scale. FDI could interpret the complexity, compactness and heterogeneous of built-up spatial distribution independently [18]. In the research of urban expansion different type of fractal dimension could be used to measure spatial distribution characters in region and then expose the spatial organization. Fractal dimension index is an important indicator of urban morphology. From the practical situation of China, in this paper built-up includes the construction land of cities, roads, industrial and mining area, airports and other construction land. Several methods have been developed to test the extent to which the spatial organization of empirical patterns follows a fractal law and to estimate their fractal dimensions such as: correlation, dilation, radial, etc. Correlation analysis turns out to be most reliable for analyzing both surface and boundary dimensions among these methods. And its FDI is calculated as below:
 (3)
(3)
In this equation a is called the “form factor” or “pre factor of shape” [19]. The value of a should be between 0.5 - 3, if value were above 10 or below 0.1 indicated that the object hadn’t fractal characters [19], ε is the size of a small square window which surrounds each built-up pixel. D is the “fractal dimension” or, in this case, the “correlation dimension”. To avoid local effects and hence wrong estimations, an additional parameter c is introduced to correct estimation of D and a. In correlation dimension D value is often between 0 and 2. If D was close to 0 then it demonstrated that built-up expanded as asteroid feature. If D was close to 1 then it demonstrated that built-up expanded along the road. If D was close to 2 then it demonstrated that built-up expanded as facet.
3. Results
3.1. The Urban Expansion Intensity and Ratio of Counties in SXC Region
The average annual EII during the period of 1985-1995, 1995-2000, 2000-2005 and 2005-2008 in SXC region is 0.23, 0.15, 0.54 and 1.03, respectively. And the average annual ERI is 7.34%, 2.85%, 8.84% and 11.73%. More specifically (Figure 1), EII of all the counties except Wujiang reach the lowest value during the stage 1995- 2000, besides, EII of all the counties except Changshu and Kunshan reached the highest value during the stage 2005-2008. During the two stages of 2000-2008, EII of Changzhou and Wuxi were generally higher than the respective jurisdiction of the prefecture-level city, and increasing except the 1995-2000 phase. While Suzhou and the jurisdiction of the prefecture-level city shows slightly complex situation, although the overall EII of the region-by-stage increases, EII of Changshu and Kunshan decreased during 2005-2008.
Basic variation mode of ERI is similar to the EII in the every county (Figure 2). From 1985 to 1995, the ERI of every county is at a high level except Wujiang, and then, this region experiences a low-rate expansion period from 1995 to 2000. From 2000 to 2008, ERI of every county shows greater fluctuation than the earlier two periods, and in all of these counties, Kunshan and Wujiang demonstrate the highest fluctuating rate.
With comparing each sequential period of EII, ΔEII2005-1985 and ΔEII2008-2000 are listed as Table 1.
From this table we can conclude that it is non-uniform change in each ΔEII. In the first stage of 1985-1995 and 1995-2000, ΔEII of most towns in the counties are de-

Figure 1. EII of each city in SXC during 1985-2008.

Figure 2. ERI of each city in SXC during 1985-2008.

Table 1. Number of towns of each ΔEII.
crease, which means the expansion in tensity of construction land is slowdown in that period. And in the next 2 stages, ΔEII shows increase trend in most of towns. It is noteworthy that the increase ΔEII number of towns in Wujiang always goes beyond the decrease.
From the distribution of 3 stage of ΔEII (Figure 3), almost every town near the downtown has the same rate of change with the center except Suzhou city. Looking from the morphological distribution of ΔEII, in the first stage, the result of ΔEII is overwhelming decrease in most towns of SXC region. In the second stage, the main trend of ΔEII is increase. Meanwhile the morphology of towns which ΔEII are decrease present banding shape with slight individual town. In the third stage, increase is still majority of ΔEII, but some of towns which ΔEII is decrease are clustered in Suzhou. On the other hand, individual town which ΔEII is decrease grow in Wuxi and Changzhou.
Above-mentioned analysis, no matter what EII or ERI of urban is non-linear changes during the period of 1985- 2008 in SXC region. Furthermore, the results of 3 stages of ΔEII show that there aren’t uniform changes of EII. From the period of 1985-1995 and 1995-2000 EII is decrease in downtowns and most of towns in SXC region which fit to the Basic Farmland Protection Act in China which was executed in 1994.The cropland encroached by urban expansion is slowed. Distribution of whether increase or decrease displays rare regularity in the next 2 stages. But the morphology of descending ΔEII shows some distinctive characters. Different away from Suzhou city in the third stage, towns which EII is decrease connect together in banding shape. And such kinds of towns are clustered together in Suzhou city. These characters which have same synchronization of decrease in EII imply that those towns may be influenced by the specific land use policy. Series land-use policies not only ensure urban infrastructure construction succeed but also protect primary farmland and environment avoids from destroyed since 1995. And these policies seem to cause some towns which ΔEII are decrease connect in banding shape or cluster together.
3.2. The Characters of Urban Sprawl Morphology in Counties
Sustainable rapid economic growth has led to faster urbanization of SXC region. Taking the town as basic research unit, this paper tries to research whether the form of urban expansion changes over time show certain regularity. Because there are changes in administrative boundaries, in order to facilitate, all administrative units are divided divisions prevail in 2008, some streets divided into the city that haven’t borders. FDI of all the streets is calculated separately, and the size of the sliding window is decided according to the specific size of the town or the streets.

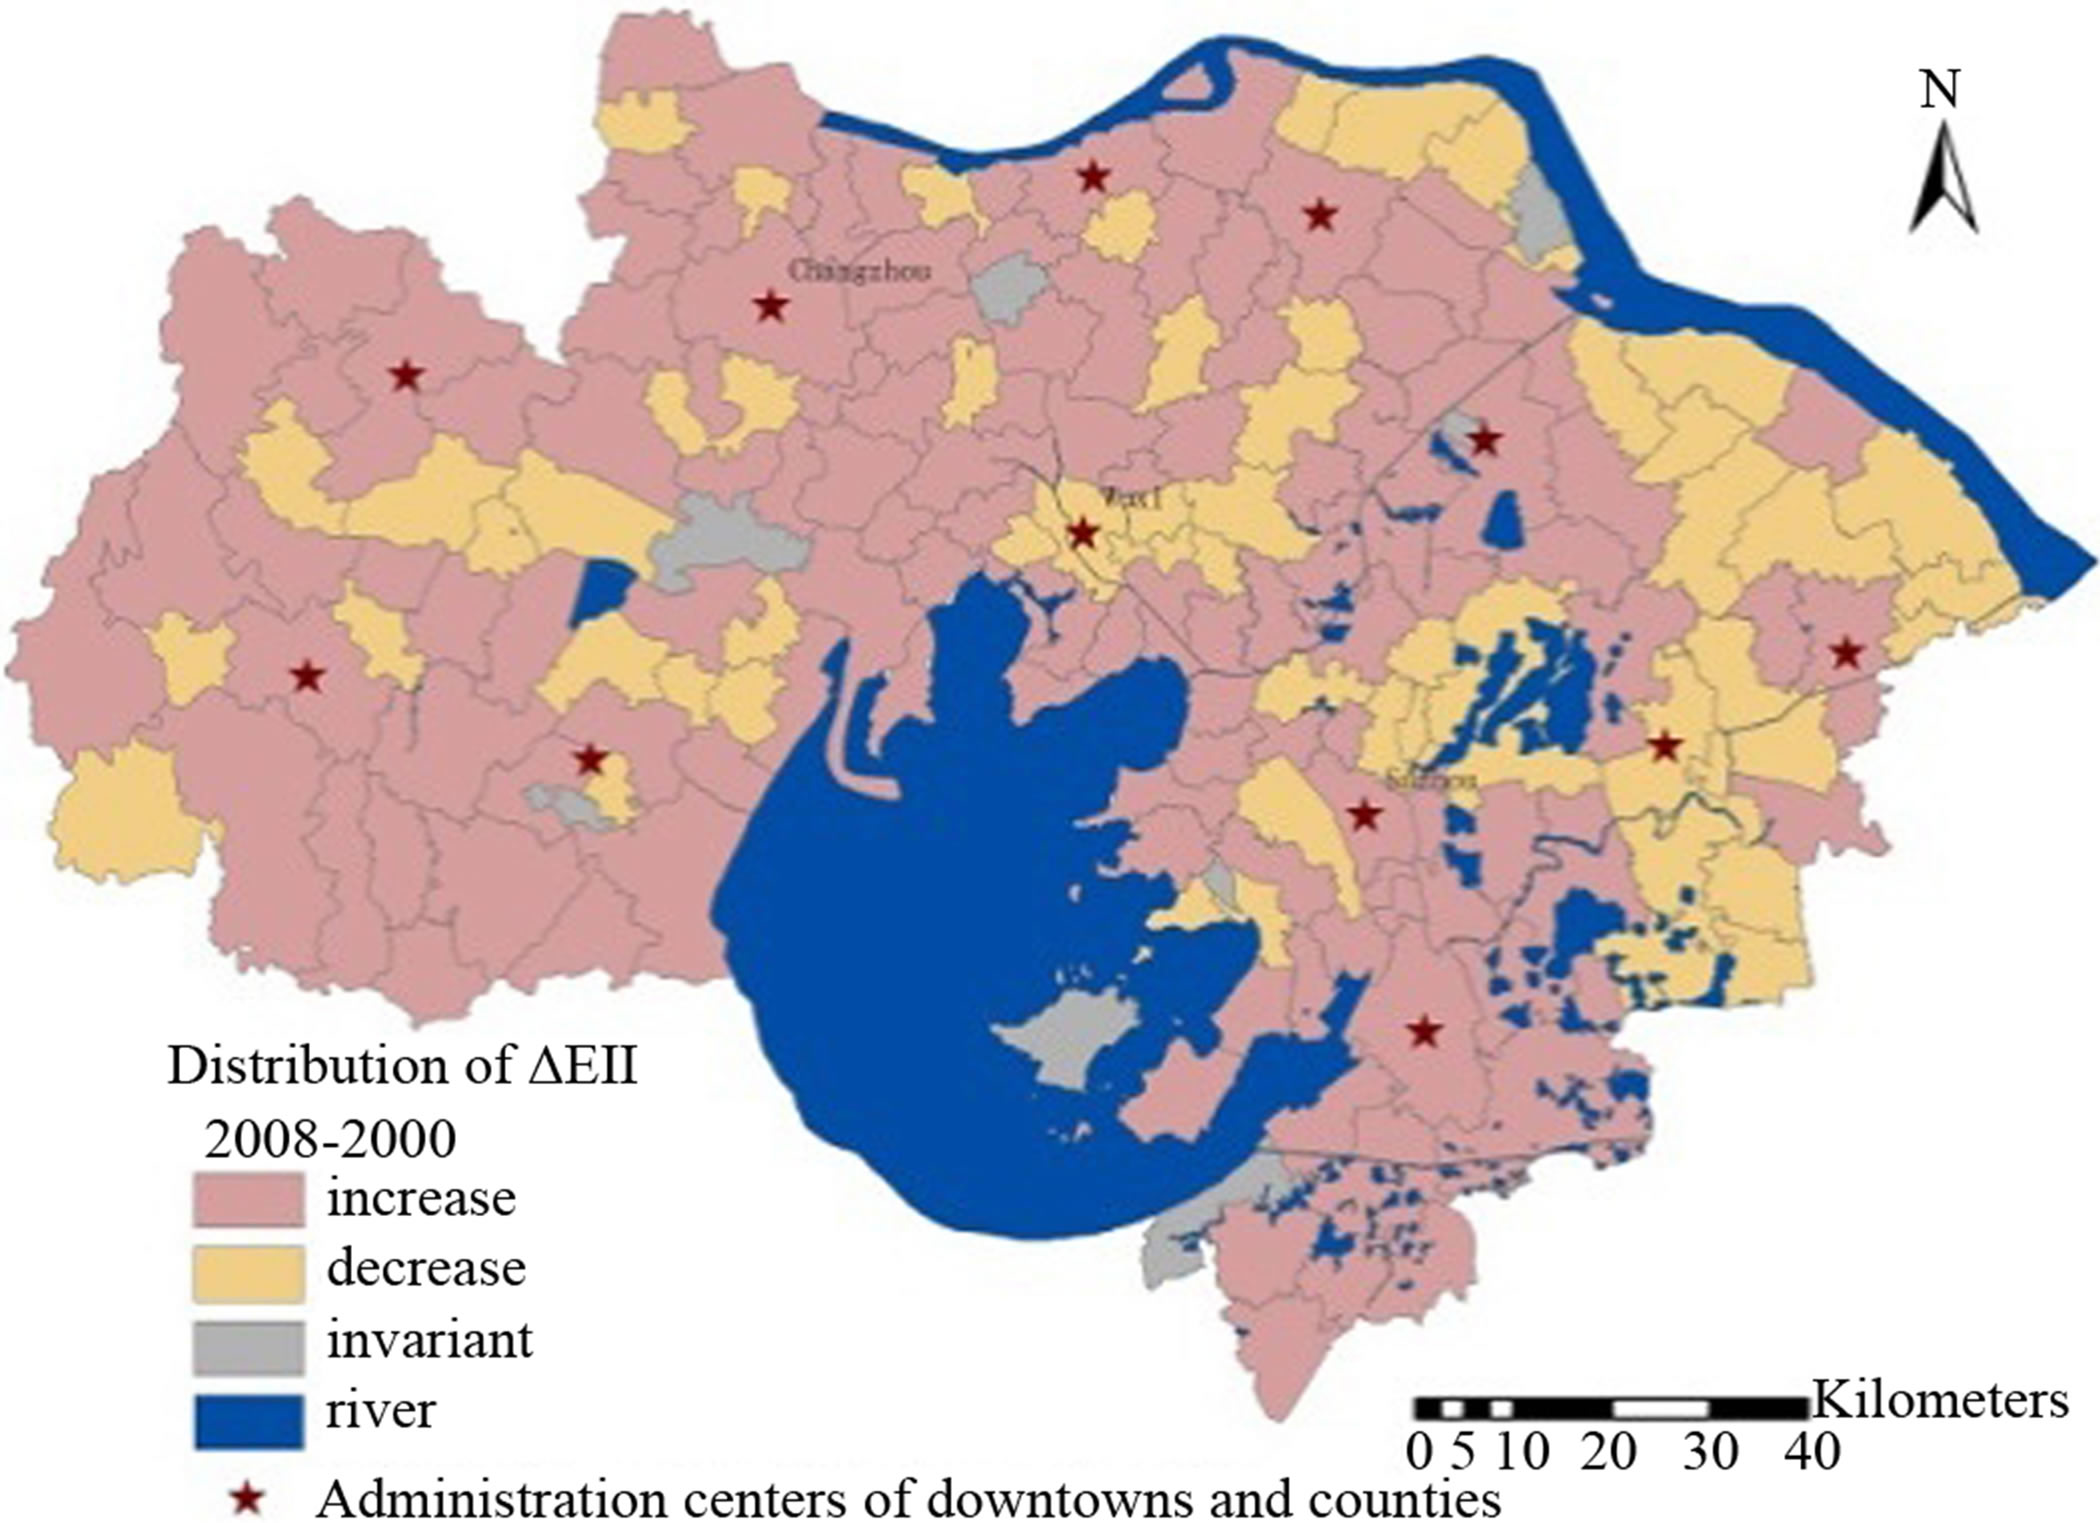
Figure 3. Distribution of 3 stage of ΔEII.
Since some towns and streets are formed by the merger of the 2008 zoning data, fractal dimension is not calculated in the region which doesn’t form a contiguous village. Although this will produce a Modifiable Are al Unit Problem (MAUP), the FDI is not the simple average of scattered built-up area of each town, and separate treatment would blur the distinction between urban and rural areas, and the village does not have a separate administrative entity functions. The absolute FDI will be slightly affected by the window size and center position estimation method, but these factors don’t affect the result of the operation result and relative variables [20]. In order to ensure the accuracy of calculation, the distribution area of construction land is not less than 1/2of the sliding window area. If there is scattered construction land which can’t meet the sliding windows account for at least 1/2, it is considered that the town has multi-dimensional characteristics, marking FDI as 10. Fractal dimension of 180 towns and city streets of these three cities was calculated in the year 1985, 1995, 2000, 2005 and 2008, frequency statistics of FDI in each town in every year was showed as follows (Figure 4).
The results show that the frequency of high value of FDI increases while the frequency of low value of FDI reduces over the time. the highest frequency of FDI in 1985 is 22, and the value is between 1.55 - 1.60, while in 1995, the highest frequency of FDI is 29, and its value is between 1.65 - 1.70, and the frequency number between 1.75 - 1.80 is 27; in 2000, the highest frequency number appears in the range of 1.65 - 1.70, the number is 30, and the number between 1.75 - 1.80 is 27; in 2005, the highest frequency number appears in the range of 1.75 - 1.80, the number is 38, and the number between 1.65 - 1.70 is 34; in 2008, the highest frequency number appears in the range of 1.75 - 1.8, the number is 40, and the number between 1.85 - 1.90 is 24. High value of FDI indicates high homogeneity of the built-up area, and on the contrary, the low value of FDI indicates the heterogeneity. From 1985 to 1995,there is more heterogeneity in the built-up area of each town. Based on the land use map of study area, the built-up area of each town is small, and the shapes are more dispersed. The frequency number of


Figure 4. Frequency counts of FDI in SXC during 1985-2008.
FDI appeared 11 times in the 1.15 - 1.4, and the numbers reduce to 0 in 2005, and then appear once in 2008. Compared with 2005, the frequency of the highest value is less in 2008. This means that the morphology transformations of towns are not fully exhibit progressive forms during 2005 - 2008. From the land use map, the town’s expansion is more intense, and there is a new generation of built-up area. Overall, in the five stages and 24 years,there has been a qualitative leap in the urban built-up area and density, and homogeneity has been increased and heterogeneity decreased.
The results of relationship between FDI and form factors during the each period of 1985-2008 are showed in Figure 5. The ideal condition is that FDI is closer to 2,


Figure 5. Form factor and FDI in SXC during1985-2008.
the “a” value is closer to 1. “a” value is a comprehensive index of local deviations, and the smaller “a” value is, the higher the degree fitting shape is, which is consistent with the results from foreign study. But at the same time, “a” value can be found in [1,4], and can’t be found in the [0,1] interval. That indicates that although the homogenization of construction land of the study area is increasing, this situation is not particularly significant. That means the homogenization process deepened, but builtup area has always existed the heterogeneity. This may be due to the irregular increasing of new built-up, especially in 2008. From the statistics result of FDI, we can conclude that the land use change during this time is really intense, and the correlation between the “a” value and FDI is an evidence for the previous result; in 2008, there have been many high-a-value and low-FDI-value of the data.
For analysis built-up spatial change further, a single variable statistics figures for the period of 1985, 1995, 2000, 2005 and 2008 are shown as below. All values are divided in Jerk method. Because not every town has its fractal dimension, we use 0 to indicate there isn’t builtup in this year and 10 to indicate the town turns out a multi-fractal feature.
The Figure 6 shows that the spatial pattern of SXC region is complicated in 1985 where approximately half towns show multi-fractal character. The highest value of FDI cluster in the downtown and center of the towns, and the higher value of FDI tend to be near these regions with other value of FDI around them. In 1995 the highest value of FDI maintain the same, the comparatively lower value of FDI region transform to the higher value, and the multi-fractal feature regions upper stage turn up single fractal feature show that urbanization in this stage develop in intensive way. Compare with 1995, there is no obvious change in 2000; towns with single fractal feature are sustained increasing in this stage show that the homogenous of the spatial pattern among the towns have been enhanced. In 2005 the quantity of high FDI regions increase with numerical value decrease which indicate there is scattered trend in the process of urbanization. In 2008 there are two polarities in urbanization, that is, homogenous regions with the highest numerical value of FDI making these regions amassing deeper while more heterogeneous regions arise with the low numerical value of FDI or multi-fractal feature. It may imply that rapid urbanization generate variety of morphology built-up. In general spatial pattern of towns in SXC region are presented diversified transformation. In the period of 1985 to 2000, the morphology of towns tends to develop in cluster and improve the homogenous spatial pattern. In the period of 2000 to 2008, the spatial pattern show more heterogeneous while in homogenous regions the numerical value of FDI is keep increasing. This may reveal that the homogenous regions with high numerical value of FDI will enhance their homogeneity during the year while the other regions tend to be affected by urbanization. To some extent these diversities indicate that rapid urbanization has more impact on morphology of built-up which value of FDI is low.
For further specific analyzing morphological transformation, value of FDI in each town is compared and reclassified by the time interval (Table 2). This classification is based on fractal dimension feature that if value of FDI was over 2 showed that the region might haven’t fractal feature or have multi-fractal feature. Time interval is between the current year and the next stage year, namely 1985-1995, 1995-2000, 2000-2005 and 2005- 2008. In the classification t donates current year, t + 1 donates the next stage year, D donates fractal dimension and Dt+1-Dt donates the compared result between the time interval.The classification rules are listed as Table 2.
From Figure 7 we can find out directly that during the period of 1985-1995 and 1995-2000 towns which FDI are D3 occupy more than half area in SXC region. This distribution character implies that in those stages urban expansion morphology is stable. With the other two leading variation of FDI are D1 and D4 show the process of urban expansion is intensive in those stages. Accompanied by the increase number of D2 and D5 during the period of 2000-2005 and 2005-2008, urban expansion period of 2000-2005 and 2005-2008, urban expansion morphology becomes diffused. Specifically, the reclassification results show that: 1) Downtowns and center of towns in Suzhou city and Wuxi city develop in concentrated trend during 1985-1995. No obvious transformation in development trend regions haven’t built-up yet; 2) During the period of 1995-2000, most development trend from scatter to concentration regions in previous phase remain the same development trend, downtown in Suzhou city shows slightly diffused trend. 3) There are obvious increase number of towns which FDI are D2 during the period of 2000-2005; 4) During 2005-2008 downtowns and center of towns develop in concentrated trend is obvious meanwhile towns with D2 and D5 increase simultaneously.
To summarize, morphology transformation from scatter to concentration is common phenomenon in the process of urbanization in the towns of SXC region. From Figure 6 we can find that FDI in downtowns is higher than in other towns show the downtowns are more homogenous than towns. And the less variation may imply the concentration is the leading development trend in downtowns. The more distance from the downtown the more spatial pattern morphology is been observed. More specifically study from the Figure 7 we can find that there is slight scatter during the period of 1985-1995 in the downtown of Changzhou, and the same situation in


Figure 6. Classify FDI in SXC region during 1985-2008.

Table 2. Classify FDI with rules.

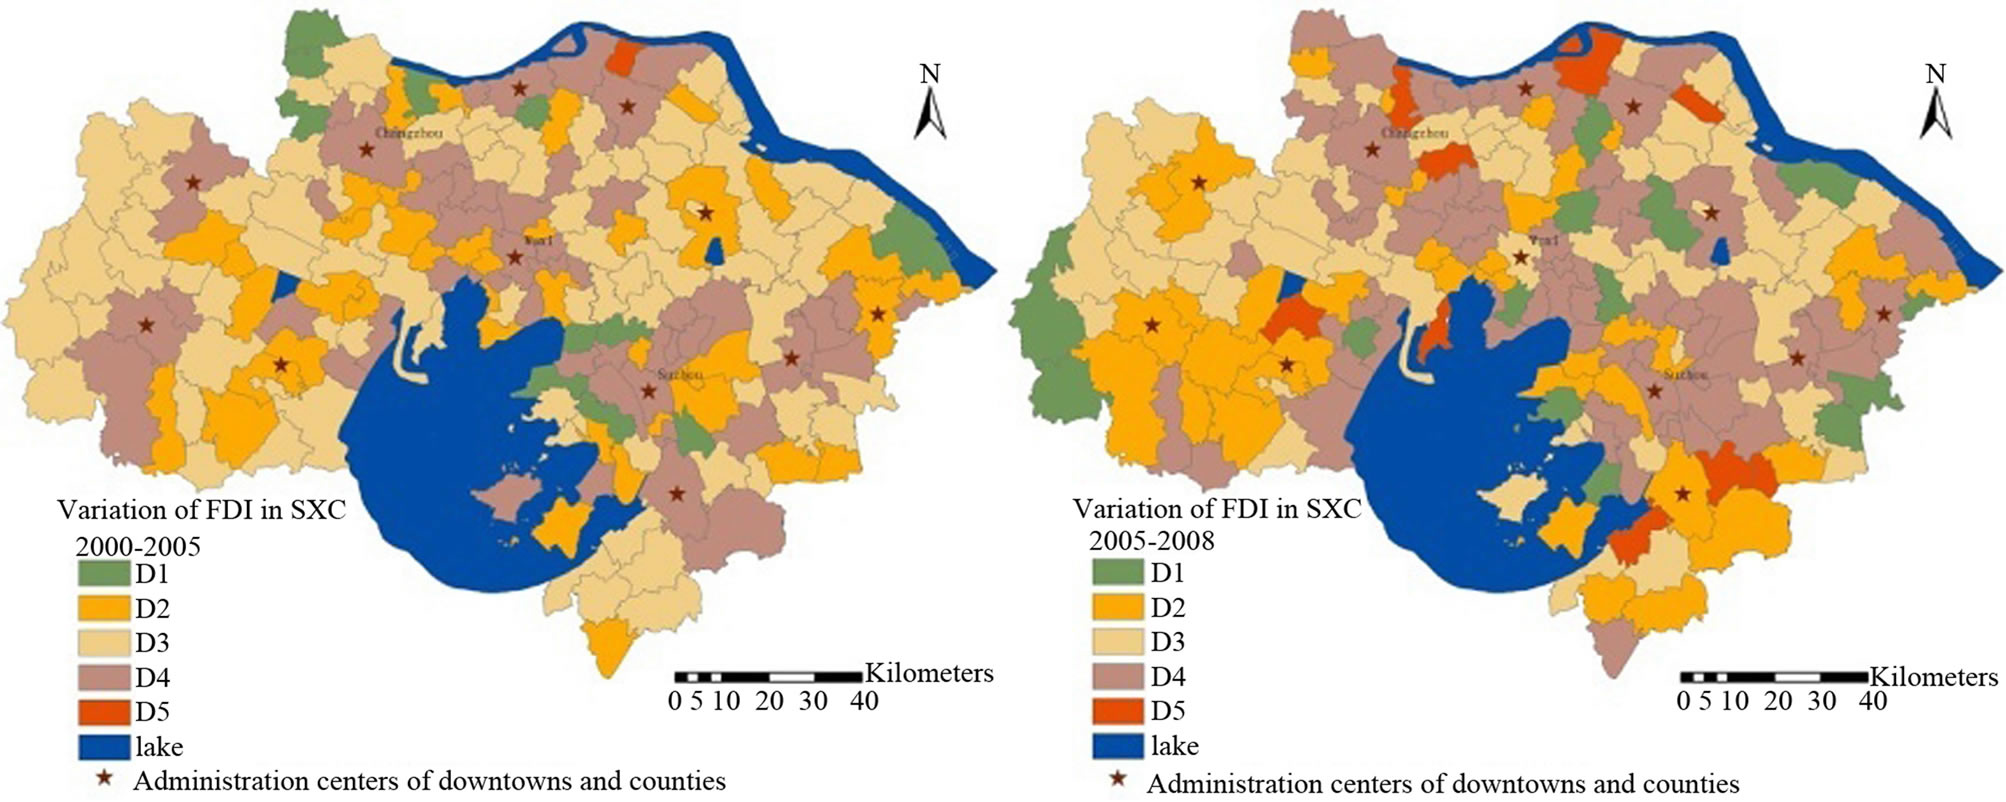
Figure 7. Variation of FDI of each town in SXC.
downtown of Suzhou during the period of 1995-2000 and 2005-2008. Compared with Figure 6 this difference may imply that although the main trend is concentration in downtowns there are variations under it.
4. Conclusions
In this study, the rate of urban sprawl and the pattern of morphology in SXC region have been discussed in this paper. In SXC region, urban sprawl increases in a nonlinear way—not only EII and ERI increase in fluctuant way, but also the rates of rising ΔEII in towns are undulatory. Since 1978, when the central government initiated nation-wide economic reform and open-door policy, China’s economy had experienced sharply rapid growth. Two significant demographic changes will continue. One is the expansion of current cities and towns, while the other is the conversion of villages and countryside into cities and towns. In order to keep economic balance and avoid overheating of real estate development, the central government implemented macro-economic control policies. In 1980s, strategy of urban development is “Control big urban, Optimize middle urban, Develop small urban”. From this point of view, macro-policy of urban development is the main control factor in the rate of urban expansion. As the core of Yangtse Delta, SXC region has its characteristic county-level structure. From FDI of each town and downtown distribution, we can find that the morphology of downtowns and most of administrative towns are intensive from 1985-2008. And the far from the administrative center is, the more diversity of FDI emerge is.
The variant FDI of distribution mainly concentrates on the north of Changzhou, the eastern of Suzhou and the region along the Changjiang River. From the land use policy point of view, the development of land use policy “Cancel counties and build cities” in Changzhou executed in 1995 changed the original development pattern which expanded the city in banding mode along Huning railroad and canal. Being the most affected region from the radiation of Shanghai, Suzhou developed industrial area eastwards continuously. Moreover, previous “Sunan pattern” brought about the messy industry pattern in towns of Suzhou. Although the problems caused by rural economy had improved through “Open Economic Zone” pattern, extensive mode of land use in Suzhou caused by the rapid urbanization hindered the town developed in concentrated way. Compared with those two cities, the development in Wuxi was relative equilibration. Wuxi’s government paid attention to rural enterprises development, using policies encouraging and adjusting them grow orderly. And the riverside strategy of Jiangsu province stimulated rapider development in Jiangyin city than other cities of Wuxi.
In summary, characteristic of town-level spatial sprawl in SXC region is influenced by the socio-economic trends and governmental policies. The macro-scale policies of economic development and land use management have great impacts on the formation and characteristics of spatial patterns of urban dynamic patterns. So the further studies will focus on how to develop urban expansion prediction model based on the EII and FDI so that the policy maker can optimize land use structure with the help of previous urban sprawl experience. Only by means of stinted and intensive land use productivity, can we achieve the goal of sustainable development.
5. Acknowledgements
The authors are grateful for financial by the State Key Program of National Natural Science Foundation of China (Grant No. 41230751) and National Natural Science Foundation of China (Grant No. 40871255).
REFERENCES
- X. W. Liu, D. X. Zhang and B. M. Chen, “Characteristics of China’s Town-Level Land Use in Rapid Urbanization Stage,” ActaGeographicaSinica, Vol. 63, No.3, 2008, pp. 301-310.
- B. L. II. Turner, W. C. Clark, R. W. Kates, J. F. Richards, J. T. Mathews and W. B. Meyer, “The Earth as Transformed by Human Action: Global and Regional Changes in the Biosphere over the Past 300 Years,” Cambridge University Press, Cambridge, 1990.
- Y. S. Liu and R. Yang, “The Spatial Characteristics and Formation Mechanism of the County Urbanization in China,” ActaGeographicaSinica, Vol. 67, No. 8, 2013, pp. 1011-1020.
- X. D. Ma, “Comparative Study between Urbanization Process and Spatial Pattern with ESDA Framework,” Southeast University Press, Nanjing, 2007.
- A. S. Minale, “Retrospective Analysis of Land Cover and Use Dynamics in Gilgel Abbay Watershed by Using GIS and Remote Sensing Techniques, Northwestern Ethiopia,” International Journal of Geosciences, Vol. 4, 2013, pp. 1003-1008. http://dx.doi.org/10.4236/ijg.2013.47093
- R. H. Ma, C. L. Gu, Y. X. Pu, X. D. Ma and C. G. Zhu, “Urban Spatial Sprawl Pattern and Metrics in South of Jiangsu Province along the Yangtze River,” ActaGeographicaSinica, Vol. 62, No. 10, 2007, pp. 1011-1022.
- X. D. Ma, C. G. Zhu, R. H. Ma and Y. X. Pu, “Urban Spatial Growth Pattern and Its Evolution in Suzhou, Jiangsu Province, China,” ActaGeographicaSinica, Vol. 63, No. 4, 2008, pp. 405-416.
- Q. J. Che, X. J. Duan, Y. Guo, L. Wang and Y. H. Cao, “Urban Spatial Expansion Process, Pattern and Mechanismin Yangtze River Delta,” ActaGeographicaSinica, Vol. 66, No. 4, 2011, pp. 446-456.
- P. L. Knox, “Urbanization: An Introduction to Urban Geography,” Englewood Cliffs Press, New York, 1994.
- M. Batty, “Cities and Complexity: Understanding Cities with Cellular Automata, Agent-Based Models, and Fractals,” MIT Press, Cambridge, 2005.
- Y. X. Pu, R. H. Ma, X. D. Ma and C. L. Gu, “SpatioTemporal Dynamics of City-Size Distribution in Yangtze River Delta,” Geographical Research, Vol. 28, No. 1, 2009, pp. 161-172.
- C. W. Li, X. L. Zhang and W. Wu, “A Study on Urban System along the Yangtze River Based on Fractal Theory in Jiangsu Province,” Resources and Environment in the Yangtze Basin, Vol. 19, No. 1, 2010, pp. 1-6.
- L. J. C. Ma, “Urban Transformation in China, 1949-2000: A Review and Research Agenda,” Environment and Planning A, Vol. 34, No. 9, 2002, pp. 1545-1569. http://dx.doi.org/10.1068/a34192
- R. H. Ma, W. Chen, X. H. Chen and X. J. Duan, “Town and Construction Land Growth of Changshu City,” ActaGeographicaSinica, Vol. 59, No. 3, 2004, pp. 418-426.
- B. B. Mandelbrot, “The Fractal Geometry of Nature,” Freeman Press, San Francisco, 1982.
- T. Isabelle, F. Pierre and B. Dominique, “Comparing the Fractality of European Urban Neighbourhoods: Do National Contexts Matter?” Journal of Geographical Systems, Vol. 14, No. 2, 2012, pp. 189-208. http://dx.doi.org/10.1007/s10109-010-0142-4
- T. Isabelle, F. Pierre, F. Benoit, et al., “Clustering Patterns of Urban Built-Up Areas with Curves of Fractal Scaling Behavior,” Environment and Planning B: Planning and Design, Vol. 37, No. 5, 2010, pp. 942-954. http://dx.doi.org/10.1068/b36039
- M. Batty, “Cities and Complexity: Understanding Cities with Cellular Automata, Agent-Based Models, and Fractals,” MIT Press, Cambridge, 2005.
- I. Thomas, P. Frankhauser and C. Biernacki, “The Fractal Morphology of the Built-Up Landscape,” Landscape of Urban Plan, Vol. 84, No. 2, 2008, pp. 99-115. http://dx.doi.org/10.1016/j.landurbplan.2007.07.002
- I. Thomas, P. Frankhauser and M. L. De Keersmaecker, “Fractal Dimension versus Density of the Built-Up Surfaces in the Periphery of Brussels,” Regional Science, Vol. 86, No. 2, 2007, pp. 287-307. http://dx.doi.org/10.1111/j.1435-5957.2007.00122.x