Journal of Sustainable Bioenergy Systems
Vol.3 No.2(2013), Article ID:33628,6 pages DOI:10.4236/jsbs.2013.32020
Feasibility Study of Ethanol Production from Food Wastes by Consolidated Continuous Solid-State Fermentation
Department of Life Science and Bioengineering, Faculty of Chemistry, Materials and Bioengineering, Kansai University, Osaka, Japan
Email: *katakura@kansai-u.ac.jp
Copyright © 2013 Churairat Moukamnerd et al. This is an open access article distributed under the Creative Commons Attribution License, which permits unrestricted use, distribution, and reproduction in any medium, provided the original work is properly cited.
Received February 14, 2013; revised March 13, 2013; accepted May 7, 2013
Keywords: Bioethanol; Food Waste; CCSSF; Simultaneous Saccharification and Fermentation; Recycling System
ABSTRACT
To save the cost and input energy for bioethanol production, a consolidated continuous solid-state fermentation (CCSSF) system composed of a rotating drum reactor, a humidifier and a condenser has been developed. In this research, the feasibility of using this system for production of ethanol from food wastes was carried out. The ethanol conversion of bread crust and rice grain (uncooked rice) as substrates reached up to 100.9% ± 5.1% and 108.0% ± 7.9% (against theoretical yield), respectively. Even for bread crust, a processed starchy material which contained lower carbohydrate content than rice grain, the amount of ethanol obtained in a unit of CCSSF per year was higher due to easy saccharification and fermentation. The salt contained in potato chips directly affected yeast activity resulting to low ethanol conversion (80.7% ± 4.7% against theoretical yield).
1. Introduction
Ethanol production from biomass is the focus of much interest worldwide because bioethanol is a renewable fuel contributing to the reduction of the global warming effect and negative environmental impact generated by the worldwide utilization of fossil fuels. Waste biomass such as corn stover, waste wood, and waste foods is very attractive since it is cheap raw material for ethanol production [1]. Food waste is a kind of organics solid waste discharged from households, restaurants and food processing factory [2]. In Japan, the estimated amount of food waste generated annually is approximately 45.1 million tons (2010). The major conventional recycling method has been to employ food wastes as animal feed and fertilizer yielding approximately 8.6 million tons [3]. However, large amounts of wastewater are generated when desalting the food waste for fertilizer production, and animal feeds produced from this material often create hygiene problems for feeding animals [4]. The rest of food wastes, approximately 35.7 million tons, are sent to incineration or landfill. Nevertheless, a landfill is not a suitable choice for handling these wastes, since space is limited in Japan and uncontrolled fermentation of organic wastes in landfill causes emission of greenhouse gases, such as methane and carbon dioxide. The incineration of food waste is also impractical because of high water content and the possibility of dioxin generation [5]. Therefore, it is imperative to overcome the technological and systematic dilemma of the conventional recycling method for food waste and simultaneously develop an environment-friendly recycling method that can convert food wastes to high value product as ethanol fuel.
With an aim to develop a recycling system for food waste, Yan et al. [6] conducted a study to evaluate the critical variables that affect saccharification rate which is the rate limiting step in ethanol production from food wastes. Cekmecelioglu and Uncu [7] also tried to reduce the production cost by improving the pretreatment method of food wastes.
Generally, ethanol production utilizes the separate hydrolysis and fermentation (SHF) process, which includes a series of steps such as liquefaction, saccharification and fermentation [8-10]. A challenging perspective of our previous study was to apply a one-step process called the “consolidated continuous solid-state fermentation (CCSSF)” system which was composed of a rotating drum reactor, a humidifier and a condenser. The process combines enzymatic hydrolysis, ethanol fermentation and recovery of ethanol into a single operation. It could save overall fermentation time and the capital investment for reactors. Another advantage of CCSSF system is that the continuous repetitive fermentation allows for the yeast and enzyme to be reused. Furthermore, the CCSSF system uses minimum amount of water which reduces the volume and cost for waste treatment [11].
Typically, food waste is characterized by a high organic content since it contains soluble sugar, starch, lipids, proteins, cellulose and other compounds that make it a source of potential fermentative substrates [12]. In this experiment, three kinds of starchy food wastes were studied as model cases 1) bread crust; a processed starchy material that has low carbohydrate content and high amounts of moisture, 2) potato chips; a processed food material with high salt content and, 3) rice grain; nonprocessed starchy material (as a model of off-spec rice grain). Since the CCSSF system uses minimum amounts of water, the concentration of organic compounds in food wastes would be concentrated and might affect the activity of yeast and saccharifying enzyme. In this study, the feasibility of ethanol production using food wastes was investigated in a lab scale reactor. The ethanol production from each food waste per unit of CCSSF was compared. Furthermore, the effect of salt (as NaCl) on yeast and saccharifying enzyme was evaluated.
2. Materials and Methods
2.1. Yeast
A commercial dry yeast, Super Camellia (Nisshin, Tokyo) was used.
2.2. Samples of Food Waste
Bread crust, potato chips and rice grain (Japanese rice) used in this study were obtained from the market in Osaka prefecture, Japan. Bread crust was chopped into small pieces (about 5 × 5 mm), while potato chips were ground using ceramic mortar and pestle (particle size Æ < 2 mm). Rice grain was ground into small particles (particle size Æ < 355 mm) using a blender (wonder blender Model WB-1, Osaka chemical Co. Ltd., Osaka).
2.3. CCSSF System
The system consisted of a rotating drum reactor, a Liebig condenser and a humidifier [11]. The temperature of the reactor, condenser and humidifier were controlled at 32˚C, −10˚C and 37˚C, respectively.
2.4. Ethanol Fermentation
The fermentation mixture was composed of 3 g of the commercial dry yeast, 64.5 ml of water, 2645 GAU of StargenTM 002 (contains Aspergillus kawachi alpha-amylase expressed in Trichoderma reesei and a glucoamylase from Trichoderma reesei, Genencor; one glucoamylase unit (GAU) produces 1 g of reducing sugar calculated as glucose per hour from soluble starch substrate at pH 4.5, 48˚C). During fermentation, the pH of the fermentation mixture was maintained at 4.5 - 5.0 by adding 28% ammonium water (Wako Pure Chemical Industries, Ltd., Osaka), and the reactor was rotated at 5 rpm to prevent the sedimentation of fermentation mixture. When the ethanol content in the fermentation mixture reached a set value (40 g∙kg-mixture−1), the circulation of the headspace gas to the condenser and the humidifier was initiated and ethanol content was maintained within a range of 30 - 50 g∙kg-mixture−1 by changing the flow rate of the pump manually in accordance with the control protocol reported by Moukamnerd et al. [11]. Appropriate amount of the materials was added every 6 or 8 without withdrawing the residue. Since ethanol produced by fermentation acts as an antimicrobial agent, the fermentations were carried out under non-sterilized condition [13].
2.5. Analyses
For determination of carbohydrate content, 0.5 g of food waste was hydrolyzed with 72% sulfuric acid (Wako Pure Chemical Industries, Ltd., Osaka) and the carbohydrate content was measured by phenol-sulfuric acid method using glucose as standard [14]. Dry weight was analyzed by oven-drying the materials at 80˚C for 24 h. The ethanol and glucose contents were determined using a biosensor (Biosensor BF5, Oji Scientific Instruments Co., Ltd., Hyogo). The salt (NaCl) content was measured using a salt meter (Pocket PAL-ES1, Atago Co., Ltd., Tokyo). The specific rate of ethanol production from glucose was determined as follows. The fermentation mixture (about 0.2 g) harvested from the reactor was resuspended in 5 ml of YPD medium (10 g∙L−1 yeast extract, 20 g∙L−1 polypeptone and 30 g∙L−1 glucose). The suspension was transferred to a 15-ml plastic tube equipped with a check valve followed by degassing by an aspirator. The tube was incubated for 80 min at 32˚C and the ethanol concentration in the suspension was measured every 20 min. Fermentative activity was expressed as the specific rate of ethanol production from glucose (g∙g-drycell−1∙h−1).
3. Results
3.1. Raw Materials
In this study, three kinds of food waste materials namely bread crust, potato chips and rice grain were used. Table 1 summarizes the result of CCSSF for the three substrates used. Rice grain was mainly consisting of carbohydrate (0.76 ± 0.05 g∙g-raw-material−1) whereas bread
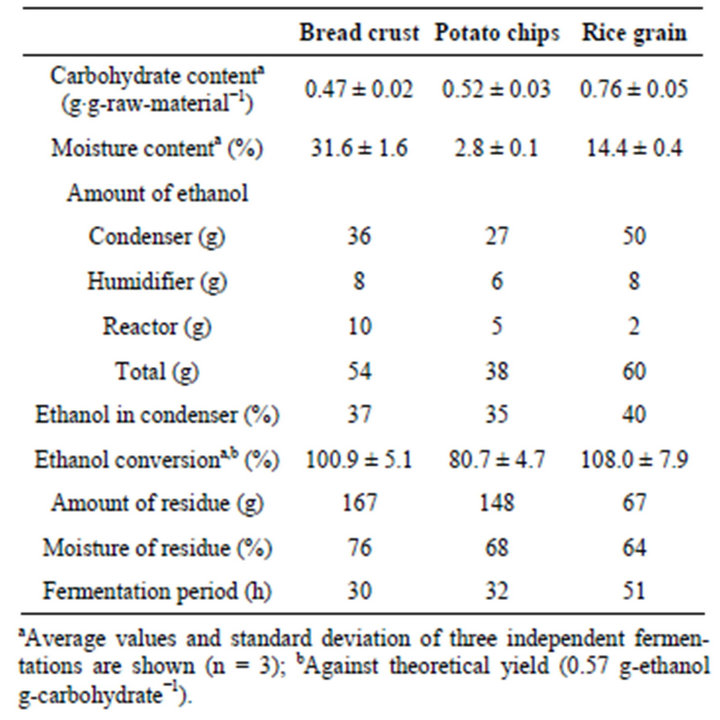
Table 1. Ethanol production from food wastes.
crust and potato chips contain protein, fat and salt.
3.2. Repetitive Fermentation
Since one of the advantages of the CCSSF system is that the running cost for saccharifying enzymes and yeast can be reduced by repetitive addition of raw material, repetitive fermentation was conducted for each food waste. Ethanol content was maintained in the range of 30 - 50 g∙kg-mixture−1 because the fermentative activity of yeast decreased markedly at an ethanol content above 50 g∙kg-mixture−1 whereas the concentration of recovered ethanol increased. Figure 1 shows representative time courses of two or more CCSSF for bread crust, potato chips and rice grain. The arrows indicate the timing of addition of raw material which was different depending on saccharification rate of each raw material.
For the CCSSF of bread crust (Figure 1(a)), 40 gram of bread crust was added to the reactor every 6 h for 5 times, and the fermentation needed to stop after the fifth batch since the reactor was filled with residue. A total of 200 g of bread crust produced 54 g of ethanol within 30 h. Total ethanol production corresponded to 100.9% ± 5.1% of ethanol conversion (against theoretical yield). The ethanol was continuously recovered and condenses to a clear solution with 37% (w/v) of ethanol concentration.
Figure 1(b) shows the CCSSF of potato chips, with a total input of 160 g of potato chips yielding 38 g of ethanol within 32 h. The produced ethanol corresponded to 80.7% ± 4.7% of ethanol conversion. The concentration of recovered ethanol was 35% (w/v).
The time course of CCSSF for rice grain is shown in Figure 1(c). The starting material of total 127 g of rice
 (a)
(a) (b)
(b) (c)
(c)
Figure 1. (a) CCSSF of bread crust; (b) Potato chips and (c) Rice grain.
grain was added into the reactor separately every 6 h. Within 51 h, 60 g of ethanol was produced and the ethanol conversion was 108.0% ± 7.9%. The concentration of recovered ethanol reached up to 40% (w/v).
In the CCSSF of potato chips, glucose started to accumulate after three batches, whereas no glucose accumulation was observed in both case of bread crust and rice grain. The residues from fermentation of bread crust, potato chips and rice grain were 167, 148 and 67 g with moisture of 76%, 68% and 64%, respectively (Table 1).
The time-course changes in the fermentative activity of yeast during fermentation were investigated and shown in Figure 2(a). The fermentative activity in the CCSSF of potato chips was drastically reduced after three batches, while the reduction was more gradual using rice grain and increased in the case of bread crust. During fermentation, the amount of salt (as NaCl) increased in case of bread crust and potato chips as shown in Figure 2(b). When NaCl concentration in the fermentation mixture exceeded 20 g∙L−1, the fermentative activeity of yeast decreased significantly, resulting in accumulation glucose (Figure 1(b), closed triangles).
3.3. Effect of Salt Content
The effects of salt on yeast and saccharification enzyme was evaluated since salt is always contained in food wastes. The effect of salt on ethanol fermentation was assessed by comparing the glucose and ethanol production within 24 h of incubation (Figure 3). No significant effect of salt on saccharifying enzyme was observed (Stargen 002), however, it directly affected the yeast activity. The ethanol production rate decreased when salt content was increased.
4. Discussion
4.1. CCSSF Conditions
Yeast is more tolerant to low-moisture conditions compared with other microorganisms. The commercial yeast used in the present study maintains a sufficient fermentative activity for CCSSF even at a moisture content of 40% (Data not shown). Although it is possible to perform CCSSF at moisture content less than 40%, it would become difficult to mix the fermentation mixture homogeneously, resulting in a non-homogeneous ethanol content that leads to further decrease in fermentative activity. Therefore, CCSSF should be performed at a moisture content of approximately 50% for homogeneous mixing, whereas the present CCSSF was conducted at 60% moisture content to ensure reproducible sampling.
4.2. Influences of the Composition of Raw Material on Fermentation
There was no glucose accumulation observed even after the third addition of bread crust and rice grain (Figure 1), indicating that the rate of glucose consumption by yeast cells could be maintained higher than the rate of glucose production by the saccharifying enzymes. However, the glucose level was found to increase in the case of potato chips after three batches. This increase would be due to a reduction in the activity of yeast. To clarify the reason for the accumulation of glucose, the effects of salt (NaCl) concentration on the activity of the yeast and the enzyme were investigated. As shown in Figure 3, the fermentative activity decreased with an increase in the NaCl concentration, whereas the enzyme activity was not affected.
 (a)
(a) (b)
(b)
Figure 2. Fermentative activity of yeast and salt concentration during fermentation of bread crust (closed circle), potato chips (open circle) and rice grain (closed triangles).

Figure 3. Effect of NaCl on yeast and saccharifying enzyme. Closed circle, glucose production rate; open circle, ethanol production rate.
Previous studies reported that gradual increase of NaCl in the growth medium for yeasts can cause a cell growth arrest depending on the NaCl concentration [4,15-18]. In addition, the reduction of water activity, even with salt concentrations as low as 5 g∙L−1 can still affect cell growth [19]. When CCSSF was carried out with minimum moisture content, the water activity was low, and therefore, the effect of salt was more pronounced than in liquid fermentation. These imply that although concentration of NaCl in CCSSF system is low, it could inhibit sugar uptake causing the period of ethanol fermentation to be prolonged. Therefore, the results suggest that when the fermentation mixture accumulated more than a certain level of NaCl that would affect yeast activity, and the reaction need to be stopped. On the other hand, a salt tolerant yeast strain should be utilized in order for the system to achieve higher efficiency of ethanol fermentation from food wastes.
4.3. The Amount of Ethanol Produced by a Unit of CCSSF System
For estimation of the profit for each food waste, it is necessary to know the amount of ethanol that can be produced by one unit of CCSSF system in a year. In a CCSSF system, the amount of ethanol [20], E (kL∙year−1), that can be produced by one unit of CCSSF system in a year is given as:

Where Mwg and Mwe are the molecular weights of glucose unit in carbohydrate and ethanol corresponding to 162 g-carbohydrate∙mol−1 and 46 g-ethanol∙mol−1, respectively; re is the specific gravity of ethanol equivalent to 0.79 kg∙L−1; M is capacity of CCSSF system (kg∙batch−1); D is operation period (day∙year−1); d is fermentation time (day∙batch−1); X is the carbohydrate content of the material (g-carbohydrate∙g-raw-material−1); and Y is ethanol yield (against theoretical yield).
To calculate the amount of ethanol produced by a unit of CCSSF system, the actual size of CCSSF system is assumed to be 3 m in diameter and 6 m in height. This diameter is the maximum width that can be transported by land in Japan. Based on the given dimensions, the inner volume of the reactor will be about 40 m3. The capacity of the CCSSF system, M, was temporarily set at 5 × 10³ kg∙batch−1. The operation period per year, D, was assumed to be 300 days in a year considering the maintenance period. The time required for a batch of fermentation, d, was calculated based on the experimental data. Similarly, the carbohydrate content, X and the ethanol yield, Y, were estimated from experimental data (Table 2).
The amount of ethanol produced by a unit of CCSSF in a year, E, from bread crust, potato chips and rice grain were calculated to be 527, 345 and 341 kL∙year−1, respectively. Even bread crust and potato chips were contained lower carbohydrate levels than rice grain, higher ethanol production by a unit of CCSSF in a year could be obtained. Jain et al. [21] reported that cooking rice affects the amylose content in starch by influencing the

Table 2. Estimated values for the parameters.
saccharification rate. To increase the ethanol production and reduce the operation time using rice grain, a pretreatment process may be necessary.
5. Conclusion
The ethanol production from food wastes was successfully carried out using the CCSSF system. In this system, ethanol was recovered continuously from the reactor and the ethanol conversions of bread crust, potato chips and rice grain were 100.9% ± 5.1%, 80.7% ± 4.7% and 108% ± 7.9%, respectively. It was found that salt contained in food wastes had a direct negative effect on yeast activity. In order to improve the system, salt tolerant yeast should be applied to the system. The results of this study indicate that the CCSSF system can be used to recycle food wastes.
6. Acknowledgements
This work was supported by Low Carbon Technology Research and Development Program organized by Ministry of the Environment. We thank Ms. Misa Takeuchi for technical assistance.
REFERENCES
- W. Su, H. Ma, M. Gao, W. Zhang and Q. Wang, “Research on Biodiesel and Ethanol Production from Food Waste,” 4th International Conference on Bioinformatics and Biomedical Engineering (iCBBE), Chengdu, 18-20 June 2010, pp. 1-4.
- S. Yan, P. Wang, Z. Zhai and J. Yao, “Fuel Ethanol Production from Concentrated Food Waste Hydrolysates in Immobilized Cell Reactors by Saccharomyces cerevisiae H058,” Journal of Chemical Technology and Biotechnology, Vol. 86, No. 5, 2011, pp. 731-738. doi:10.1002/jctb.2581
- Ministry of the Environment, Government of Japan, “2010 Establishing a Sound Material-Cycle Society, Milestone toward a Sound Material-Cycle Society through Changes in Business and Life Styles,” 2010. http://www.env.go.jp/en/recycle/smcs/a-rep/2010gs_full.pdf
- H. C. Moon, I. S. Song, J. C. Kin, Y. Shirai, D. H. Lee, J. K. Kim, S. O. Chung, D. H. Kim, K. K. Oh and Y. S. Cho, “Enzymatic Hydrolysis of Food Waste and Ethanol Fermentation,” International Journal of Energy Research, Vol. 33, 2009, pp. 164-172. doi:10.1002/er.1432
- W. Nishijima, H. B. Gonzales, H. Sakashita, Y. Nakano and M. Okada, “Improvement of Biological Solubilization and Mineralization Process for Food Waste,” Journal of Water and Environment Technology, Vol. 2, No. 2, 2004, pp. 57-64. doi:10.2965/jwet.2004.57
- S. Yan, J. Li, X. Chen, J. Wu, P. Wang J. Ye and J. Yao, “Enzymatic Hydrolysis of Food Waste and Bioethanol Production from the Hydrolysate,” Renewable Energy, Vol. 36, No. 4, 2011, pp. 1259-1265. doi:10.1016/j.renene.2010.08.020
- D. Cekmecelioglu and O. N. Umcu, “Kinetic Modeling of Enzymetic Hydrolysis of Pretreated Kitchen Wastes for Enhancing Bioethanol Production,” Waste management, in Press.
- Q. Wang, H. Ma, W. Xu, L. Gong, W. Zhang and D. Zou, “Ethanol Production from Kitchen Garbage Using Response Surface Methodology,” Biochemical Engineering Journal, Vol. 39, No. 3, 2008, pp. 604-610. doi:10.1016/j.bej.2007.12.018
- J. H. Kim, J. C. Lee and D. Pak, “Feasibility of Production Ethanol from Food Waste,” Waste Management, Vol. 31, No. 9-10, 2011, pp. 2121-2125. doi:10.1016/j.wasman.2011.04.011
- S. Yan, J. Yao, L Tao, Z. Zhi, X. Chen and J. Wu, “Fed Batch Enzymatic Saccharification of Food Waste Improve the Sugar Concentration in the Hydrolysates and Eventually the Ethanol Fermentation by Saccharomyces cerevisiae H058,” Brazilian Archives of Biology and Technology, Vol. 55, No. 2, 2012, pp. 183-192. doi:10.1590/S1516- 89132012000200002
- C. Moukamnerd, M. Kino-oka, M. Sugiyama, Y. Kaneko, C. Boonchird, S. Harashima, H. Noda, K. Ninomiya, S. Shioya and Y. Katakura, “Ethanol Production from Biomass by Repetitive Solid-State Fed-Batch Fermentation with Continuous Recovery of Ethanol,” Applied Microbiology and Biotechnology, Vol. 88, No. 1, 2010, pp. 87-94. doi:10.1007/s00253-010-2716-y
- L. Arsova, “Anaerobic Digestion of Food Waste: Current Status, Ploblem and an Alternative Product,” M.Sc. Dissertation, Fu Foundation of Engineering and Applied Science, Columbia University, Washington DC, 2010.
- Y. Katakura, C. Moukamnerd, S. Harashima and M. Kinooka, “Strategy for Preventing Bacterial Contamination by Adding Exogenous Ethanol in Solid-State Semi-Continuous Bioethanol Production,” Journal of Bioscience and Bioengineering, Vol. 111, No. 3, 2011, pp. 343-345. doi:10.1016/j.jbiosc.2010.11.012
- S. R. Mikkelsen and E. Cortón, “Spectroscopic Methods for Matrix Characterization, in Bioanalytical Chemistry,” John Wiley & Sons, Inc., Hoboken, 2004. doi:10.1002/0471623628.ch1
- T. G. Watson, “Effects of Sodium Chloride on StreadyState Growth and Metabolism of Saccharomyces cerevisiae,” Journal of General Microbiology, Vol. 64, No. 1, 1970, pp. 91-99. doi:10.1099/00221287-64-1-91
- S. C. Sharma, “A Possible Role of Trehalose in Osmotolerance and Ethanol Tolerance in Saccharomyces cerevisiae,” FEMS Microbiology Letters, Vol. 152, 1997, pp. 11-15. doi:10.1111/j.1574-6968.1997.tb10402.x
- A. Trainotti and B. U. Stambuk, “NaCl Stress Inhibits Maltose Fermentation by Saccharomyces cerevisiae,” Biotechnology Letter, Vol. 23, No. 20, 2001, pp.1703-1707. doi:10.1023/A:1012456432280
- T. Hirasawa, T. Nakamura, K. Yoshikawwa, K. Ashitani, K. Nagashisa, C. Furusawa, Y. Katakura, H. Shimizu and S. Shioya, “Comparative Analysis of Transcriptional Responses to Saline Stress in the Laboratory and Brewing Strains of Saccharomyces cerevisiae with DNA Microarray,” Applied Microbiology and Biotechnology, Vol. 70, No. 3, 2006, pp. 346-357. doi:10.1007/s00253-005-0192-6
- A. Almagro, C. Prista, S. Castro, C. Quintas, A. MadeiraLopes, J. Ramos and M. C. Loureiro-Dias, “Effect of Salts on Debaryomyces hansenii and Saccharomyces cerevisiae under Stress Conditions,” International Journal of Food Microbiology, Vol. 26, 2000, pp. 191-197. doi:10.1016/S0168-1605(00)00220-8
- C. Moukamnerd, “Ethanol Production from Biomass Using Consolidated Continuous Solid-State Fermentation System,” Ph.D. Dissertation, Osaka University, Osaka, 2011.
- A. Jain, S. M. Rao, S. Sethi, A. Ramesh, S. Tiwari, S. K. Mandal, N. K. Singh, N. Modi, V. Bansal and C. Kalaichelvani, “Effect of Cooking On Amylose Content of Rice,” European Journal of Experimental Biology, Vol. 2, No. 2, 2012, pp. 385-388.
NOTES
*Corresponding author.