Journal of Environmental Protection
Vol. 4 No. 7 (2013) , Article ID: 34781 , 12 pages DOI:10.4236/jep.2013.47081
Unified Data Model of Urban Air Pollution Dispersion and 3D Spatial City Model: Groundwork Assessment towards Sustainable Urban Development for Malaysia
![]()
1Department of Geoinformation, Faculty of Geoinformation & Real Estate, Universiti Teknologi Malaysia, Johor, Malaysia; 2Department of Geodesy, Denmark National Space Institute, Technical University of Denmark, Lyngby, Denmark.
Email: *mduznir@utm.my
Copyright © 2013 Uznir Ujang et al. This is an open access article distributed under the Creative Commons Attribution License, which permits unrestricted use, distribution, and reproduction in any medium, provided the original work is properly cited.
Received April 25th, 2013; revised May 27th, 2013; accepted June 24th, 2013
Keywords: 3D Spatial City Model; Urban Air Dispersion Model; Unified Data Model; Sustainable Urban Development; CityGML; 3D Visualization; 3D GIS
ABSTRACT
Understanding the behavior of urban air pollution is important en route for sustainable urban development (SUD). Malaysia is on its mission to be a developed country by year 2020 comprehends dealing with air pollution is one of the indicators headed towards it. At present monitoring and managing air pollution in urban areas encompasses sophisticated air quality modeling and data acquisition. However, rapid developments in major cities cause difficulties in acquiring the city geometries. The existing method in acquiring city geometries data via ground or space measurement inspection such as field survey, photogrammetry, laser scanning, remote sensing or using architectural plans appears not to be practical because of its cost and efforts. Moreover, air monitoring stations deployed are intended for regional to global scale model whereby it is not accurate for urban areas with typical resolution of less than 2 km. Furthermore in urban areas, the pollutant dispersion movements are trapped between buildings initiating it to move vertically causing visualization complications which imply the limitations of existing visualization scheme that is based on two-dimensional (2D) framework. Therefore this paper aims is to perform groundwork assessment and discuss on the current scenario in Malaysia in the aspect of current policies towards SUD, air quality monitoring stations, scale model and detail discussion on air pollution dispersion model used called the Operational Street Pollution Model (OSPM). This research proposed the implementation of three-dimensional (3D) spatial city model as a new physical data input for OSPM. The five Level of Details (LOD) of 3D spatial city model shows the scale applicability for the dispersion model implementtation. Subsequently 3D spatial city model data commonly available on the web, by having a unified data model shows the advantages in easy data acquisition, 3D visualization of air pollution dispersion and improves visual analysis of air quality monitoring in urban areas.
1. Introduction
Since 1950’s the world’s population increases to triple in 25 years [1]. The world’s population is projected up to 7.3 billion in 2015. Table 1 shows Asia is among the regions that indicate a drastic increase in urban percentage. Asia percentage for average annual rate of change for an urban area is 2.39% and for rural area it decreases 0.2%. In Malaysia, urban population rises from 1,244,000 in 1950 to 20,150,000 in 2010 (Figure 1).
Besides population increasing, another factor that comes to pass concomitantly is the urbanization processespecially in developing countries. Usually the situation arose when people move from rural areas to urban areas for a better living standard. For instance, in Malaysia the projected annual rate percentage population living in rural areas decreases dramatically from 28% to 12% of the total population at year 2010 and 2050 consecutively (Figure 1). Annual rates of change percentage for urbanization retain growing positively and showed the trend will absolutely necessitate urban development.
Urbanization process gives impacts in a range of economic, political, social, cultural, and environmental. Based on current and previous research, it shows that urbanization usually contributes negative impacts on the

Table 1. World’s urban population from 2011 to 2050 [2].

Figure 1. Annual percentage of Malaysia’s urban population (Source: Population Division of the Department of Economic and Social Affairs of the United Nations Secretariat, world population prospects: the 2006 revision and world urbanization prospects: the 2007 revision, http://esa.un.org/unup, Tuesday, April 24, 2012; 2:19:41 am).
environment if the developments are not taking into considerations of having a proper development process [3- 5]. Realizing these challenges, major cities tend to minimize the negative effects and build the benefits [6-8]. Therefore people are looking forward to a sustainable urban environment in developing urban spaces that meet the standard for future generations and fulfill current development needs.
Sustainable urban development can be described as development that improves the long-term health of social and ecological cities and towns [9]. It reflects The Rio Declaration on Environment and Development, Agenda 21 by the United Nations, stated:
Principle 1: “Human beings are at the center of concern for sustainable development. They are entitled to a healthy and productive live in harmony with nature.”
This situation has caused development tends to organize pollutions by understanding the pollution behavior. Less pollution is one of the major characteristics of sustainable developments [9]. Understanding the pollution behavior is important in the planning stage in order to control and manage pollution. In this paper, focuses are meant for urban air pollution, one of most pronounces urban pollution [10]. In Malaysia, preceding research based on several cases showed that air pollution gives an impact on human health [11]. Since Malaysia is on the move to become a developed country by the year 2020, managing air pollution is one of the indicators headed for that mission. Therefore in this research the discussion is constructed on the unified data model of urban air dispersion models for link-based air pollution source with 3D spatial city models as a useful data input expansion and visualization. Section 2 in this research paper discussed on the initiatives and limitations in Malaysia regarding to air quality monitoring in urban areas. Meanwhile Section 3 explains the 3D spatial city models technical details, modules and possible implementation for air quality monitoring in urban areas. Moreover thorough discussions were made in Section 4 regarding the integration of urban air pollution dispersion model in 3D spatial city models. Later Section 5 shows the unified data model proposed for implementation and simulation result of air dispersion in 3D spatial city models. The integration was studied thoroughly and a unified data model was presented in this paper.
2. Policies, Monitoring Stations and Scale Model Limitations in Malaysia
In the current 10th Malaysia’s Plan, Thrust 4: “To Improve the Standards and Sustainability of Quality of Life” shows that Malaysia be present in positioning its part towards The Rio Declaration on Environment and Development, Agenda 21 by the United Nations. It can be perceived in policies on the subject of land use, climate change and green technology. As an example, for land use—National Physical Plan (NPP) and National Urbanization Policies (NUP); Climate change—National Policies on Climate Change and Road Map for Reduction of GHG Emissions; and Green technology National Green Technologies Policy.
However, moving towards sustainable development for urban spaces is not an easy task. Despite the fact that policies regarding on the sustainable development are present, but to manage spaces with rapid development, active industrialization and high traffic volumes form a different scenario for the administration. Monitoring air quality in urban areas requires more monitoring stations to be positioned near to cities whereby it is unmanageable and not practical. Due to that limitation, monitoring stations are planned for large scale air quality model [12, 13].
Scale model in air quality modeling can be characterized into several groups. According to Srivastava and Rao [14] the categories are Global, Synoptic, Regional, Meso-scale and Micro-scale model. Different scale model gives difference influence in air quality modeling visualization. Table 2 shows the different domain scale for each category. Each domain identifies different accuracy of air quality monitoring. Smaller grids will give a more accurate model for specific area compared to larger grids whereby it will calculate the mean for total grids.
Nevertheless, current situations in many countries the available information are range from Global to Regional scale model. It is due to several factors. Vardoulakis, Fisher, Pericleous, and Gonzalez-Flesca [15] discovered that monitoring stations in urban areas are limited to a few sites and often it is located at airports. As for an example, the Malaysian Meteorological Department monitors 22 air pollution monitoring stations throughout the country (Figure 2). Meanwhile, Department of Environment Malaysia only has 15 continuous air quality monitoring stations in urban areas and their major focus is in Klang Valley whereby the capital city of Malaysia, Kuala Lumpur is located (Figure 3). These stations are based on regional scale model and did not focus on a specific area that less than 2 km grid. Unfortunately, the major source of air pollution in urban cities comes from vehicle

Table 2. Typical domain for different scale model [14].

Figure 2. Location of air pollution monitoring stations by Meteorological Department, Malaysia.
emissions [16]. Heavy traffic and slow vehicle movements seem will trap the pollutant emission inside of the urban geometry. The circulation of pollutant between buildings will worsen if there is no natural ventilation or slow background wind speed. However it is crucial to monitor air pollution in urban cities in order to have a better and healthy living standard. But to deploy monitoring stations at street level will affect the cost. This is one of the reasons why it is difficult to have a Micro scale model for air pollution monitoring in urban area [17].
Another alternative is to perform air quality modeling in the urban area [18,19]. Since the agent (pollutants) is a moving object, appropriate modeling approach in a rapid development place need to be deliberate comprehensively. In a practical approach, the urban air quality model requires several data input [15]. The geometry of an area model is important in order to produce a more accurate result. To date, there are complications in data acquisition for rapid development places. New data input like building geometries (e.g. Building’s height, width and gaps) need to be collected from ground measurements and re-calculated with other inputs (e.g. street geometries). This data is important in air quality modeling (dispersion model) to produce an accurate output.
In air dispersion models, it consists of two major groups of data: meteorological and physical data (Figure 4). Meteorological department monitors information regarding to meteorological circumstances (i.e. Wind speed, pollution concentration, wind direction and etc.). Moreover in several countries these data are available for public use. On the other hand for physical (spatial) data, the exact geometrical state for the modeling is required because different geometries for the street canyon will affect the dispersion movement. Therefore the exact street geometry measurements are necessary in order to calculate the air dispersion model.
Current practice in acquiring those data is via ground

Figure 3. Location of continuous air quality monitoring stations by Department of Environment, Malaysia.

Figure 4. Urban air dispersion modeling and 3D spatial city model conceptual data integration.
or space measurement inspection such as field survey, photogrammetry, laser scanning, remote sensing or using architectural/floor plans [20-22]. But in order to measure the geometrical data for developing areas, there are complications in terms of data acquisition. Development area such as in major cities will involves with rapid changes that causes data updating difficulties for air pollution modeling. Therefore this research proposed a unified data model between air quality models with 3D spatial city modeling. As in Figure 4, all spatial information needed in air quality models is available in 3D spatial city modeling. Although 3D spatial city model (i.e. CityGML) is an open-standard data model, nevertheless with a proper amalgamation with air quality modeling, 3D spatial city model can be a new way of data input for visualizing air pollution dispersion model.
3. 3D Spatial City Model
Users now interested in the visualization of 3D objects [23-26]. It can be seen from the user demand viewpoint in 3D based applications [27-29]. This is to facilitate the visualization of 3D objects as it is more realistic than the two-dimensional (2D) display. Undoubtedly that a 3D view of a building model is more realistic compared to 2D floor plan or a cross section of a building plan. At present, in order to promote investors and tourism, most of the major cities have acquired 3D building models (Figure 5). They also plan to increase those numbers based on their development growths.
The trends of 3D spatial city model development can be seen from the efforts of many [30,31]. Some of them are coming from a private business, government, academicians, researchers or group of students. There are various tools on the market which facilitate these parties to develop those 3D models. Some of them develop this model as a hobby while others develop it as a planning for the future. However, these models are mainly used for visualization. Most of the visualization is just to perceive the development that took place in a city or just to get an insight at interesting architectural shapes of buildings with simple information inquiries.
Based on this trend, 3D data will be an important resource in the near future. Figures 6 and 7 show that there is a need in requiring a more comprehensive way of describing urban air pollution behavior. Based on these scenarios, researchers try to view urban air pollution in 3D visualization [32,33].
3D visualization gives a better understanding of air pollution dispersion models. In Figure 8, a warning line for NO2 pollution level is drawn on a 3D building model. Until recently, Metral, Falquet, and Karatzas [34] discovered the integration of air quality models with 3D spatial city model can create an interoperable way for air quality models in 3D. The existing CityGML structure consists of useful information for the ontology of the urban planning process (OUPP).
The relevancy of using the 3D spatial city model (CityGML) for air quality monitoring is its scale. As discussed in Section 2, air quality modeling in urban areas requires a scale model that less than 2 km resolution. But to acquire data for micro-scale urban areas is challenging. Detailed geometries for buildings and street objects are necessary before executing the calculations. However in CityGML they have different scales for implementations called the Levels of Detail (LOD). Each five LODs are based on precisely in what way specific model required in different applications (Figure 9). Based on these LODs, LOD1 and LOD2 appear related to the scale model by less than 2 km resolution in urban air pollution dispersion model. LOD1 is the well-known blocks model comprising prismatic buildings with flat roofs. Meanwhile, a building in LOD2 has differentiated roof structures and thematically differentiated surfaces. The generalizations of spatial objects for each LOD are described in Table 3.
CityGML consists of modules for different city objects (Figure 10). Among those modules are Building module, City Furniture module and Transportation module where by those modules is important as a physical data input for urban air pollution dispersion modeling (Table 4). Meanwhile other modules such as the Textured Surface module will enhance the 3D visualization for perceiving the dispersion process and create a more realistic urban environment for visual analysis.
From the discussion, it shows that by having a 3D spatial city model like CityGML, there are potentials in incorporating it with air quality monitoring. With the available sources, format, standard, and modules in CityGML, it will provide a reliable platform for air quality monitoring in the 3D spatial city model. In the next section, the discussion is based on the details of air pollution dispersion model in urban areas. Moreover, in detail explanation about the specific model for air quality monitoring in urban areas called Operational Street Pollution Model (OSPM) which is practical for urban geometries.
4. Air Pollution Dispersion Models (APDM) in 3D Spatial City Model
In urban area, major pollution source is contributed by vehicle (land transportation) emission. According to the compendium of environment statistics Malaysia 2012 by Department of Environment Malaysia, motor vehicle sources emit 69.4 percent of pollutants to the atmosphere, followed by stationary sources emit 27.3 percent and other sources emit 3.3 percent in the year 2011. This fact

Table 3. LOD 0-4 of CityGML with its accuracy requirements [36].

Table 4. LOD 0-4 of CityGML with its accuracy requirements [36].

Figure 5. 3D spatial city models available on the web in March 2013.
is supported by other researchers [11,37] in identifying the major source of air pollution in major cities. This moving emission source will create a line of emission along the roadway. Therefore, this emission source can be categorized as a link-based emission source.
A link-based of CO emission from land transportation

Figure 6. Wind flow around a building [34].

Figure 7. Road type categories [32].
will disperse along the roadway between buildings inside the street geometry. By using parameters required, dispersion models can calculate and map the dispersion movements inside the street geometry. Among dispersion models such as the Statistical Models, Eulerian Models, Street Canyon Models (SCM), Box Models and Gaussian Models, SCM can be seen as the fit model to be implemented in the 3D spatial city model [34]. Parameters in SCM deliberated most of the major dispersion factors such as street geometries, building geometries, vehicle speed, pollutant emission and background contribution. Therefore a practical Street Canyon Models called Operational Street Pollution Model (OSPM) will be discussed in the next section as one of the suitable models to implement in the 3D spatial city model.

Figure 8. Pollution warning line [32].

Figure 9. The five levels of detail (LOD) defined by CityGML [35].
4.1. The Operational Street Pollution Model (OSPM)
The Operational Street Pollution Model (OSPM) is a consequent of STREET model. The general concept of OSPM: vehicle emission or exhaust gases are calculated using the plume model (for direct contribution), box model (for recirculating pollutant) and background pollutant information. Figure 11 shows the structure model for OSPM. An assumption in OSPM is that both the traffic and emissions are equally distributed across the street canyon. Next, the cross wind circulation is omitted. Only the wind direction at the street level is assumed to be mirror reflected with the roof level wind. Moreover, the extension of the recirculation zone will identify the length of the integration path.
Considering the detail OSPM concept as shown in Figure 12, the main parameters are roof level wind, background pollution, recirculating air, direct plume, leeward and windward information. The length of the vortex, calculated along the wind direction, is twice the upwind building height. For roof-level wind speeds be-

Figure 10. UML package diagram illustrating the separate modules of CityGML and their schema dependencies [36].

Figure 11. Operational street pollution model structure.

Figure 12. Operational street pollution model illustration concept (http://www.dmu.dk/en/air/models/ospm/).
low 2 m/s, the length of the vortex decreases linearly with the wind speed. The buildings along the street may have different heights, affecting the length of the vortex and the modeled concentrations. The upwind receptor (lee-side) receives contributions from the traffic emissions within the area occupied by the vortex (the recirculation zone), the recirculated pollution and a portion of the emissions from outside of the vortex area. The downwind receptor (wind-side) receives contributions from the recirculated pollution and the traffic emissions from outside of the recirculation zone only. As the wind speed approaches zero or is parallel with the street, concentrations on the both sides of the street became equal. The vertical dispersion is modeled assuming a linear growth of the plume with the distance from the source.
4.2. OSPM in Urban 3D Spatial City Model Application
Pollution concentration in OSPM is contributed by three major aspects. It is the Direct Contribution (Cd), Recirculation Components (Cr) and Background Concentration (Cb). Pollutant Concentration (Cp) can be calculated by adding Cd + Cr + Cb.
Cd is caused by vehicle/land transportation emission through wind direction to receptor. Concentration from each vehicle that moves will form a line of emission along the street. The concentration can be calculated using Equation (1).
 (1)
(1)
where, Cd = Concentration contribution from the source; Q = Emission source; W = Street width; σw = Vertical turbulence speed; ho = Initial dispersion height; Ub = Street level wind speed.
Where σw and σwo can be calculated using Equation (2) and Equation (3).
 (2)
(2)
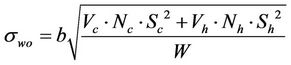 (3)
(3)
where, σwo = Traffic turbulence speed; Vc = Vehicle speed (passenger car), Vh = Vehicle speed (heavy vehicles); Nc = Number of passenger car, Nh = Number of heavy vehicles; Sc = Horizontal area occupied (passenger car), Sh = Horizontal area occupied (heavy vehicles); b = Aerodynamic coefficient drags (0.3).
Another important calculation in OSPM is street level wind speed (ub) that can be calculated using Equation (4).
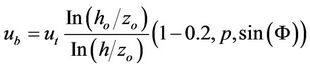 (4)
(4)
where, ut = Wind speed (roof); ho = Vehicle initial dispersion; H = Average building height (leeward and windward); p = Leeward Height/H; zo = Roughness length.
For Recirculation Components (Cr) it requires street geometry information for calculation. Figure 13 illustrates the calculation for Cr.
Where Inflow = Outflow (Upper) + Outflow (Side), Outflow (Upper) = Cr × σwt × 0.5L and Outflow (Side) = Cr × ud × Ls.
5. Unified Data Model of Urban Air Dispersion Models in 3D Spatial City Model
Urban air pollution dispersion models involves with meteorological and physical data. According to Vardoulakis, Fisher, Pericleous, and Gonzalez-Flesca [15] five major parameters involved in most dispersion models are presented in Table 5.
Based on Table 5, those models require more information in three dimensional (3D) forms whereby the spatial information is retrievable from a 3D spatial city model. This could provide precise and effective urban air quality models for future planning. On the other hand,


Table 5. Major data inputs of air dispersion models.

Figure 13. Recirculation components.
although it is retrievable from a 3D spatial city model but it is not a straightforward task. The framework of the 3D spatial city model is intended for general application purposes (e.g. 3D data transfer, web-enabled) and is still in a construction phase for specific application implementation. Based on previous work, air pollution data visualization in 3D is complex [33].
Therefore this research proposed an integrated data model between air pollution dispersion model with a 3D spatial city model in an effort to bridge the gap concerning both fields. The 3D spatial city model encompasses geometrical information which is useful in air pollution dispersion model. Furthermore 3D spatial city model offers 3D visualization which will improve insight in understanding the dispersion process based on parameters included. Hence, its implementation will give a better perception of the air pollution in reality. This is advantageous for decision makers and town planners in order to understand urban ecology in major cities towards sustainable urban development. Many researchers are in the direction towards 3D visualization in air pollution models [32,38,39] regarding to the advantages of better visual analysis.
Figure 14 shows a Unified Modeling Language (UML) for the data model. UML is a standardized general-purpose modeling language in the field of object-oriented software engineering. It shows the attributes of CityGML in conjunction with OSPM parameters for the amalgamation.
One of the advantages of implementing OSPM in the 3D spatial city model is the 3D visualization. For instance, recirculation zone (as discussed in the previous section) is one of the important criteria in OSPM. The calculation involved (Section 4.1) gives a numerical output for the recirculation zone length. Unfortunately, numerical value is hard to perceive for visual analysis. Moreover, the different roof wind speed will give different values and can affect the canyon geometry. Figure 15 shows the integration of calculating the recirculation zone in 3D spatial city model visualization with 3 different values for roof wind speed. By taking the roof wind speed data, the affected area in the recirculation zone can be calculated, viewed in 3D and analyzed for future references.
6. Summary
Air quality monitoring in urban areas is a crucial factor in order for Malaysia to achieve sustainable development growth. This research has been motivated by other researchers that studied the relationship, possibilities and advantages of using a 3D spatial city model for air quality monitoring [33,34,38,39]. This paper explains the advantages of using a 3D spatial city model in the urban air quality model (dispersion model) in the aspect of model scaling, data acquiring, 3D visualization and visual analysis. Acquiring information about pollutant dispersion in urban areas requires a scale model of less than

Figure 14. The Unified Modelling Language (UML) for air dispersion model with 3D spatial city model integration.

Figure 15. Recirculation zone in the 3D spatial city model with different roof wind speed: (A) 1.0 mph, (B) 1.5 mph and (C) 2.0 mph.
2 km resolution. As discussed in Section 2, to set up monitoring stations for each city is not practical. Therefore for meso-scale or micro-scale model, performing urban air pollution dispersion model is relevant to the 3D spatial city model as a new way of data input. Data acquiring for air pollution dispersion model is at ease by having a unified data model for integrating urban air pollution model with a 3D spatial city model proposed in this research. Visualization in 3D will improve the visual analysis for understanding the behavior of air pollutant dispersion. The future idea is to implement the developed unified data model in the aspects of geometrical and topological data structure. By having a 3D topological data structure, information regarding different layers of air pollution concentrations can be straightforwardly identified and analyzed.
7. Acknowledgements
Major funding for this research was provided by the Ministry of Higher Education Malaysia and partially funded by the Land Surveyors Board of Malaysia.
REFERENCES
- B. J. L. Berry, “Urbanization,” In: J. M. Marzluff, et al., Eds., Urban Ecology, Springer, New York, 2008, pp. 25- 48. doi:10.1007/978-0-387-73412-5_3
- United Nations, Department of Economic and Social Affairs Population Division, “World Urbanization Prospects, the 2011 Revision,” United Nation, New York, 2012.
- H. Doygun and H. Alphan, “Monitoring Urbanization of Iskenderun, Turkey, and Its Negative Implications,” Environmental Monitoring and Assessment, Vol. 114, No. 1, 2006, pp. 145-155.
- V. Ramanathan and Y. Feng, “Air pollution, Greenhouse Gases and Climate Change: Global and Regional Perspectives,” Atmospheric Environment, Vol. 43, No. 1, 2009, pp. 37-50.
- L. Wang, J. Lyons, P. Kanehl and R. Bannerman, “Impacts of Urbanization on Stream Habitat and Fish across Multiple Spatial Scales,” Environmental Management, Vol. 28, No. 2, 2001, pp. 255-266.
- G. Yue Ray, “China’s Future Requires Managing Its Urbanization ‘Right’,” IACP, 2011, pp. 1-8.
- R. Dayaratne, “Moderating Urbanization and Managing Growth: How Can Colombo Prevent the Emerging Chaos?” World Institute for Development Economics Research, 2010.
- M. Fang, C. K. Chan and X. Yao, “Managing Air Quality in a Rapidly Developing Nation: China,” Atmospheric Environment, Vol. 43, No. 1, 2009, pp. 79-86.
- S. Wheeler, “Planning for Sustainability: Creating Livable, Equitable & Ecological Communities,” Routledge, New York, 2004. doi:10.4324/9780203300565
- B. Ericson, D. Hanrahan and V. Kong, “The World’s Worst Pollution Problems: The Top Ten of the Toxic Twenty,” Blacksmith Institute and Green Cross, 2008.
- R. Afroz, M. N. Hassan and N. A. Ibrahim, “Review of Air Pollution and Health Impacts in Malaysia,” Environmental Research, Vol. 92, No. 2, 2003, pp. 71-77.
- E. M. Roberts, “Design Methodology for Optimum Dosage Air Monitoring Site Selection,” Atmospheric Environment (1967), Vol. 18, 1984, pp. 1243-1244.
- E. G. Ferradás, M. D. Miñarro, I. M. Morales Terrés and F. J. Marzal Martínez, “An Approach for Determining Air Pollution Monitoring Sites,” Atmospheric Environment, Vol. 44, No. 21-22, 2010, pp. 2640-2645.
- A. Srivastava and B. P. S. Rao, “Urban Air Pollution Modeling, Air Quality-Models and Applications,” In: P. D. Popovic, Ed., Air Quality-Models, InTech, Morn Hill, 2011.
- S. Vardoulakis, B. E. A. Fisher, K. Pericleous and N. Gonzalez-Flesca, “Modelling Air Quality in Street Canyons: A Review,” Atmospheric Environment, Vol. 37, No. 2, 2003, pp. 155-182. doi:10.1016/S1352-2310(02)00857-9
- G. Rhys-Tyler, W. Legassick and M. C. Bell, “The Significance of Vehicle Emissions Standards for Levels of Exhaust Pollution from Light Vehicles in an Urban Area,” Atmospheric Environment, Vol. 45, No. 19, 2011, pp. 3286-3293.
- A. Steed, S. Spinello, B. Croxford and C. Greenhalgh, “e-Science in the Streets: Urban Pollution Monitoring,” In: S. J. Cox, Ed., Proceedings of UK e-Science All Hands Meeting, Nottingham, 2-4 September 2003, pp. 36-42.
- J.-H. Woo, H. Kim, S. Lim, J.-J. Kim, J. Lee, R. Ryoo, et al., “Air Scope: A Micro-Scale Urban Air Quality Management System,” In: C.-H. Hsu, L. Yang, J. Park and S.-S. Yeo, Eds., Algorithms and Architectures for Parallel Processing, Springer, Berlin, 2010, pp. 520-527.
- T. Elbir, N. Mangir, M. Kara, S. Simsir, T. Eren and S. Ozdemir, “Development of a Gis-Based Decision Support System for Urban Air Quality Management in the City of Istanbul,” Atmospheric Environment, Vol. 44, No. 4, 2010, pp. 441-454.
- F. Tack, G. Buyuksalih and R. Goossens, “3D Building Reconstruction Based on Given Ground Plan Information and Surface Models Extracted from Spaceborne Imagery,” ISPRS Journal, Vol. 67, No. 1, 2012, pp. 52-64.
- N. Haala and M. Kada, “An Update on Automatic 3D Building Reconstruction,” ISPRS Journal, Vol. 65, No. 6, 2010, pp. 570-580.
- E. Zalama, J. Gómez-García-Bermejo, J. Llamas and R. Medina, “An Effective Texture Mapping Approach for 3D Models Obtained from Laser Scanner Data to Building Documentation,” Computer-Aided Civil and Infrastructure Engineering, Vol. 26, No. 5, pp. 381-392, 2011. doi:10.1111/j.1467-8667.2010.00699.x
- B. X. Jin and F. L. Bian, “Study on Visualization of 3D City Model Based on Grid Service,” Computer Engineering, Vol. 32, No. 4, 2006, pp. 217-235.
- J. Behley and V. Steinhage, “Generation of 3D City Models Using Domain-Specific Information Fusion,” In: M. Fritz, B. Schiele and J. H. Piater, Eds., Computer Vision Systems, Springer, Berlin, 2009, pp. 164-173.
- L. F. Liu and J. Y. Fang, “An Accelerated Approach to Create 3D Web Cities,” 17th International Conference on Geoinformatics, Fairfax, 12-14 August 2009, pp. 1-4.
- K. H. Sharkawi, M. U. Ujang and A. Abdul Rahman, “3D Navigation System for Virtual Reality based on 3D Game Engine,” ISPRS, Beijing, 2008.
- M. Freitas, A. A. Sousa and A. Coelho, “Evaluation of Visualization Features in Three-Dimensional LocationBased Mobile Services,” ISTIC&C, Setubal, 2009.
- Z. P. Zhang, J. T. Fang and R. H. Jing, “Interactive Visualisation of 3D City Models Based on Adaptive Streaming of 3D-GIS Data,” 5th International Conference on Information Assurance and Security, Xi’an, 18-20 August 2009, pp. 417-420.
- M. Y. Izham, U. Muhamad Uznir, A. R. Alias, K. Ayob and I. Wan Ruslan, “Influence of Georeference for Saturated Excess Overland Flow Modelling Using 3D Volumetric Soft Geo-Objects,” Computers & Geosciences, Vol. 37, No. 4, 2011, pp. 598-609.
- M. Over, A. Schilling, S. Neubauer and A. Zipf, “Generating Web-Based 3D City Models from Open Street Map: The Current Situation in Germany,” Computers, Environment and Urban Systems, Vol. 34, No. 6, 2010, pp. 496-507. doi:10.1016/j.compenvurbsys.2010.05.001
- A. Toshev, P. Mordohai and B. Taskar, “Detecting and Parsing Architecture at City Scale from Range Data,” 2010 IEEE Conference on Computer Vision and Pattern Recognition (CVPR), San Francisco, 13-18 June 2010, pp. 398-405.
- G. Wang, F. H. M. Bosch and M. Kuffer, “Modeling Urban Traffic Air Pollution Dispersion,” The International Archives of the Photogrammetry, Remote Sensing and Spatial Information Sciences, Vol. XXXVII, 2008, pp. 153-158.
- S. Wang and W. Li, “The Implementation of 3D Scene Walkthrough in Air Pollution Visualization,” International Journal of Information Engineering and Electronic Business, Vol. 2, No. 1, 2010, pp. 44-50. doi:10.5815/ijieeb.2010.01.07
- C. Metral, G. Falquet and K. Karatzas, “Ontologies for the Integration of Air Quality Models and 3D City Models,” In: J. Teller, C. Tweed and G. Rabino, Eds., Conceptual Models for Practitioners, Società Editrice Esculapio, Bologna, 2008.
- T. H. K. Gerhard Gröger, Angela Czerwinski, Claus Nagel, “Candidate OpenGIS® CityGML Implementation Specification (City Geography Markup Language) Copyright© 2006 Open Geospatial Consortium, Inc. All Rights Reserved,” Open Geospatial Consortium Inc., 2006.
- G. Gröger, T. H. Kolbe, A. Czerwinski and C. Nagel, “OpenGIS® City Geography Markup Language (CityGML) Encoding Standard,” Open Geo-Spatial Consortium Inc., 2008.
- L. Fu, J. Hao, D. He, K. He and P. Li, “Assessment of Vehicular Pollution in China,” Journal of the Air & Waste Management Association, Vol. 51, No. 5, 2001, pp. 658-668.
- O. Duclaux, E. Frejafon, H. Schmidt, A. Thomasson, D. Mondelain, J. Yu, et al., “3D-Air Quality Model Evaluation Using the Lidar Technique,” Atmospheric Environment, Vol. 36, No. 32, 2002, pp. 5081-5095.
- A. I. Sukhinov, V. K. Gadelshin and D. S. Lyubomischenko, “3D Model of Pollution Distribution in City Air and Its Parallel Realization,” LNCSE, Antalya, 2009, pp. 201-207.
NOTES
*Corresponding author.