Journal of Biomedical Science and Engineering
Vol. 5 No. 6 (2012) , Article ID: 19717 , 7 pages DOI:10.4236/jbise.2012.56042
A computer aided detection framework for mammographic images using fisher linear discriminant and nearest neighbor classifier
![]()
1Eaton Corporation, Cleveland, USA
2Department of Computer Engineering, Al-Hussein Bin Talal University, Ma’an, Jordan
3Department of Electrical and Computer Engineering, Western Michigan University, Kalamazoo, USA
Email: memuna.sarfraz@gmail.com, *fadiabuamara@ahu.edu.jo, fadiabuamara@ahu.edu.jo
Received March 2nd, 2012; revised April 1st, 2012; accepted April 9th, 2012
Keywords: Principal Component Analysis; Fisher Linear Discriminant; Nearest Neighbor Classifier
ABSTRACT
Today, mammography is the best method for early detection of breast cancer. Radiologists failed to detect evident cancerous signs in approximately 20% of false negative mammograms. False negatives have been identified as the inability of the radiologist to detect the abnormalities due to several reasons such as poor image quality, image noise, or eye fatigue. This paper presents a framework for a computer aided detection system that integrates Principal Component Analysis (PCA), Fisher Linear Discriminant (FLD), and Nearest Neighbor Classifier (KNN) algorithms for the detection of abnormalities in mammograms. Using normal and abnormal mammograms from the MIAS database, the integrated algorithm achieved 93.06% classification accuracy. Also in this paper, we present an analysis of the integrated algorithm’s parameters and suggest selection criteria.
1. INTRODUCTION
Breast cancer is the most common form of cancer in women; however, its early detection has proven to save lives. In the USA, 39,840 women and 390 males died due to this disease in 2010. Currently, there are more than two and a half million women living in United States have been diagnosed and treated from breast cancer [1]. The National Cancer Institute also estimates that 12.7% of women born today will be diagnosed with breast cancer at some time in their lives [1].
Today, mammography is the best method for early detection of breast cancer. Lesion size, density of breast tissue, age of the patient, image quality, and the radiologist’s skills to interpret the mammogram are the factors that affect sensitivity of cancerous tissues identification. The best known possible remedy and successful treatment for breast cancer is the early detection as it has considerably reduced the mortality rates in the past years [2]. It is hence very important for women to monitor their risk factors and maintain their periodical screening.
Radiologists failed to detect evident cancerous signs in approximately 20% of false negative mammograms [3]. The subtle difference between the cancerous and noncancerous regions is the main cause of false diagnosis. The sensitivity of mammography has been reported to improve if two radiologists examine the mammogram [4]. However, this is a costly solution and therefore other alternatives to this problem have to be investigated. Computer Aided Detection (CAD) is one of those alternatives. The CAD is a system used to assist radiologists through reading, analyzing, and then labelling the mammograms as normal or abnormal. It was reported that the cancer detection rates of a single reader with a CAD system and of two readers are similar [5].
A number of researchers have investigated principal component analysis (PCA), Fisher linear discriminant (FLD), and nearest neighbor classifier (KNN) algorithms. For instance, in [6], Hough transform, PCA, and Euclidean distance were integrated to detect abnormalities in mammograms. In [7], PCA and FLD algorithms were cascaded as dimensionality reduction modules followed by a discriminant analysis classifier. In [8], PCA, linear discriminant analysis (LDA), and probabilistic classification have been integrated to classify healthy and diseased human blood serum. In [9], PCA, LDA, and PCA-LDA were investigated as dimensionality reduction techniques for speech recognition. Results indicated that the combined PCA-LDA outperformed the individual algorithms. In [10], the performance of PCA-KNN and PCA-LDA was investigated for the face recognition problem. It was concluded that PCA-KNN outperformed PCA-LDA.
In this work, we develop a CAD system that confidently provides the radiologist a second reader opinion about mammographic images. The proposed CAD system integrates PCA as a decorrelation-based module, FLD as a dimensionality reduction and feature extraction module, and KNN as a classification module. The integration of PCA and FLD allows the CAD algorithm to use more than one Eigen vector in the Fisher domain which should improve the classification accuracy. The rest of this paper is organized as follows: section 2 presents PCA, FLD, and KNN algorithms. The proposed integrated approach is presented in Section 3. Section 4 presents the experimental results followed by the conclusions in Section 5.
2. THEORY
2.1. Principal Component Analysis
PCA is a linear transformation and a decorrelation-based technique that maps a high dimensional space into a lower dimensional space. PCA is used as a preprocessing step to improve speed and accuracy of the classification stage while decreasing its complexity. PCA transforms the data set into a different coordinate system where the first coordinate in the transformed domain, called the principal component, has the maximum variance and the rest of the coordinates have lesser and lesser variance values.
2.2. Fisher Linear Discriminant
Linear discriminant analysis (LDA) is used to discriminate between data classes and most commonly used in the two-class problem [11]. On the other hand, Fisher linear discriminant (FLD) is the benchmark for linear discrimination between two classes in the multidimensional space [11]. FLD was reported with attractive computational complexity since it is only based on the first and second moments of the data distribution [11].
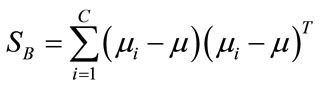
FLD uses a projection matrix W to reshape the data set’s scatter matrix in order to maximize the classes’ separability. W represents the optimally discriminating features and is defined as the ratio of between-class scatter to within-class scatter. The transformation matrix W is defined as [12]:
 (1)
(1)
where X is the data matrix and  is the between-class scatter matrix. For a two-class problem,
  is defined as
 (2)
(2)
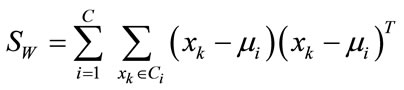
and  is the within-class scatter matrix defined as
 (3)
(3)
where C represents number of classes,  is the mean of samples in class i. Then, the matrix

is constructed according to Equation (1). Next, the matrix  is formed by retaining d eigenvectors which is defined as
 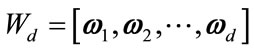 where d is less than D. The output matrix
 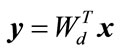 is the projection of vector
  into a subspace of d dimension.
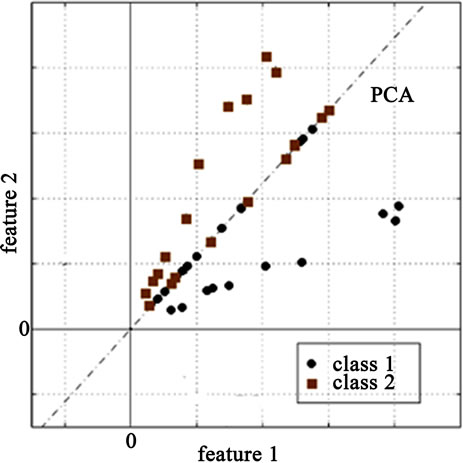
The PCA algorithm transforms the data into an Eigenspace that uncorrelates the data. However, in case of a two-class problem, the two classes are not completely linearly separable as shown in Figure 1(a) which complicates and degrades the classification phase. Therefore, FLD algorithm is applied after PCA resulting in a better between-class scatter as shown in Figure 1(b). Consequently, the classification results should be greatly improved.
 (a)
(a) (b)
(b)
Figure 1. (a) The resultant data after PCA for the two-class problem; (b) The resultant data after PCA-FLD.
2.3. Nearest Neighbor Classifier
The Nearest Neighbor is a simple yet a robust classifier where an object is assigned to the class to which the majority of the nearest neighbors belong. It is important to consider only those neighbors for which a correct classification is already known (i.e., training set). All the objects are considered to be present in the multidimensional feature space and are represented by position vectors where these vectors are obtained through calculating the distance between the object and its neighbors. The multidimensional space is divided into regions utilizing the locations and labels of the training data. An object in this space will be labeled with the class that has the majority of votes among the k-nearest neighbors. The algorithm of the nearest neighbor classifier can be summarized as follows:
- In the training phase, the feature vectors and their class labels are found as 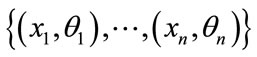 where each
  is a label that belongs to one of the classes
 .
.
- In the testing phase, the distance of a testing vector to the training vectors is computed and the closest training sample is chosen. Then, the testing sample is labeled according to the label of the nearest neighbor.
3. PROPOSED CAD ALGORITHM
In this section, the framework of the breast cancer computer aided detection system is developed. PCA algorithm is used as a decorrelation-based module followed by FLD as a dimensionality reduction and a feature extraction module. Finally, a KNN classifier is used to classify the testing sub-images into normal or abnormal.
Mammographic images from the MIAS database were used, which has a total 203 normal mammograms and 119 suspicious ones. A total of 144 images were cropped and scaled to 50 × 50 pixels from the database forming 72 normal and 72 suspicious sub-images. A total of 3 training sets are created. Each training set consisted of 48 sub-images: 24 suspicious and 24 normal sub-images.
The proposed CAD system consists of a training phase, testing phase, and classification phase. The following steps summarize the training phase:
- Each sub-image in the training set is converted into a column vector gk where  Then, a training matrix Gjk is formed by placing the sub-images as columns where j = 2500 and
- Row-wise mean of the matrix Gjk is computed which results in a column vector A.
- A matrix Bjk is formed by repeating the column vector A number of times equal to number of the sub-images (i.e., 48).
- The deviation of each sub-image from the row-wise mean of the sub-images is calculated per Djk = Gjk – Bjk..
- The covariance matrix of Djk is computed using Eq.4:
 (4)
(4)
where m is the number of rows in A (i.e., 48).
- The eigenvalues λ and eigenvectors V of the matrix Cmm are computed using the PCA algorithm according to eq.5. This result in m eigenvectors and m eigenvalues sorted in a descending order.
 (5)
(5)
- The centered sub-images matrix Djk is projected onto the Eigenspace per eq.6.
 (6)
(6)
- Two types of scatter matrices are used in this step. The first one is the within-class scatter matrix  representing the scatter of a single class and the second one is the between-class scatter matrix
  representing the scatter of different classes:

where C represents number of classes,  is the mean of samples in class i where i = {1, 2}, and
  is the mean of all samples in the training matrix. Both
  and
and  are of dimension 48 × 48.
- A linear transformation matrix W is computed as:

where  is the Fisher criterion that maximizes the between-class scatter while minimizes the withinclass scatter and
 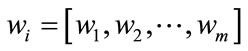 is the set of m Eigenvectors and m eigenvalues of
  and
and . The transformation W is another projection into the Eigenspace
  such that
 (7)
(7)
A number of eigenvalues is retained (Nev) along with their corresponding Eigenvectors (Vfe) where the dimension of Vfe is M × Nev.
- The matrix Ymm is projected onto the Fisher linear space Zpq using the Eigenvectors Vfe as shown in Eq.8.
 (8)
(8)
where the dimension of Zpq is Nev × 48.
On the other hand, the testing phase can be summarized in the following steps:
- A total of three testing sets are used where each test set consists of 48 sub-images: 24 normal and 24 abnormal sub-images.
- Let the testing set be represented as .
.
- For each testing sub-image , the difference between the sub-image and the mean of the training set A is computed using Eq.9.
 (9)
(9)
- The difference γjk is projected onto the Eigenspace Ymm and the Eigenvectors space Vfe as shown in Eq.10.
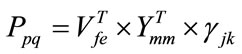 (10)
(10)
For the classification phase, two classes are assumed: one class for the abnormal sub-images and the other one for normal sub-images. First, the Euclidean distance between the testing matrix Ppq and each column of the Fisher linear space Zpq is computed. This distance provides an accurate measure for the classification phase. Then, the nearest neighbor to the test sample is selected based on the calculated distances in the previous step. Then, the testing sub-image is assigned to the class of the nearest neighbor.
4. RESULTS AND DISCUSSION
The literature reported that number of retained Fisher values for the classification stage should be limited to be one less than number of classes [4]. However, for the two-class problem the retained Fisher values should be increased to improve the classification stage [9]. Therefore, in this work, 11 Fisher values are retained which have been determined as a result of experimental evaluation as discussed below.
Table 1 shows the results of the proposed CAD algorithm. Algorithm accuracy is defined as the ratio between number of correctly classified testing sub-images and total number of testing sub-images. A total of 72 subimages were used for the testing phase. As Table 1 indicates, the proposed CAD algorithm has classification accuracy over 91.67% in all the three test sets with average classification accuracy of 93.06%. Table 1 also indicates average false negative (FN) rate, an abnormal mammogram classified as normal mammogram, and false positive (FP) rate, a normal mammogram classified as abnormal mammogram, of 6.94% and 0%.
PCA is employed globally to uncorrelate the training data where all the principal components are retained. However, PCA uncorrelates the first few principal components in the transformed data while the rest of the components are still highly correlated. On the other hand, FLD is used as a dimensionality reduction and feature

Table 1. Classification accuracy, FP, and FN rates of the three test sets. Each set consists of 24 normal and 24 abnormal subimages.
extraction module. FLD is applied, which uses the basis provided by the PCA, to generate a new set of basis for the classification stage. FLD uncorrelates the data again by taking into account the different classes present in the data. This dual transformation into the Eigenspace uncorrelates the data two times which should greatly improve the classification results.
In testing set no. 1, three abnormal images were not correctly classified: one has architectural distortion while the others have spiculated masses. In testing set no. 2, four abnormal images were not correctly classified: three have microcalcifications while the other one has spiculated masses. In testing set no. 3, three abnormal images were not correctly classified: two have Architectural Distortions while the other one has spiculated masses. Microcalcifications are very hard to detect as they are very small and are non-palpable. Spiculated masses have irregular shapes with sharp edges and thus pose a big challenge for detection. Architectural distortions are one of the most commonly missed signs of breast cancer. Two third of cancer is related to architectural distortions that have positive margins.
The proposed CAD system uses several parameters that impact the performance and accuracy of results such as the number of selected principal components (PC), number of retained Fisher values, and number of nearest neighbors.
Figure 2 shows the impact of retaining different number of principal components on the classification accuracy for testing sets 1 to 3. These results indicate that selecting all the principal components achieves the highest accuracy. Thus, PCA is used in this work to decorrelate the data without reducing its dimensionality. Even though most of the information is contained in the first few principal components, discarding the least significant principal components may result in loss of information depending on the application.
Figure 3 shows the impact of retaining different number of Fisher values on the classification accuracy for testing sets 1 to 3. These results indicate that selecting 11 or 12 Fisher values achieves the highest accuracy.
In this work the nearest neighbor, which has already been classified from the training data, is used in making the decision to which class the testing sub-image belong. This value is chosen as it provides the best results as shown in literature for the two-class problem [4].
 (a)
(a) (b)
(b) (c)
(c)
Figure 2. (a)-(c) Number of selected principal components impact on classification accuracy for Testing Sets no. 1, 2, 3 while the other parameters are kept fixed.
 (a)
(a) (b)
(b) (c)
(c)
Figure 3. (a)-(c) Number of selected fisher values impact on classification accuracy for Testing Sets no. 1, 2, 3 while the other parameters are kept fixed.

Table 2. (top) Comparison between PCA and PCA-FLD algorithms for testing sets 1-3. (Bottom) Comparison between FLD and PCA-FLD algorithms for testing sets 1-3.
Table 2 shows results of the proposed CAD algorithm against PCA and FLD algorithms for the various testing data. The average accuracies of PCA, FLD, and PCAFLD are 78.47%, 47.92%, and 93.06% where all the principal components and eleven Fisher values are retained. These results indicate that the proposed PCAFLD algorithm outperforms PCA and FLD algorithms for all the testing sets. The improvements of PCA-FLD algorithm over PCA and FLD algorithms are 18.59% and 94.2% which indicates that performance of the FLD algorithm can be greatly improved if data is preprocessed by PCA.
5. CONCLUSIONS
Our framework for the proposed CAD system is based on integrating PCA, FLD, and KNN classifier. PCA is used to uncorrelate the data whereas FLD is used for dimensionality reduction and feature extraction. The integration of PCA and FLD results in a dual transformation in the Eigenspace that improved the classification accuracy.
The performance of the proposed CAD system is compared against the individual performance of PCA and FLD. Extensive simulations using 144 sub-images were performed. The results indicate that integrating PCA and FLD algorithms improves PCA algorithm accuracy of 18.59% and FLD algorithm accuracy of 94.2% in all testing sets.
The ability of the proposed framework to correctly classify mammograms depends upon various factors including the proper cropping of images, number of retained principal components, number of retained Fisher values, and number of nearest neighbors taken into consideration. The framework implementation resulted in the highest accuracy when all the principal components and eleven Fisher values were retained, and one neighbor is considered. Results also indicate that PCA reduces the computational complexity of the between-class and within-class scatter matrices.
Future work may consider other biological features that can be integrated within the framework to help automate the parameters selection process. The proposed algorithm can be further enhanced by modelling the problem as a multiclass problem through including three classes: normal, malignant, and benign. Malignant regions have well defined boundaries whereas benign regions do not have such a characteristic. This fact can be utilized to improve the classification phase. This study can be taken to a further step by testing the algorithm on other mammographic databases. The integration of PCA and FLD improves the classification accuracy but increased the computational complexity of the CAD algorithm.
6. ACKNOWLEDGEMENTS
Partial support of this work was provided by Western Michigan University FRACASF award (WMU: 2007-2009). The authors would like also to acknowledge Western Michigan University for its support and contributions to the Information Technology and Image Analysis (ITIA) Center.
![]()
![]()
REFERENCES
- National Cancer Institute (2011) The National Cancer Institute website. http://www.cancer.gov/cancertopics/types/breast
- Senn, H.J. and Schrijvers, D. (2010) A lifestyle choice: is cancer prevention the ultimate goal. Public Service Review, 20, 184-186.
- Sonka, M. and Fitzpatrick, J.M. (2000) Handbook of medical imaging. Academic Press, Waltham. doi:/10.1117/3.831079
- Ikeda, D. (2010) Breast imaging. 2nd edition, Elsevier Mosby, Maryland Heights.
- Fiona, J.G., Susan, M.A., Maureen, G.C.G., Olonnsola, F.A., Matthew, G.W., Jonathan, J., Caroline, R.M.B. and Stephen, W.D. (2008) Single reading with computeraided detection for screening mammography. The New England Journal of Medicine, 359, 1675-1684. doi:/10.1056/NEJMoa0803545
- Abdel-Qader, I., Shen, L., Jacobs, C., Abu-Amara, F. and Pashaie-Rad, S. (2006) Unsupervised detection of suspicious tissue using data modeling and PCA. International Journal of Biomedical Imaging, 2006, article ID: 57850.
- Solka, J.L, Poston, W.L, Priebe, C.E, Rogers, G.W, Lorey, R.A, Marchette, D.J. and Woods, K. (1994) The detection of micro-calcifications in mammographic images using high dimensional features. IEEE Seventh Symposium on Computer-Based Medical Systems, Winston-Salem, 10-12 June 1994, 139-145.
- Ryan, H., Lilien, H. and Bruce, R. (2003) Probabilistic disease classification of expression-dependent proteomic data from mass spectrometry of human serum. Journal of Computational Biology, 10, 925-946. doi:/10.1089/106652703322756159
- Sanja, F. and Leonardis, A. (2003) Robust LDA classification by subsampling. Computer Vision and Pattern Recognition Workshop, Madison, 16-22 June 2003, 97.
- Beveridge, J. She, K., Bruce, A. and Geof, H. (2001) A Nonparametric statistical comparison of principal component and linear discriminant subspaces for face recognition. IEEE Computer Society Conference on Computer Vision and Pattern Recognition, Colorado Springs, 8-14 December 2001, 535-542.
- Giger, M.L., Krassemeijer, N. and Armato, S.G. (2001) Guest editorial computer-aided diagnosis in medical imaging. IEEE Transactions on Medical Imaging, 20, 1205- 1208. doi:/10.1109/TMI.2001.974915
- Thomas, P., Michael, C. and Lewis, S. (2001) Comparison of the performance of different discriminant algorithms in analyze discrimination tasks using an array of carbon black-polymer composite vapor detectors. Analytical Chemistry, 73, 321-331. doi:/10.1021/ac000792f
NOTES
*Corresponding author.