American Journal of Plant Sciences
Vol.3 No.3(2012), Article ID:17914,8 pages DOI:10.4236/ajps.2012.33040
Differential Early Fluctuations in Superoxide Dismutase and Catalase Activities Are Included in the Responses of Young Maize Organs to S-Deprivation
![]()
Plant Physiology Laboratory, Department of Plant Biology, Faculty of Agricultural Biotechnology, Agricultural University of Athens, Athens, Greece.
Email: s.chorianopoulou@aua.gr
Received December 27th, 2011; revised January 20th, 2012; accepted February 1st, 2012
Keywords: S-deprivation; hydroponics; Zea mays; water-soluble-protein fraction; superoxide dismutase activity; catalase activity
ABSTRACT
Hydroponically raised thirteen-day-old maize plants were subject to S-deprivation for ten days and the fluctuation of water soluble protein fraction (WSPF) content along with the SOD and the CAT activities were comparatively monitored in leaf blades, sheaths and roots. S-deprivation progressively diminished WSPF first in the sheaths, two days later in the blades, and four days later in the root. SOD activity per mg WSPF decreased at d2, whilst it increased for the next four days. After d6, SOD activities of roots and sheaths decreased, followed by the blades at d10. CAT activity per mg WSPF at d2 decreased only in blades, whilst increased in both sheaths and roots (more in sheaths). After d6 decreased CAT activity was found only in roots. No other decreases were observed in blades and sheaths. SOD and CAT specific activities on DM basis presented an oscillation pattern with the increase of DM. S-deprivation altered this picture, by reversing the oscillation pattern and by decreasing the trendlines. SOD specific activity initially decreased in -S sheaths and roots, whilst it remained unchanged in -S blades. Then it increased abruptly, decreased in an exponential manner and stabilised in all three organs. S-deprivation caused an early fluctuation of the CAT activity and then diverse responses; in blades a late increase in CAT activity was observed and decreases in the other two organs. S-deprivation seemed to reverse the oscillation pattern of CAT specific activity differentially for each organ type.
1. Introduction
Various abiotic stresses lead to the overproduction of reactive oxygen species (ROS) in plants, in which the superoxide anion ( ) and the hydrogen peroxide (H2O2) are included. Therefore, plants possess very efficient antioxidant defense systems which scavenge ROS and prevent damages caused by ROS [1]. Superoxide dismutase (SOD) and catalase (CAT) comprise two enzymatic components of the antioxidant equipment of the various plant tissues. SOD (EC 1.15.1.1) removes
  by catalysing its dismutation and producing H2O2 and O2, whilst CAT (EC 1.11.1.6) catalyses dismutation of H2O2 into H2O and O2 and is indispensable for ROS detoxification during stress causing conditions. The balance between SODs and the different H2O2-scavenging enzyme activities in cells is considered to be crusial in determining the steady-state level of
  and H2O2. This balance, together with the sequestering of metal ions by ferritin and other metal-binding proteins, prevents the formation of the highly toxic hydroxyl radical (HO×) via the metaldependent Haber-Weiss reaction or the Fenton reaction. In recent years, new roles for ROS have been identified as controllers and regulators of various biological processes, among them growth, cell cycle, development and abiotic stress responses [2].
Sulfur (S) deficiency of crops has been reported with increasing frequency over the past two decades on a worldwide scale. The main reasons are the reduction of sulfur dioxide emission from power plants and various industrial sources, the increasing use of high-analysis low-S-containing fertilizers, the decreasing use of S-containing fertilizers, the decreasing use of S-containing fungicides and pesticides and high-yielding varieties [3]. Maize (Zea mays, Poaceae) is one of the world’s leading cereal crops along with rice and wheat [4] and a synopsis of the responses to S limitation in maize has been provided [5].
In this study thirteen-day-old maize plants were subject to S-deprivation for ten days; the fluctuations of SOD and CAT activities were comparatively monitored in leaf blades, sheaths and roots and analyzed in terms of the corresponding fluctuations of water soluble protein fraction and the dry mass accumulation in each organ, which were affected by the deprivation.
2. Materials and Methods
2.1. Plant Material and Hydroponics Set Up
Maize hybrid LG-2447 was seeded in pots containing a commercial peatbased growing medium and placed in a growth chamber at 22˚C, 65% relative humidity, 16 h light/8 h dark, and 250 mmol photon m−2·s−1. After eight days, the plants were removed from the pots and the roots were washed with water to remove soil particles. The plants were transferred to hydroponic batch culture system under the same environmental conditions. The hydroponic system consisted of 10 L tanks (24 plants per tank) filled with a continuously aerated nutrient solution containing 7 mM KNO3, 5 mM Ca(NO3)2, 1.71 mM Mg(NO3)2, 1 mM MgSO4, 1 mM KH2PO4, 0.9 mM MgCl2, 0.5 mM CaCl2, 0.1 mM NaCl, 0.06 mM FeNaEDTA, 2.458 mM H3BO3, 0.984 mM Mn(NO3)2, 0.095 mM Zn acetate, 0.082 mM (NH4)6Mo7O24, and 0.05 mM Cu(NO3)2, under the same environmental conditions. MgSO4 was replaced with MgCl2 to impose sulfate deprivation. Nutrient solutions contained 0.1 mM  for the first day, 0.5 mM
  for the next two days, and 1 mM
  for another two days. Then half of those plants continued to grow in the nutrient solution containing 1 mM
  (control C), while the rest of them grew in nutrient solution without
  (-S) for 10 days. Nutrient solutions were changed every day each (Figure 1).
2.2. Water Soluble Protein Fraction
Water soluble protein fraction (WSPF) in preparations of enzymes was quantitated by the Bradford method, a protein-dye binding assay based on the color change occuring in Coomassie Brilliant Blue G-250 when it binds to protein, using bovine serum albumin as the standard [6].
2.3. Enzyme Extraction and SOD and CAT Activity Determinations
Plant tissue, 1 g, was homogenized in 8 mL 50 mM phosphate buffer (pH 7.0), containing insoluble polyvinylpyrrolidone. The homogenate was centrifuged at 10000 g for 15 min and the supernatant obtained was used as enzyme extract. An aliquot of the extract was used to determine its protein content. All steps in the preparation of the enzyme extract were carried out at 0˚C - 4˚C.
The activity of SOD (EC 1.15.11) was assayed by measuring its ability to inhibit the photochemical reduction of nitro blue tetrazolium (NBT), using the method of Dhindsa et al. (1981) [7] with modifications. The 3 ml reaction mixture contained 50 mM phosphate buffer, pH 7.8, 13 mM methionine, 75 μΜ NBT, 2 μΜ riboflavin, 0.1 mM EDTA, and 0 - 300 μl enzyme extract. Riboflavin was added last and the tubes were shaken and placed 30 cm below a fluorescent-light bank (200 μmol·m−2·s−1). The reaction was started by switching on the light and was allowed to run for 15 min. The reaction was stopped by switching off the light and the tubes were covered with a black cloth. The absorbance by the reaction mixture at 560 nm was read. A non-irradiated reaction mixture did not develop colour and served as control. The reaction mixture lacking enzyme developed the maximum colour and this decreased with increasing volume of enzyme extract. The volume of enzyme extract corresponding to 50% inhibition of the reaction was considered as one enzyme unit. To express the enzymatic activity of SOD in nkat (nmol substrate·s−1), we considered that reaction is completed within 15 min considering that 1 mol of NBT reacts with 4 mol , 0.225 μmol ΝΒΤ react with 0.9 μmol
  within 15 min or 1 nmol·
 ·s−1 and thus 1 U = 0.5 nkat
 .
.
Catalase (EC 1.15.1.6) was assayed polarographi cally by means of an Oxi320-WTW oxygen electrode using the method of Del Rio et al. (1977) [8] with some modifications. 10 mL of buffered solution pH 7.0 and 0 - 1000 μL sample were placed in a beaker. The electrode was placed into the buffer and after 1 min the initial oxygen
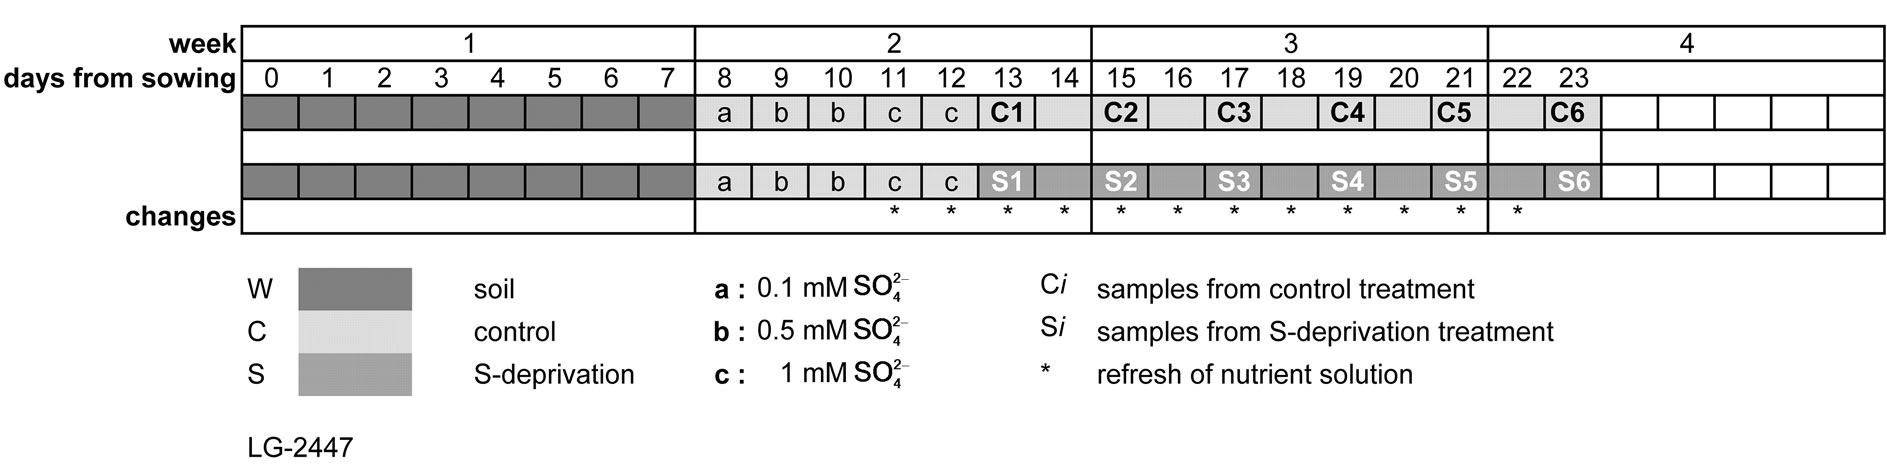
Figure 1. Schematic diagram of the treatments.
concentration was recorded. 20 μL of H2O2 30% solution were added and after 1 min the final oxygen concentration was recorded. The difference in oxygen concentration corresponds to oxygen produced due to the action of catalase. 1 U is the amount of enzyme that produces 1 μmol·O2·min−1. 1U = 33.33 nkat H2O2.
2.4. Statistical Analysis
Three separate hydroponic experiments were conducted and three replicates per sample were separately analyzed. The significance of differences between means of C and -S data sets was evaluated using a two-tailed t-test at p = 0.05, and when significant the percent of the relative change was calculated. A curve based on the calculation of the moving average of 2nd order was applied to the time-course of C and -S data to visualize the fluctuations during the treatment in each case (i.e., for each day the average between this day and the previous one was calculated; then, the averages were connected by a line). Regression analysis was performed using R (R Development Core Team, 2011) [9], according to Crawley (2007) [10].
3. Results
3.1. The Effect of S-Deprivation on Water Soluble Protein Content
Water soluble protein fraction (WSPF) increased with a similar pattern in all organs of plants grown in full nutrient solution (Figures 2(a)-(c)). S-deprivation progressively diminished WSPF. The effect of S-deprivation was the same in both blades and sheaths (Figures 2(d), and (e)). In sheaths, the initiation of the decrease was observed at d2 (−16.7%) and in blades at d4 (−20.0%, Table 1). In roots, the effect of S-deprivation differed. An increase in WSPF appeared as an early effect (22.3% at d2) followed by decrease from d6 onwards (Table 1, Figure 2(f)). WSPF concentration on dry mass (DM) basis fluctuated with the increase of DM. In control plants the trendline presented a tendency to decrease in blades (Figure 2(g)) and a tendency to increase in sheaths (Figure 2(h)) and roots (Figure 2(i)).
S-deprivation altered the tendency of the trendlines and/or the fluctuation pattern. In all three organs the trendlines decreased and in a stipper way (Figures 2(j)- (l)). The fluctuation pattern in blades resembled oscilla-
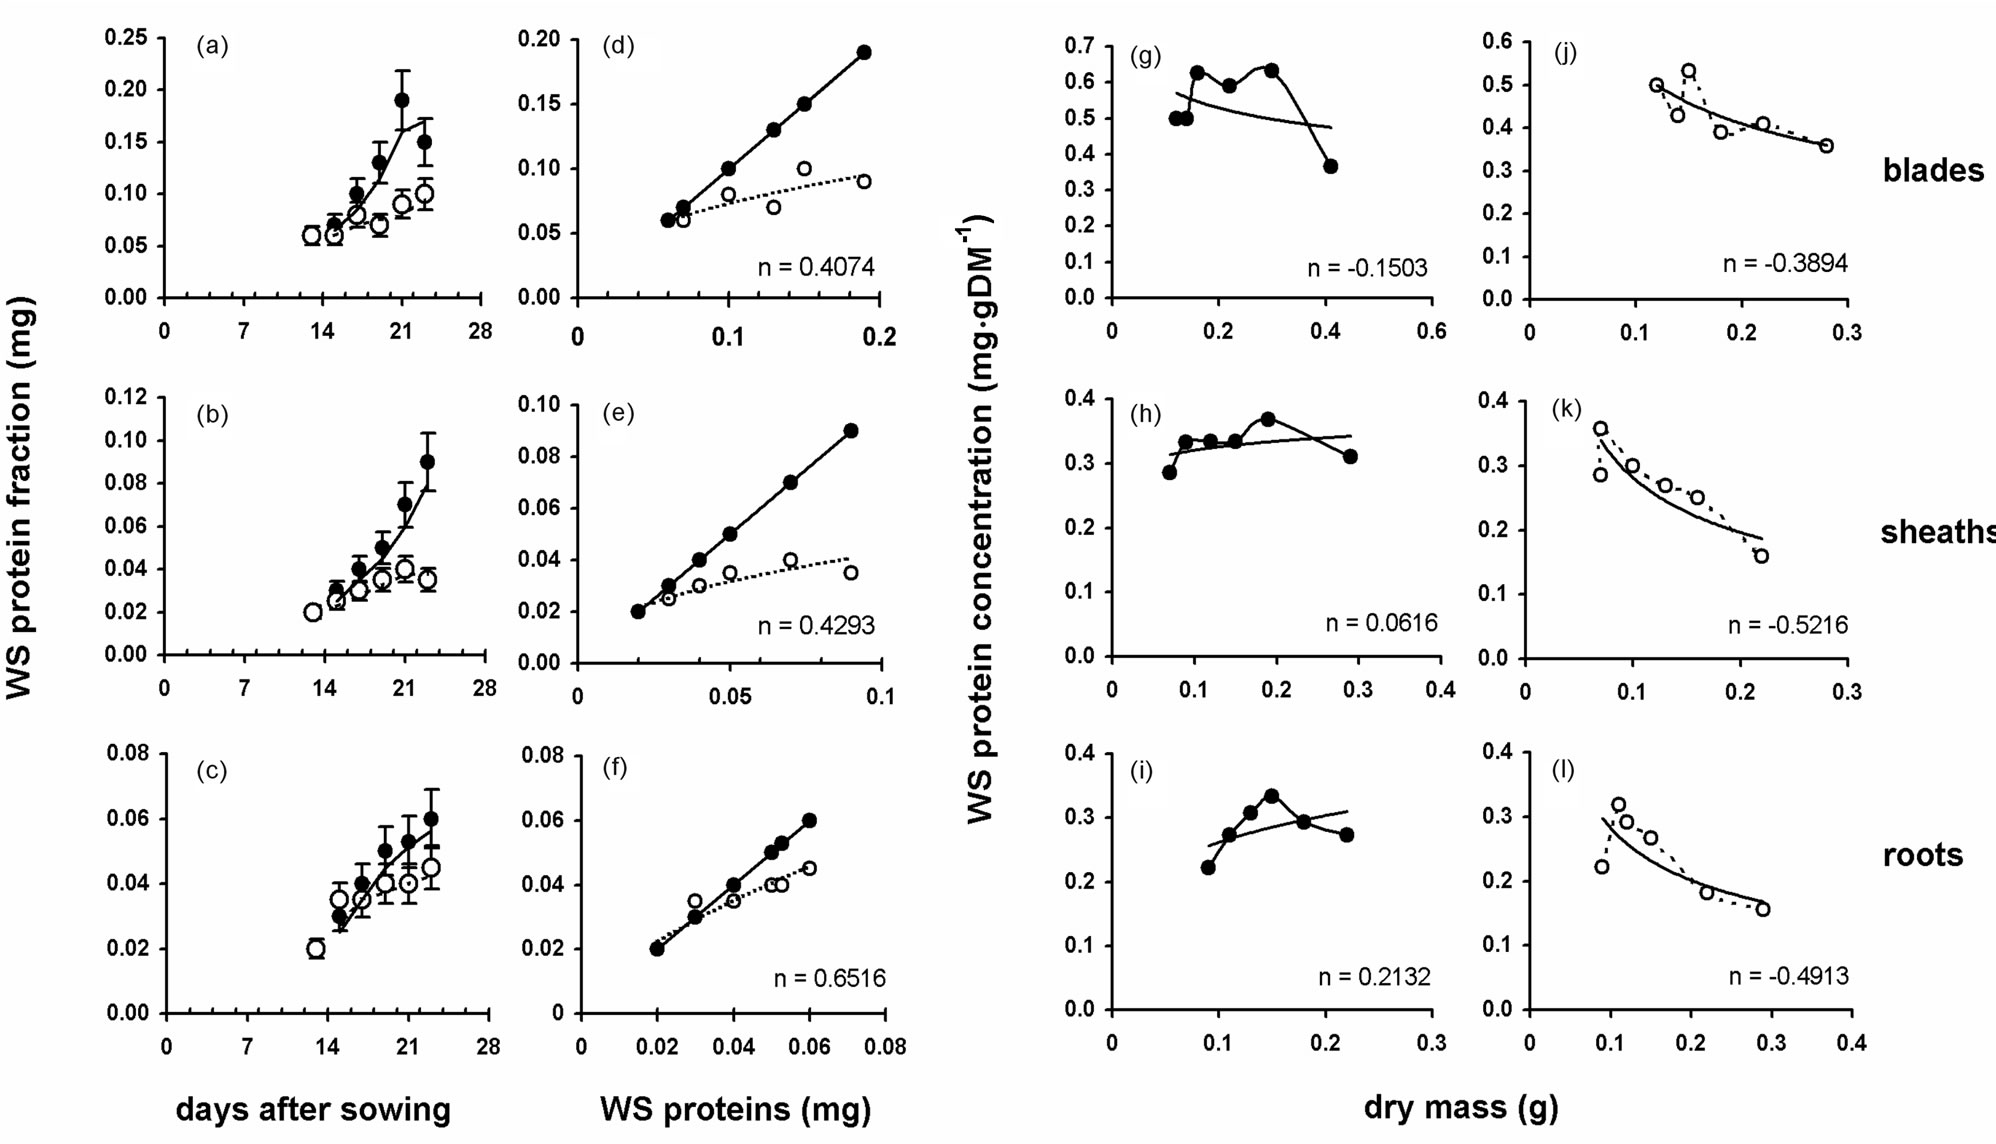
Figure 2. The effect of the S-deprivation on water soluble protein (WSP) content; closed circles: plants in full nutrient solution, open circles: plants under S-deprivation. (a)-(c) Temporal changes in WSP content of blades, sheaths and roots respectively; (d)-(f) Correlation of the WSP content of -S organs against the control ones (straight line represents autocorrelation of control values); (g)-(i) WSP concentrations of the control organs relative to dry mass increase; (j)-(l) The corresponding WSP concentrations of the -S organs relative to dry mass increase. The trendlines are of power type and the value of the exponent (n) is provided.
tion (Figure 2(j)), whilst in root the fluctuation pattern reversed (Figure 2(l)).
3.2. The Effect of S-Deprivation on Superoxide Dismutase Activities
In plants grown in full nutrient solution SOD activity per mg WSPF presented a similar pattern in all organs: a minimum appeared at d4, then the activity increased with a rather comparable manner (Figures 3(a)-(c)). S-deprivation caused a decrease in SOD activity per mg WSPF at d2 followed by a significant increase the next two days in all organs. After d6 decreases were observed, the larger being in the roots and the smaller in the blades (Table 1). Negative correlations between the control and the SOD activity per mg WSPF of the -S organs were found (Figures 3(d)-(f)), visualized by applying a trendline of power type. The -S impact was weaker in the blades (the exponent of the function for the blades n = −0.1899, was the lowest among the other ones) and stronger in the root (n = −0.6161). Taking under consideration that the extracted SOD protein is part of WSPF, correlation with it showed that SOD activity per WSPF increased with WSPF in blades and sheaths, whilst slightly decreased in the roots. S-deprivation clearly affected this picture: SOD activity per WSPF presented increased trendline in -S blades (Figure 3(g)) and a decreased one in -S roots (Figure 3(i)), whilst it remained rather unchanged in -S sheaths (Figure 3(h)). Especially in the roots the fluctuation of SOD activity per WSPF relative to the increasing WSPF (Figure 3(i)) was much greater compared to that of sheaths and blades.
SOD specific activity per DM presented an oscillation pattern with the increase of DM. In plants under full nutrient solution the trendline of this pattern increased in all three organs (Figures 3(j)-(l)). SOD specific activity initially increased (in blades, Figure 3(j)) or remained more or less the same (sheaths and roots Figures 3(k) and (l)). Then a characteristic decrease was observed in all three organs that reached the same minimum value of 4 nkat·gDM−1. S-deprivation altered this picture, by reversing the oscillation pattern and by decreasing the trendlines (Figures 3(m) and (o)). SOD specific activity initially decreased in -S sheaths (Figures 3(n)) and -S roots (Figure 3(o)) or remained unchanged in -S blades (Figure 3(m)). Then it increased abruptly reaching a maximum of 11 - 13 nkat·gDM−1 and subsequently it decreased in an exponential manner and stabilised in all three organs.
3.3. The Effect of S-Deprivation on Catalase Activities
In full nutrient solution CAT activity per mg WSPF increased in blades (Figure 4(a)), remained rather stable in sheaths (Figure 4(b)), whilst in roots remained rather

Table 1. Within the time course of each treatment, the -S values were compared pairwise with the control ones through t-test and the statistically significant deviations are given as percentage changes relative to control. A dash indicates no statistically significant differences.

Figure 3. The effect of the S-deprivation on superoxide dismutase (SOD) activity; closed circles: plants in full nutrient solution, open circles: plants under S-deprivation. (a)-(c) Temporal changes in SOD activity per WSPF of blades, sheaths and roots respectively; (d)-(f) Correlation of the SOD activity of -S organs (y-axis) against the control ones (x-axis); (g)-(i) SOD activity per WSPF of the control organs relative to the increase of WSPF; (j)-(l): The specific SOD activity per dry mass of the control organs relative to the increase of dry mass; (m)-(o) The corresponding specific SOD activity per dry mass of the -S organs relative to the increase of dry mass. The trendlines are of power type and the value of the exponent (n) is provided.
stable for a week and then increased significantly (Figure 4(c)). S-deprivation caused an early fluctuation of the activity and then diverse responses. It is remarkable that at d2 CAT activity per mg WSPF decreased in blades, whilst in increased in sheaths and roots (Table 1). Correlation of the results of CAT activity per mg WSPF between the treatments found to be positive for blades and roots (Figures 4(d) and 4(f)) and negative in sheaths (Figure 4(e)). In control plants CAT activity per mg WSPF increased in blades (Figure 4(g)) and roots (Figure 4(i)) and slightly decreased in sheaths (Figure 4(h)) with the increase of WSPF. S-deprivation altered this picture in a differential manner. In blades (Figure 4(g)), CAT activity per mg WSPF increased with the increase of WSPF in a stipper manner, whilst in sheaths this increase was rather weak (Figure 4(h)). In roots no alteration in the correlation pattern was observed (Figure 4(i)).
Specific CAT activity on DM basis presented oscillations as DM increased. Trendlines were increased more or less in all three organs (Figures 4(j)-(l)). S-deprivation seemed to reverse the oscillation pattern differentially for each organ type. In blades (Figure 4(m)) specific CAT activity decreased and then increased with dry mass increase and the trendline remained increasing. In sheaths (Figure 4(n)) specific CAT activity increased sharply and in roots (Figure 4(o)) rather weakly. In both sheaths and roots the trendlines decreased (Figures 4(n) and (o)).
4. Discussion
The initial 30 day period of maize plant is crucial for its establishment and growth. For the studied period (13th - 23rd day after sowing), we showed that S deficiency led to reduction in soluble protein content and to differential fluctuations in the SOD and CAT activities in an organ specific manner. Plant responses to sulfur limitation are complex and can be divided into phases depending on the degree of S shortage. The initial responses are limited to adaptations within S metabolic pathway, whilst multiple metabolic pathways and developmental processes are affected when S-shortage becomes more severe [11]. From Table 1 it emerges that d6 seems to divide the responses into two phases. According to the literature, between the application of the S-deprivation treatment and the following morphological adaptations, the monitored early events include genes encoding the corresponding high-affinity transporters [12] and the production of ROS [13] among others. It is known that ROS act as signal molecules in all types of stresses [14] and there is abundant evidence that ROS play roles in cell growth, development, cell death, and stress responses. Spatiotemporal regulation of ROS production is an important factor for the control of the plant form. These ROS are produced by NADPH oxidases that generate  using NADPH as an electron donor [15]. Especially H2O2 is generated by various environmental and developmental stimuli. There-

Figure 4. The effect of the S-deprivation on catalase (CAT) activity; closed circles: plants in full nutrient solution, open circles: plants under S-deprivation. (a)-(c) Temporal changes in CAT activity per WSPF of blades, sheaths and roots respectively; (d)-(f) Correlation of the CAT activity of -S organs (y-axis) against the control ones (x-axis); (g)-(i) CAT activity per WSPF of the control organs relative to the increase of WSPF; (j)-(l) The specific CAT activity per dry mass of the control organs relative to the increase of dry mass; (m)-(o) The corresponding specific CAT activity per dry mass of the -S organs relative to the increase of dry mass. The trendlines are of power type and the value of the exponent (n) is provided.
fore, its cellular levels are under tight control, and their maintenance has hallmarks of homeostatic regulation [16]. Over the last 20 years a large body of evidence has demonstrated unequivocally that H2O2 is a key signalling molecule in plants [17]. In metabolically active tissues, GSH acts as a key redox buffer forming a barrier between protein Cys groups and ROS. Also GSH is a substrate for several reductive enzymes, including enzymes that reduce peroxides [17]. Plant metabolism is highly regulated and this regulation includes activation of molecular oxygen to produce ROS, particularly H2O2. The production of ROS is genetically programmed, induced during the course of development and by environmental fluctuations, and has complex downstream effects on metabolism [17]. In maize, ROS are needed for leaf expansion in the elongation zone [18].
Under abiotic stress conditions, proteins are directly involved in plant stress response [19]. Change in redox environment of cells is reported to alter cellular metabolism and gene expression; Tewari et al. (2004) [20] have subjected hydroponically raised 14-day-old maize plants to various deprivations and assessed the differences in antioxidative responses in maize induced by the deficiencies of macronutrients S, N, P, K, Ca, and Mg. Fifteen days after commencement of each treatment, the activities of antioxidative enzymes of the third leaf expressed per mg protein were generally enhanced by the deficiencies of different macronutrients. The effect of S deficiency on CAT activity was insignificant. The SOD activity was significantly enhanced under deficient S supply [20].
At the cellular level, it has been reported that S-deprivation affected the spatial and temporal distribution of ROS in maize leaves [21]. Hydroponically raised 13-dayold plants were subjected to S-deprivation for 12 days. Superoxide anions and H2O2 in the second leaf of control plants were located mainly in the mesophyll, whilst in the second leaf of -S plants they were located in the parenchymatic sheath of the vascular bundles (VB). Addition of the superoxide dismutase inhibitor, N,N-diethyldithio-carbamate (DDC), resulted in an increased level of  in -S blades. The presence of superoxide anions was particularly evident in the cell walls between the VB of leaf 2 of -S plants. In contrast, there was a higher concentration of H2O2 in control blades at day 12. Leaf 4 of the -S plants, had less
  than control plants, and there was no detectable
  in the VB. Conversely, in control leaves intense presence of
  was observed inside and around the VB, in the area where the midvein VB develops [21].
S-deprivation changes mitochondrial function, cellular energy status and redox homeostasis [22] and there is mounting evidence for a pivotal role of redox-mediated signalling in root apical meristem organization and dynamics, thus connecting root development to its environment [23]. In the root system of maize plants of the same age and hydroponically treated in similar way, ROS activity has been followed in connection with aerenchyma formation under S-deprivation conditions, a nutritional programmed cell death (nPCD) [24,25]. ROS production contributs to this nPCD due to nutrient deprivation. It seems that perturbations in the energy and the redox status of specific cortex cell stimulate the activation process, which may include the enzyme NADPH oxidase [21]. The lower ATP concentration and the higher oxygen consumption observed at day 2 in S-deprived roots compared to the control indicated that nPCD may be triggered by perturbations in energy status of the root. ROS seem to contribute to nPCD initiation, with ROS possessing dual roles as signals and eliminators [26,27].
WSPF as well as dry mass accumulation are affected by the treatment. Therefore, we analyzed the fluctuations of SOD and CAT activities in relation to the increasing WSPF or DM. Both approaches (see Table 1) concurred to the same conclusion: differential early fluctuations of the same fashion, that are organ specific. We have shown [28] that within the period under consideration the course of nutrient concentration in the shoot and roots of young maize plants is related to the course of dry mass accumulation in an allometric pattern, and the exponent of the power function has been used to quantify the alterations of the allometric pattern that caused by the S-deprivation. The value of the exponent is given for each trendline of Figures 2-4, thus providing a numerical index for the rating of the discussed effects of the deprivation on WSPF, SOD and CAT activities.
Taken together, the presented data indicate that during the first days of the treatment, rebalances in  and H2O2 production and elimination activities take place. Especially the graphs of the variation of specific enzyme activity with dry mass accumulation corroborated this rebalancing. S-deprivation affected dry mass accumulation and altered the tendency of the trendlines and/or the fluctuation patterns of WSPF; in all three organs the trendlines decreased and in a stipper way. S-deprivation affected the balance between SOD and CAT activities; SOD and CAT specific activities presented different oscillation patterns with the increase of DM. The deprivation reversed the oscillation pattern of SOD and decreased the trendlines, whilst it seemed to reverse the oscillation pattern of CAT specific activities differenttially for each organ type. The reversals of the fluctuation patterns were found to be opposed to one another.
5. Acknowledgements
We would like to express our appreciation to Syngenta Hellas and G. Pontikas for the supply of maize seeds.
REFERENCES
- S. S. Gill and N. Narendra, “Reactive Oxygen Species and Antioxidant Machinery in Abiotic Stress Ttolerance in Crop Plants,” Plant Physiology and Biochemistry, Vol. 48, No. 12, 2010, pp. 909-930. doi:10.1016/j.plaphy.2010.08.016
- R. Mittler, S. Vanderauwera, M. Gollery and F. van Breusegem, “Reactive Oxygen Gene Network of Plants,” Trends in Plant Science, Vol. 9, No. 10, 2004, pp. 490-498. doi:10.1016/j.tplants.2004.08.009
- H. W. Scherer, “Sulfur in Soils,” Journal of Plant Nutrition and Soil Science, Vol. 172, No. 3, 2009, pp. 326-335. doi:10.1002/jpln.200900037
- E. T. Nuss and S. A. Tanumihardjo, “Maize: A Paramount Staple Ccrop in the Context of Global Nutrition,” Comprehensive Reviews in Food Science and Food Safety, Vol. 9, No. 4, 2010, pp. 417-436. doi:10.1111/j.1541-4337.2010.00117.x
- D. L. Bouranis, P. Buchner, S. N. Chorianopoulou, L. Hopkins, V. E. Protonotarios, V. F. Siyiannis and M. J. Hawkesford “Responses to Sulfur Limitation in Maize,” In: N. A. Khan, S. Singh and S. Umar, Eds., Sulfur Assimilation and Abiotic Stress in Plant, Springer-Verlag, Berlin, 2008, pp. 1-19. doi:10.1007/978-3-540-76326-0_1
- M. M. Bradford, “A Rapid and Sensitive Method for Quantitation of Microgram Quantities of Protein Utilizing the Principle of Protein-Dye-Binding.” Analytical Biochemistry, Vol. 72, No. 1-2, 1976, pp. 248-254. doi:10.1016/0003-2697(76)90527-3
- R. S. Dhindsa, P. Plumb-Dhindsa and T. A. Thorpe, “Leaf Senescence: Correlated with Increased Levels of Membrane Ppermeability and Lipid Pperoxidation, and Decreased Levels of Superoxide Dismutase and Catalase,” Journal of Experimental Botany, Vol.32, No. 1, 1981, pp. 93-101. doi:10.1093/jxb/32.1.93
- L. A. Del Rio, M. G. Ortega, A. I. López, J. L. Gorgé, “A More Sensitive Modification of the Catalase Assay with the Clark Oxygen Electrode. Application to the Kinetic Study of the Pea Leaf Enzyme,” Analytical Biochemistry, Vol. 80, No. 2, 1977, pp. 409-415. doi:10.1016/0003-2697(77)90662-5
- R Development Core Team, “R: A Language and Environment for Statistical Computing,” R Foundation for Statistical Computing, Vienna, 2011. http://www.R-project.org/
- M. J. Crawley, “The R Book,” John Wiley & Sons, Ltd., Hoboken, 2007. doi:10.1002/9780470515075
- M. Lewandowska and A. Sirko, “Recent Advances in Understanding Plant Rresponse to Sufur-Deficiency Stress,” Acta Biochimica Polonica, Vol. 55, No. 3, 2008, pp. 457- 471.
- L. Hopkins, S. Parmar, D. L. Bouranis, J. R. Howarth and M. J. Hawkesford, “Coordinated Expression of Sulfate Uptake and Components of the Sulfate Assimilatory Pathway in Maize,” Plant Biology, Vol.6, No. 4, 2004, pp. 408-414. doi:10.1055/s-2004-820872
- R. K. Tewari, P. Kumar and P. N. Sharma, “Morphology and Oxidative Physiology of Sulphur-Deficient Mulberry Plants,” Environmental and Experimental Botany, Vol.68, No. 3, 2010, pp. 301-308. doi:10.1016/j.envexpbot.2010.01.004
- M. Jovanovic, V. Lefebvre, P. Laporte, S. Gonzalez-Rizzo, C. Lelandais-Briere, F. Frugier, C. Hartmann and M. Crespi, “How the Environment Regulates Root Architecture in Dicots,” Advances in Botanical Research, Vol. 46, 2008, pp. 35-74. doi:10.1016/S0065-2296(07)46002-5
- C. Gapper and L. Dolan, “Control of Plant Development by Reactive Oxygen Species”, Plant Physiology, Vol. 141, No. 2, 2006, pp. 341-345. doi:10.1104/pp.106.079079
- T. S. Gechev and J. Hille, “Hydrogen Peroxide as a Signal Controlling Plant Programmed Cell Death,” Journal of Cell Biology, Vol. 168, No. 1, 2005, pp. 17-20. doi:10.1083/jcb.200409170
- C. H. Foyer and G. Noctor, “Redox Homeostasis and Antioxidant Signaling: A Metabolic Interface between Stress Perception and Physiological Responses,” The Plant Cell, Vol. 17, No. 7, 2005, pp. 1866-1875. doi:10.1105/tpc.105.033589
- A. A. Rodríguez, K. A. Grunberg and E. L. Taleisnik, “Reactive Oxygen Species in the Elongation Zone of Maize Leaves Are Necessary for Leaf Extension,” Plant Physiology, Vol. 129, No. 4, 2002, pp. 1627-1632. doi:10.1104/pp.001222
- K. Kosova, P. Vitamvas, I. T. Prasil and J. Renaut, “Plant Proteome Changes under Abiotic Stress—Contribution of Proteomics Studies to Understanding Plant Stress response,” Journal of Proteomics, Vol. 74, No. 8, 2011, pp. 1301-1322. doi:10.1016/j.jprot.2011.02.006
- R. K. Tewari, P. Kumar, N. Tewari, S. Srivastava and P. N. Sharma, “Macronutrient Deficiencies and Differential Antioxidant Responses—Influence on the Activity and Expression of Superoxide Dismutase in Maize,” Plant Science, Vol. 166, No. 3, 2004, pp. 687-694. doi:10.1016/j.plantsci.2003.11.004
- D. L. Bouranis, S. N. Chorianopoulou, V. E. Protonotarios, V. F. Siyiannis and M. J. Hawkesford, “Localization of Reactive Oxygen Species and Lignification in Leaves of Young Sulphate-Deprived Maize Plants,” Functional Plant Science and Biotechnology, Vol. 1, No. 2, 2007, pp. 347-354.
- I. M. Juszczuk and M. Ostaszewska, “Respiratory Activity, Energy and Redox Status in Sulfur-Deficient Bean Plants,” Environmental and Experimental Botany, Vol. 74, 2011, pp.245-254. doi:10.1016/j.envexpbot.2011.06.006
- M. C. de Tullio, K. Jiang and L. J. Feldman, “Redox Regulation of Root Apical Meristem Organization: Connecting Rroot Development to its Environment,” Plant Physiology and Biochemistry, Vol. 48, No. 5, 2010, pp. 328-336. doi:10.1016/j.plaphy.2009.11.005
- D. L. Bouranis, S. N. Chorianopoulou, V. F. Siyiannis, V. E. Protonotarios and M. J. Hawkesford, “Aerenchyma Formation in Roots of Maize during Sulphate Starvation,” Planta, Vol. 217, No. 3, 2003, pp. 382-391. doi:10.1007/s00425-003-1007-6
- D. L. Bouranis, S. N. Chorianopoulou, C. Kollias, P. Maniou, V. E. Protonotarios, V. F. Siyiannis and M. J. Hawkesford, “Dynamics of Aerenchyma Distribution in the Cortex of Sulfate-Deprived Adventitious Roots of Maize,” Annals of Botany, Vol. 97, No. 5, 2006, pp. 695-704. doi:10.1093/aob/mcl024
- V. F. Siyiannis, V. E. Protonotarios, B. Zechmann, S. N. Chorianopoulou, M. Müller, M. J. Hawkesford and D. L. Bouranis, “Comparative Spatio-Temporal Analysis of Root Aerenchyma Formation Processes in Maize Due to Sulphate, Nitrate or Phosphate Deprivation,” Protoplasma, 2011. doi:10.1007/s00709-011-0309-y
- D. L Bouranis, S. N. Chorianopoulou, V. F. Siyiannis, V. E. Protonotarios and M. J. Hawkesford, “Lysigenous Aerenchyma Development in Roots—Triggers and CrossTalks for a Cell Elimination Program,” International Journal of Plant Developmental Biology, Vol. 1, No. 1, 2007, pp. 127-140.
- D. L. Bouranis, S. N. Chorianopoulou and L. D. Bouranis, “A Power Function Based Approach for the Assessment of the Sulfate Deprivation Impact on Nutrient Allocation in Young Maize Plants,” Journal of Plant Nutrition, in press.