Neuroscience & Medicine
Vol.2 No.4(2011), Article ID:8878,11 pages DOI:10.4236/nm.2011.24043
Clinical Psychophysical Assessment of the ON- and OFF-Systems of the Magnocellular and Parvocellular Visual Pathways
![]()
Laboratório de Psicofisiologia Sensorial, Depto. Psicologia Experimental e Núcleo de Neurociências e Comportamento, Instituto de Psicologia, Universidade de São Paulo, São Paulo, Brazil.
E-mail: costamf@usp.br
Received October 4th, 2011; revised November 11th, 2011; accepted November 18th, 2011.
Keywords: Visual Perception, Visual Pathway, Contrast Sensitivity, Psychophysics
ABSTRACT
We developed a psychophysical paradigm for the clinical assessment of the contrast sensitivity (CS) mediated by the ONand OFF-systems of the Magnocellular and Parvocellular pathways. We designed a stimulus considering two dimensions: two spatial frequencies (0.5 and 4.5 cpd) and two temporal rates of flicker (33 ms and 1500 ms). To evidence the ONand OFF responses, the CS was measured for two polarities of light with luminance changes of 0.6 dB steps above and below the medium luminance grey background. We tested 38 healthy volunteers. The results shows that Magnocellular contrast sensitivity was higher than Parvocellular for the 33 ms flickering stimulus and the Parvocellular contrast sensitivity was higher than Magnocellular for 1500 ms stimuli. The reliability of the test was checked and confirmed. We concluded that the test performs a rapid measurement of the CS mediated by the ON and OFF systems of Magnocellular and Parvocellular pathways. It is useful in clinical protocols due to its high sensitivity and good reliability.
1. Introduction
The visual system evolved to recognize objects in the environment from patterns of light and dark in the retina by processing the luminance differences (contrast) at the boundaries of objects and their backgrounds. The visual system has two main neural pathways to detect changes in luminance. One pathway is activated by increments of light—the ON-system; and the other pathway is activated by decrements of light—the OFF-system [1].
An important morphological feature of the ON and OFF retinal systems starts within the inner plexiform layer (IPL). Two segregated layers receive the cone inputs in which the ON and OFF cone-bipolar cells make their synaptic contacts with the ON and OFF ganglion cells (Figure 1). The OFF cone-bipolar cells synapse with the OFF ganglion cells at the more proximal sublayer (region called sublamina a) while the cone-bipolar ON cells synapse with the ON ganglion cells at the more distal sublayer (sublamina b) [2-4].
The differences between the pathways are also physiological and functional. Similarly to the photoreceptors, the ON cone-bipolar cells are depolarized during the light stimulation while the OFF cone-bipolar cells are hyperpolarized. The origin of this difference has been related to differences in expression of the glutamate receptors in the ONand OFF bipolar cells’ membrane [5]. Another difference identified is regarding to the cell response firing rate. The ON cells have a more linear and faster response to the stimulus than the OFF cells [6].
Responses of ON and OFF systems are found in the two major pathways involved in the luminance processing: the Magnocellular (MC) and the Parvocellular (PC) pathways [7]. Distinct characteristics of the MC and PC responses to stimulus size and time of presentations are reported. The MC pathway is vigorously activated by low spatial frequencies (i.e. large stimulus elements) whereas the PC pathway is activated by high spatial frequencies (i.e. small stimulus elements) [8]. The MC pathway activation is also related to objects with low contrast and rapidly changing the stimuli, while the Parvocellular pathway is relatively insensitive to rapid movement

Figure 1. The morphological feature of the synapses stratification of the ONand OFF-bipolar cells (B) at the inner plexiform layer (IPL) of retina. Thet respective connections with the cones (C) and the ganglion cell (G) originates the bright and dark detection subsystems.
changes and clearly defined patterns or objects [8]. In addition, the psychophysical correlates of the characteristic signature of MC and PC pathways were obtained by manipulating the luminance and the time of the stimuli presentation [9].
The electrophysiological demonstrations for a separate activity of MC and PC pathways in humans were obtained by varying the spatial frequencies and the time of stimuli presentation [10]. The differential properties of the MC and PC pathways make it possible to infer the relative role of those pathways in the capacity to discriminate contrast levels at different spatial patterns, usually evaluated by the contrast sensitivity function measurement.
Electrophysiological and psychophysical studies have been addressed to assess the ON and OFF systems by measuring response to motion [11-13] and contrast stimuli [14-16]. The conclusion of these studies is that the role of the ON and OFF systems is to optimize the transfer of changes in luminance signs from the retina to the visual cortex.
Discrepancies between the ON and OFF responses have been reported and point to a discretely better performance of the OFF system. Contrast sensitivity thresholds for the OFF stimulus measured by moving targets reached the stable values before those for the ON stimulus suggesting that the discrimination of direction is more strongly dependent on spatial displacement for decreements than increments of light [12]. Another study illustrates discrepancies in detection of incremental and decremental stimuli since responses to a rapid-off sawtooth pattern yielded a higher contrast sensitivity than those to a rapid-on sawtooth pattern at low and middle temporal frequencies [14]. However, the asymmetry observed between ON and OFF systems is not fully confirmed. Authors have been pointing out that: first—linear ON cells could provide graded responses to decrements of light; second—both ON and OFF cells could signal decrement of light; third—since there are many cell types at each level of the visual pathway it is difficult to point precisely where the response asymmetry between the systems arises [6].
With regard to the selective assessment of the MC and PC visual pathways, a recent psychophysical test was designed to measure the contrast sensitivity mediated to MC and PC pathways [9]. However, the time to conclude the test is very long, making it difficult to use it for clinical purposes.
Our aim in this study is to develop a psychophysical paradigm for the rapid assessment of contrast sensitivity (CS) mediated by the ONand OFF divisions of the MC and PC pathways. Although the previous studies had measured the Magno-Parvo contribution to contrast sensitivity and other the studies measured the responses of the ON and OFF systems, a method for the fast psychophysical assessment of the contrast sensitivity mediated by the ON and OFF systems of MC and PC pathways has not been previously suggested. Normative data based on non-parametric tolerance limits were also calculated.
It is clinically relevant to evaluate the contrast sensitivity function mediated by ONand OFF-systems of MC and PC pathways. There are many retina and eye diseases that could affect the gross function of MC and PC pathways [17-25] or diseases that produce selective impairment in ONor OFF-systems such as as melanomaassociated retinopathy [18], X-linked retinitis pigmentosa [26], congenital stationary night blindness [27,28] and Duchenne Muscular Dystrophy [29].
2. Materials and Methods
2.1. Equipment
The stimuli were generated with the software Psycho for Windows (v.2.36) installed in a PC with a 14-bit resolution graphic board (VSG visual stimulus generator v. 2/4) both from Cambridge Research System (Rochester, Kent, UK) and were displayed on a 19 in. Triniton GFD-420 (Sony, Tokyo, Japan) color monitor. The display resolution was set at 800 X 600 and the refresh rate was 100 Hz non-interlaced. Measurements of spectral data, luminance, chromaticity, and the correlated color temperature for each color channel were performed with a spectroradiometer (CS-1000 Konica Minolta, Inc., Osaka, Japan) with the detector flush to the screen. The luminance output of the screen was calibrated using the measurements of a luminance meter (LS-110, Konica Minolta Sensing, Inc., Osaka, Japan). Screen uniformity was checked at the maximum output.
2.2. Spatial and Temporal Configurations
The rationale for the measurement of the contrast sensitivity mediated selectively by the Magnocellular and Parvocellular pathways is as follows: since PC cell responses are tuned to high spatial frequencies and low temporal rate of flickering and the MC cells have the opposite response, i.e., they are tuned to low spatial frequencies and high temporal rates of flicker [25], we designed stimuli with variables in these two dimensions. The stimuli were spatial patterns of different sizes and could be presented at different temporal rates of flicker. Considering the differences in the responses of cells from the MC and PC pathways, it is assumed that the low spatial frequency stimuli are more selective to the MC pathway and that the middle to high spatial frequencies stimuli are more selective to the PC pathway.
Luminance contrast sensitivity was measured using a black-white checkerboard pattern. The visual stimuli were squares of 4 × 4˚ visual angle presented on a background with an average luminance of 34.4 cd∙m–2 at the viewing test distance of 1 meter. The area of the background was 10˚ Two checkerboard sizes were tested: 0.5 cycles per degree (cpd) (designed for MC activation) and 4.5 cpd (designed for PC activation). The stimuli were presented at two temporal frequencies: 1500 ms and 33 ms. Similar considerations regarding which of the visual pathways is tuned to the spatial frequencies, apply to the temporal domain. It is assumed that the PC pathway is more selective to the low temporal frequencies and that high temporal frequencies stimuli are more easily processed by the MC pathway [25]. To avoid visual adaptation to the checkerboard pattern, a full-screen stimulus of uniform gray was presented during 300 ms after each spatial stimulus presentation.
In order to selectively activate the ONand OFF-systems, the contrast sensitivity was measured for two light polarities (increments and decrements of light) with luminance changes in steps of 0.6 dB departing from the medium luminance grey background. For increments of light the stimulus varied between grey and white—ON system. For decrements of light the stimulus varied between grey and black—OFF system. Since the polarity of light was modulated from a fixed medium level of luminance, the contrast was defined as a Weber contrast (ΔI/I), where I is the luminance of the grey background and ΔI is the difference between the background and the increment or decrement of light.
The test consisted of trials composed by one checkerboard spatial frequency and one modulation (between grey and black/ white) with the two temporal conditions 33 ms (30.3 Hz) and 1500 ms (0.67 Hz): 0.5 cpd measuring contrast for increment and for decrement of light; 4.5 cpd measuring contrast for increment and decrement of light. Thus, we perfomed 4 blocks of tests (2 trials × 2 contrasts) (Figure 2).
2.3. Procedure
Subjects sat in a comfortable chair at 1 meter from the monitor screen and they were instructed to keep their eye fixation in a small black cross centered on the screen. No head stabilization was used. Ophthalmological patchs (Oftan, AMP, Sao Paulo, Brazil) were used to cover one of the eyes. A period of five minutes of adaptation to the mean grey luminance preceded the contrast sensitivity measurements. The test always began with a descending trial (starting with an infrathreshold stimulus) and was

Figure 2. The chessboard stimuli used to assess the low frequency (0.5 cpd/Magnocellular) and high frequency (4.5 cpd/Parvocellular) patterns. The ON subsystem was assessed with a modulation between white and gray and the OFF subsystem was assessed with a modulation between black and gray (upper panel).
followed by the ascending trial (starting with a suprathreshold stimulus). The temporal condition was randomly chosen by the software at each stimulus presentation.
Contrast sensitivity determination was made for each one of the 4 blocks using the method of adjustments procedure. Contrast changed in 0.6 dB steps at the rate of 1 step every 2 seconds and the subject’s task was to verbally notify the examiner when the pulsing squares appeared (ascending trials) or disappeared (descending trials). The CS was calculated as the mean of the contrast values measured by the three ascending and descending trials. The test was performed monocularly in a randomly selected eye, in a darkened room. A total 4 block tests were performed in 10 - 15 min.
2.4. Test Reliability
Test reliability was estimated by a comparison of the contrast sensitivity measurements in a test-retest design. The retest of the contrast sensitivity measurements was performed in a sample (n = 7, 4 male) of the volunteers with a mean interval of one month (± 4 days) between the first and the second measurements. The retests were also performed monocularly in the same eye and conditions than the first test.
2.5. Participants
We tested 40 subjects recruited among the University of São Paulo students and staffs. They were divided according to their age in three group: 18 - 30 yrs (n = 23; mean = 24.0 SD = 4.6; 14 males); 31 - 45 yrs (n = 11; mean = 38.4 SD = 4.2; 5 males); and 4 subjects aged between 52 and 57 yrs (mean = 54.5 SD = 2.4; 2 males) were considered as the third group. All patients underwent a complete ophthalmological examination, includeing best-corrected visual acuity measurement, slit-lamp biomicroscopy and optic disc evaluation with the pupils dilated, with a 78-diopter lens. Inclusion criteria were best-corrected visual acuity of 20/20 or better measured monocularly at 4 meters using an ETDRS chart—tumbling E (Xenonio, Sao Paulo, Brazil), refraction of ≤ 3.0 diopters considering the spheric equivalent of astigmatism values, absence of ophthalmological diseases and absence of known neurological and systemic diseases. Smokers and users of alcohol (defined as more than 1 daily dose) were excluded. The study was approved by the Ethics Committee of the Institute of Psychology, University of Sao Paulo, and all subjects gave a signed informed consent to participate in the experiment. All were naive to the specific experimental question. This study is also in accordance with the ethical standards laid down in the 1964 Declaration of Helsinki. Table 1 presents the subjects’ demographic data (leftmost columns).
3. Results
The contrast sensitivity measured for each volunteer in each tested condition is shown in Table 1 (rightmost column). Comparisons within groups showed statistical differences for PC ON (H = 8.22, p = 0.016) and PC OFF (H = 9.36, p = 0.009), indicating that the older group had lower contrast sensitivity than the other two groups. For MC ON and MC OFF conditions we found a nonsignificant tendency of reduction of contrast sensitivity for the older groups. These results are shown in Figure 3.
For the following analysis, we considered only the group of subjects between 18 - 30 years, since the power of the statistical results was very high (Power = 0.998; t = 2.01 calculated for α = 0.05) compared to the 31 - 45 group (Power = 0.09; t = 2.44 calculated for α = 0.05) and to the 46 yrs group (Power = 0.07; t = 3.18 for α = 0.05).
The mean contrast sensitivity did not differ between the ON and OFF measurements for both MC and PC conditions. This result is summarized in Table 2.
In the comparison between the MC and PC contrast sensitivity results measured at different flicker rates, we found statistical differences. For the 33 ms flicker, MC contrast sensitivity was higher than for PC in both ON (t = 7.89; p < 0.001) and OFF (t = 9.19; p < 0.001) conditions. For the 1500 ms flicker, the opposite effect was observed, i.e., the PC contrast sensitivity was higher than that measured for MC, in both ON (t = 11.96; p < 0.001) and OFF (t = 10.21; p < 0.001) conditions (Figure 4).
Comparisons between the mean of the measurements of the contrast sensitivity for the 33 ms and 1500 ms stimulus flicker were statistically different for all conditions MC ON (t = 5.38; p < 0.001), MC OFF (t = 4.78; p < 0.001), PC ON (t = 15.11; p < 0.001) and PC OFF (t = 14.10; p < 0.001) responses (Figure 5).
Since the contrast sensitivity was higher for the low spatial frequency stimulus at 33 ms and for the mid spatial frequency stimulus at 1500 ms, we performed the statistical analysis considering only the measurements in which the contrast sensitivity was evidencing a stronger MC or PC mediation: for MC (0.5 cpd) we considered only the 33 ms stimuli and for PC (4.5 cpd) we considered the 1500 ms stimuli for both ON and OFF measurements.
3.1. Tolerance Limits
Normative values were calculated based on a non-parametric statistics for the 18 - 30 and 31 - 45 groups, but not for the older group due to the small number of subjects (n = 4). We considered the normal range the values


Table 1. Demographic data and contrast sensitivity results.

Figure 3. Contrast sensitivity measured in the three age groups are presented for the low spatial frequency (Magno) and high spatial frequency (Parvo) protocols in combination with the ON and OFF paradigms. For high spatial frequency a statistical difference was observed for the older group.

Figure 4. Comparison between the ON and OFF measurements of contrast sensitivity for the 33 ms stimulus (a) and for the 1500 ms stimulus (b). In (a), the MC contrast sensitivity was statistically higher than the PC; in (b), the reverse was found: the PC contrast sensitivity showed higher values than for MC.

Table 2. Results of the mean comparison by the student t test.
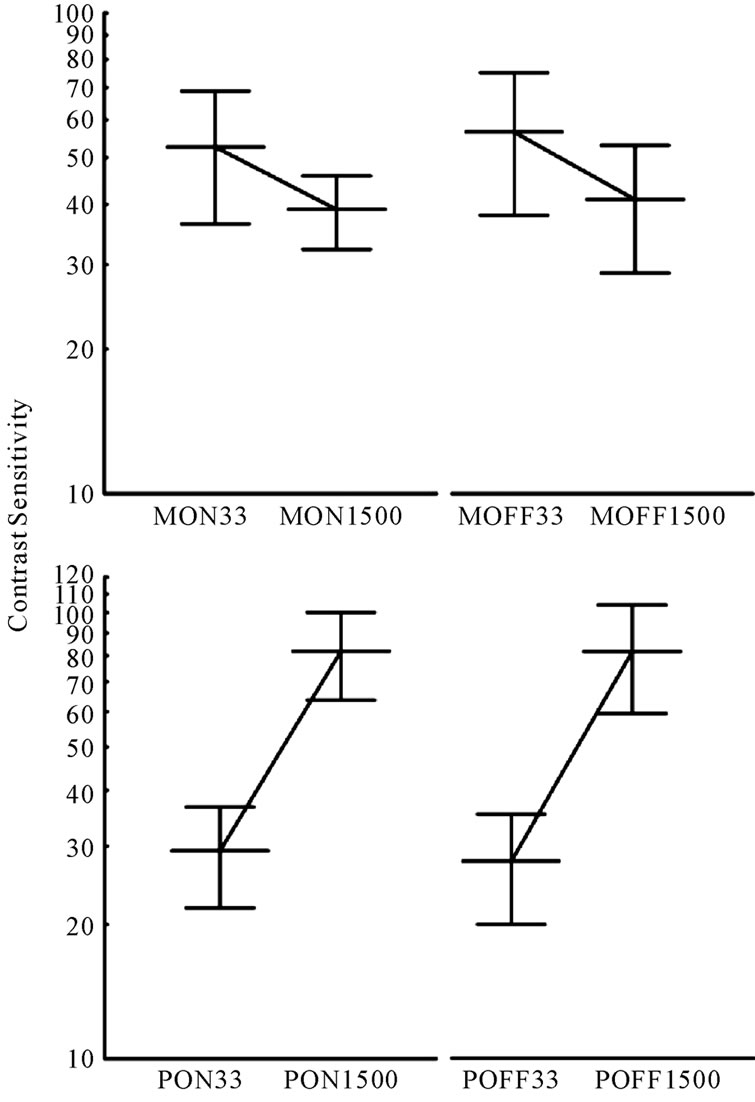
Figure 5. Average contrast sensitivities measured for their MC (top) and PC (bottom) protocols. Lines connecting the two flicker rates show opposite slopes. The steeper slope present in the PC protocol data suggests a better isolation for this than for the MC visual pathway.
between 5 and 95 Percentiles, corresponding to 1.96 times the standard deviation in the standard normal curve. These values are shown in Table 3.
3.2. Test Reliability
Test-retest was performed in 7 subjects from group 18 - 30 (age mean = 25.5 ± 3.9 yrs; 4 males). No statistical difference was found between the contrast sensitivity of the test and retest measurements for MC ON (T = 11.0, p = 0.611), MC OFF (T = 8.0, p = 0.310), PC ON (T = 12.0, p = 0.735) and PC OFF (T = 10.0, p = 0.498) (Wilcoxon Test). Table 4 shows the contrast sensitivity measured for each subject in both test and retest conditions.
4. Discussion
A rapid assessment of the contrast sensitivity for increment and decrement of light was successfully measured for the two spatial frequencies used, 0.5 and 4.5 cpd. The total time to test the 4 trials was between 10 and 15 minutes, which is compatible with clinical applicability of this test.
Low spatial and high temporal frequencies in luminance contrast profiles are related to the Magnocellular function. On the other hand, high spatial and low temporal frequencies are related to Parvocellular function [8,25]. The different stimulus sizes used in our protocol showed to be selective for the Magnocellular and Parvocellular contribution to contrast sensitivity. A detailed account of MC and PC selectivity is presented in the following sections.
Clinical relevance for the study MC and PC pathways and their respective ON and OFF subsystems is well documented in the literature. Many diseases of eye and retina could affect the function of MC and PC pathways. Alterations in the contrast sensitivity mediated by the PC pathway were evident in patients with ocular hypertensive glaucoma using sinusoidal gratings but no losses in the MC pathway were detected [19]. In another study, however, Anderson & OBrien [17] found a reduction in the PC and in the MC pathways measuring resolution acuity with high spatial frequency pattern reversal grating and with stationary sinusoidal gratings. In fact, clinical tests have contributed to show most of examples of separate functioning of the MC and PC visual pathways [8,17,19,25]. It has also been possible to successfully isolate the MC and PC contribution to contrast sensitivity in healthy subjects using the pedestal paradigm but the time to complete the protocol is long [9,18,21,23,30].
Based on the results of these studies we believe that an appropriate paradigm to measure with more selectivity the MC and PC pathways contribution to the spatial processing of visual stimuli needs to be introduced. An advantage of the present paradigm over those discussed above is to provide rapid psychophysical assessment of the contrast sensitivity mediated by MC and PC pathways and their respective ON and OFF subsystems, allowing its use for clinical evaluations and protocols.
4.1. Selectivity to MC and PC Pathways
Differences in the luminance spatial contrast sensitivity between the MC and PC pathways are well described in the literature. According to Merigan & Maunsell [8] and Demb et al., [25] the MC pathway is tuned to detect low spatial and high temporal frequencies whereas the PC

Table 3. Tolerance limits of contrast sensitivity.

Table 4. Test-retest contrast sensitivity results.
pathway is tuned to high spatial and low temporal frequencies.
The differences in the contrast sensitivities between the low (0.5 cpd) and the middle (4.5 cpd) spatial frequencies used suggest that our procedure measures separately the luminance spatial contrast sensitivities mediated by the MC and PC pathways. For increment and decrements of light, the results obtained at low spatial frequency stimuli showed higher mean contrast sensitivities for stimuli with high temporal frequency (33 ms) compared to those with low temporal frequency (1500 ms). These results strongly suggest that our low spatial frequency protocol is selective for the responses of the MC pathway, which, according to Merigan & Maunsell [8], is tuned to low spatial and high temporal frequencies (see Figure 5). The opposite occurred for the stimuli designed to activate the PC pathway. For increment and decrement of light the results obtained with the high spatial frequency stimulus showed mean contrast sensitivity higher for the low temporal frequency (1500 ms) compared to the high temporal frequency (33 ms). These results strongly suggest that our high spatial frequency protocol is selective for responses of the PC pathway, which is tuned to high spatial and low temporal frequentcies.
The smaller difference in the CS measurements observed between the fast (33 ms) and slow (1500 ms) temporal frequencies in the MC compared to the PC protocol could be explained based on the spatial harmonics present in both stimuli. In the checkerboard pattern, higher harmonics are present during stimulation. For the low spatial frequency stimulus (0.5 cpd) the third harmonic (1.5 cpd) could weaken the MC selectivity increasing the CS measured for the longer temporal duration. The same effect is, of course, present in the PC stimuli (4.5 cpd). However, the third harmonic (13.5 cpd) is more selective for the PC pathway and its contribution would increase the longer temporal duration stimulus and consequently, increase the difference between the CS measured for faster and longer stimuli presentations.
The reduced contrast sensitivities for the older subjects were found only for the high spatial frequency stimulus (Figure 3). This result could indicate that the PC pathway was more affected than the MC pathway by changes caused by aging in the optical and retinal structures.
There is an evident relevance for the development of clinical tools for assessment of contrast sensitivity mediated by MC and PC pathways. Recently, an increasing number of studies have shown impairment in early-stage processing of visual information. This impairment is not only related to retina and eye diseases like glaucoma [17, 21,31-33] ambliopia and strabismus [34], melanoma-associated retinopathy [24,18,28], X-linked retinitis pigmentosa [26,35], congenital stationary night blindness [28], and neurological diseases as migraine [30] or Duchenne Muscular Dystrophy [29], but also to the neurocognitive or high-level of cortex processing disorders, such as schizophrenia [36,37], autism [38-40], working memory impairment [41] and dyslexia [25,42-45].
An important advantage of our methodology is a fast and reliable measurement of contrast sensitivity separately mediated by MC and PC pathways and, in addition, with the same measurement, we can extract the ON and OFF subsystems light contribution to the early stage processing of the spatial vision information.
4.2. Selectivity to ON and OFF-Systems
Light increments and decrements are processed by different subgroups of the visual pathways. The segregation of the response to light begins at the level of the bipolar cells of the retina [4]. Studies using psychophysical and electrophysiological paradigms measured the responses of ON-and OFF systems to motion [11-13,46] and to contrast stimuli [16].
Although the ON and OFF systems are supposedly designed to optimize the transfer of luminance changes to the visual cortex, they are not symmetrical in their function and differences in the ON and OFF responses have been reported. A psychophysical study measuring contrast sensitivity using moving targets suggested that the direction discrimination is more strongly dependent on spatial displacement for decrements than for increments of light [12]. An electrophysiological study using VEP techniques concluded there is an advantage for detection of decrements as compared to increments of light [14].
The asymmetries in contrast sensitivity that we measured for MC and PC pathways were in line with the asymmetries of ON and OFF responses reported by these studies. Contrast sensitivity was higher for OFF comparing to ON stimuli. Although no statistical difference was found, a tendency for difference was clear.
The clinical relevance for the ON and OFF system evaluation lies in the fact that there are retinal diseases that affect only one of the systems. Melanoma-associated retinopathy [24], X-linked retinitis pigmentosa [26], congenital stationary night blindness [27] and Duchenne Muscular Dystrophy [29] are examples of diseases that affect the ON-pathway but not the OFF-pathway. A psychophysical test adapted for clinical usage, with faster and reliable protocols, could help clinicians to diagnose and study the functional losses of these diseases.
4.3. Clinical Protocol Design
We suggest that the protocol for clinical application should contain only the conditions in which the contrast sensitivity maximized MC or PC activation: for the MC condition (0.5 cpd) the 33 ms stimulus should be used and for the PC condition (4.5 cpd), the 1500 ms stimulus for both ON and OFF systems measurements. This simplification of the procedure from the original testing protocol reduces the testing time in almost half without loss of the main information. It is important to stress here that clinical tests should be easy to understand, since there are patients with low formal education level. Also, the testing time should be as short as possible, since elderly people and chronic patients frequently have a lower fatigue threshold.
Shortening of the test protocol helps to meet clinical difficulties in psychophysical assessment of visual functions. In the proposed protocol contrast sensitivity mediated by the MC and PC pathways in the ON and OFF subsystems can be measured in a 10 minute test.
The test-retest reliability was very consistent despite the number of subjects tested. For all MC and PC mediated contrast sensitivities and also for the ON and OFF systems measurements very similar results were found.
Statistical tolerance limits are the limits in which we expect a stated proportion of the population to lie. Tolerance limits of the normal range were calculated based on the 5th and 95th Percentiles (see Table 3). However, the number of subjects in the older group was not sufficient to allow us to determine the tolerance limits and more volunteers are need.
In conclusion, our contrast sensitivity test can provide a rapid measurement of the Magnocellular and Parvocellular pathways contribution to the contrast function. Robust responses were obtained for both Magnocellular and Parvocellular pathways and also for the ONand OFFsubsystems. The protocols were adapted for clinical use and patients could complete the tasks without difficulty. We believe that this contrast sensitivity test can contribute to more accurate studies of the spatial vision processed at early stages of the visual pathways and also to a more refined analysis of the retina and visual pathways damage in disease processes.
5. Acknowledgements
I would like to thank Luiz Carlos de Lima Silveira for the important contribution in the initial stages of the study and Dora Fix Ventura for all the theoretical discussions and insights during the entire work. M.F.C. is a CNPq level 2 Fellow Researcher. I also would like acknowledge CNPq (401153/2009-6) for the financial support.
REFERENCES
- P. H. Schiller, J. H. Sandell and J. H. Maunsell, “Functions of the ON and OFF Channels of the Visual System,” Nature, Vol. 322, No. 6082, 1986, pp. 824-825. doi:10.1038/322824a0
- E. V. Famiglietti and H. Kolb, “Structural Basis for OnCenter and Off-Center Responses in Retinal GanglionCells,” Science, Vol. 194, No. 4261, 1976, pp. 193-195. doi:10.1126/science.959847
- R. Nelson, E. V. Famiglietti and H. Kolb, “Intracellular Staining Reveals Different Levels of Stratification for On-Center and Off-Center Ganglion-Cells in Cat Retina,” Journal of Neurophysiology, Vol. 41, No. 2, 1978, pp. 472-483.
- J. Ammermuller and H. Kolb, “The Organization of the Turtle Inner Retina. 1. On-Center and Off-Center Pathways,” Journal of Comparative Neurology, Vol. 358, 1995, pp. 1-34. doi:10.1002/cne.903580102
- S. H. Devries, “Selective Distribution of AMPA and Kainate Receptors at the Mammalian Cone to OFF Bipolar Cell Synapse,” Investigative Ophthalmology & Visual Science, Vol. 41, 2000, p. S621.
- E. J. Chichilnisky and R. S. Kalmar, “Functional Asymmetries in ON and OFF Ganglion cells of Primate Retina,” Journal of Neuroscience, Vol. 22, No. 7, 2002, pp. 2737-2747.
- B. B. Lee, “Receptive Field Structure in the Primate Retina,” Vision Research, Vol. 36, No. 5, 1996, pp. 631-644. doi:10.1016/0042-6989(95)00167-0
- W. H. Merigan and J. H. R. Maunsell, “How Parallel Are the Primate Visual Pathways,” Annual Review of Neuroscience, Vol. 16, 1993, pp. 369-402. doi:10.1146/annurev.neuro.16.1.369
- J. Pokorny and V. C. Smith, “Psychophysical Signatures Associated with Magnocellular and Parvocellular Pathway Contrast Gain,” Journal of the Optical Society of America A: Optics Image Science and Vision, Vol. 14, No. 9, 1997, pp. 2477-2486. doi:10.1364/JOSAA.14.002477
- S. Plainis and I. J. Murray, “Neurophysiological Interpretation of Human Visual Reaction Times: Effect of Contrast, Spatial Frequency and Luminance,” Neuropsychologia, Vol. 38, No. 12, 2000, pp. 1555-1564. doi:10.1016/S0028-3932(00)00100-7
- C. Wehrhahn and D. Rapf, “ONand OFF-Pathways form Separate Neural Substrates for Motion Perception: Psychophysical Evidence,” Journal of Neuroscience, Vol. 12, No. 6, 1992, pp. 2247-2250.
- C. Wehrhahn and D. Rapf, “Perceptual Learning of Apparent Motion Mediated through ONand OFF-Pathways in Human Vision,” Vision Research, Vol. 41, No. 3, 2001, pp. 353-358. doi:10.1016/S0042-6989(00)00232-7
- P. H. Schiller, “The ON and OFF Channels of the VisualSystem,” Trends in Neurosciences, Vol. 15, No. 3, 1992, pp. 86-92. doi:10.1016/0166-2236(92)90017-3
- R. W. Bowen, J. Pokorny and V. C. Smith, “Sawtooth Contrast Sensitivity: Decrements Have the Edge,” Vision Research, Vol. 29, No. 11, 1989, pp. 1501-1509. doi:10.1016/0042-6989(89)90134-X
- R. W. Bowen, J. Pokorny, V. C. Smith and M. A. Fowler, “Sawtooth Contrast Sensitivity: Effects of Mean Illuminance and Low Temporal Frequencies,” Vision Research, Vol. 32, No. 7, 1992, pp. 1239-1247. doi:10.1016/0042-6989(92)90218-8
- K. A. Zaghloul, K. Boahen and J. B. Demb, “Different Circuits for ON and OFF Retinal Ganglion Cells Cause Different Contrast Sensitivities,” Journal of Neuroscience, Vol. 23, No. 7, 2003, pp. 2645-2654.
- R. S. Anderson and C. OBrien, “Psychophysical Evidence for a Selective Loss of M Ganglion Cells in Glaucoma,” Vision Research, Vol. 37, No. 8, 1997, pp. 1079-1083. doi:10.1016/S0042-6989(96)00260-X
- K. R. Alexander, C. S. Barnes, G. A. Fishman, J. Pokorny and V. C. Smith, “Contrast Sensitivity Deficits in Inferred Magnocellular and Parvocellular Pathways in Retinitis Pigmentosa,” Investigative Ophthalmology & Visual Science, Vol. 45, 2004, pp. 4510-4519. doi:10.1167/iovs.04-0188
- E. A. Ansari, J. E. Morgan and R. J. Snowden, “Psychophysical Characterisation of Early Functional Loss in Glaucoma and Ocular Hypertension,” British Journal of Ophthalmology, Vol. 86, No. 10, 2002, pp. 1131-1135. doi:10.1136/bjo.86.10.1131
- H. Demirci, A. Gezer, F. Sezen, T. Ovali, T. Demiralp and U. Isoglu-Alkoc, “Evaluation of the Functions of the Parvocellular and Magnocellular Pathways Strabismic Amblyopia,” Journal of Pediatric Ophthalmology & Strabismus, Vol. 39, No. 4, 2002, pp. 215-221.
- A. M. McKendrick, D. K. Badcock and W. H. Morgan, “Psychophysical Measurement of Neural Adaptation Abnormalities in Magnocellular and Parvocellular Pathways in Glaucoma,” Investigative Ophthalmology & Visual Science, Vol. 45, No. 6, 2004, pp. 1846-1853. doi:10.1167/iovs.03-1225
- Y. Shan, M. L. Moster, R. A. Roemer and J. B. Siegfried, “Abnormal Function of the Parvocellular Visual System in Anisometropic Amblyopia,” Journal of Pediatric Ophthalmology & Strabismus, Vol. 37, 2000, pp. 73-78.
- K. R. Alexander, J. Pokorny, V. C. Smith, G. A. Fishman and C. S. Barnes, “Contrast Discrimination Deficits in Retinitis Pigmentosa Are Greater for Stimuli That Favor the Magnocellular Pathway,” Vision Research, Vol. 41, No. 5, 2001, pp. 671-683. doi:10.1016/S0042-6989(00)00286-8
- K. R. Alexander, C. S. Barnes, G. A. Fishman and A. H. Milam, “Nature of the Cone ON-Pathway Dysfunction in Melanoma-Associated Retinopathy,” Investigative Ophthalmology & Visual Science, Vol. 43, No. 4, 2002, pp. 1189-1197.
- J. B. Demb, G. M. Boynton, M. Best and D. J. Heeger, “Psychophysical Evidence for a Magnocellular Pathway Deficit in Dyslexia,” Vision Research, Vol. 38, No. 11, 1998, pp. 1555-1559. doi:10.1016/S0042-6989(98)00075-3
- K. R. Alexander, C. S. Barnes and G. A. Fishman, “ON-Pathway Dysfunction and Timing Properties of the Flicker ERG in Carriers of X-Linked Retinitis Pigmentosa,” Investigative Ophthalmology & Visual Science, Vol. 44, No. 9, 2003, pp. 4017-4025. doi:10.1167/iovs.02-0989
- C. S. Barnes, K. R. Alexander and G. A. Fishman, “A Distinctive form of Congenital Stationary Night Blindness with Cone ON-Pathway Dysfunction,” Ophthalmology, Vol. 109, 2002, pp. 575-583. doi:10.1016/S0161-6420(01)00981-2
- J. E. Wolf and G. B. Arden, “Selective Magnocellular Damage in Melanoma-Associated Retinopathy: Comparison with Congenital Stationary Nightblindness,” Vision Research, Vol. 36, No. 15, 1996, pp. 2369-2379. doi:10.1016/0042-6989(95)00316-9
- K. Benoff, K. Fitzgerald, V. Zemon, E. Pinkhasov, J. Gordon and G. Cibis, “Magnocellular ON-Pathway Deficits in Duchenne Muscular Dystrophy: A Visual Evoked Potential Study,” Investigative Ophthalmology & Visual Science, Vol. 42, 2001, p. S787.
- A. M. McKendrick and D. R. Badcock, “Constrast-Processing Dysfunction in Both Magnocellular and Parvocellular Pathways in Migraineurs with or without Aura,” Investigative Ophthalmology & Visual Science, Vol. 44, 2003, pp. 442-448. doi:10.1167/iovs.02-0630
- A. I. Klistorner and S. L. Graham, “Early Magnocellular Loss in Glaucoma Demonstrated Using the Pseudorandomly Stimulated Flash Visual Evoked Potential,” Journal of Glaucoma, Vol. 8, No. 2, 1999, pp. 140-148. doi:10.1097/00061198-199904000-00010
- A. M. McKendrick, G. P. Sampson, M. J. Walland and D. R. Badcock, “Contrast Sensitivity Changes due to Glaucoma and Normal Aging: Low-Spatial-Frequency Losses in both Magnocellular and Parvocellular Pathways,” Investigative Ophthalmology & Visual Science, Vol. 48, No. 5, 2007, pp. 2115-2122. doi:10.1167/iovs.06-1208
- H. Sun, W. H. Swanson, B. Arvidson and M. W. Dul, “Assessment of Contrast Gain Signature in Inferred Magnocellular and Parvocellular Pathways in Patients with Glaucoma,” Vision Research, Vol. 48, No. 26, 2008, pp. 2633-2641. doi:10.1016/j.visres.2008.04.008
- A. R. Davis, J. J. Sloper, M. M. Neveu, C. R. Hogg, M. J. Morgan and G. E. Holder, “Differential Changes of Magnocellular and Parvocellular Visual Function in Earlyand Late-Onset Strabismic Amblyopia,” Investigative Ophthalmology & Visual Science, Vol. 47, No. 11, 2006, pp. 4836-4841. doi:10.1167/iovs.06-0382
- K. R. Alexander, A. S. Rajagopalan, W. Seiple, V. M. Zemon and G. A. Fishman, “Contrast Response Properties of Magnocellular and Parvocellular Pathways in Retinitis Pigmentosa Assessed by the Visual Evoked Potential,” Investigative Ophthalmology & Visual Science, Vol. 46, No. 8, 2005, pp. 2967-2973. doi:10.1167/iovs.05-0231
- P. D. Butler, I. Schechter, L. A. DeSanti, J. Maddox, J. M. Harkavy-Friedman, V. C. Greenstein, et al., “Examination of Magnocellular and Parvocellular Visual Pathway Function in Schizophrenia Using Electrophysiological and Psychophysical Techniques,” Schizophrenia Research, Vol. 36, 1999, p. 161.
- P. D. Butler, I. Schechter, V. Zemon, S. G. Schwartz, V. C. Greenstein, J. Gordon, et al., “Dysfunction of EarlyStage Visual Processing in Schizophrenia,” American Journal of Psychiatry, Vol. 158, No. 7, 2001, pp. 1126- 1133. doi:10.1176/appi.ajp.158.7.1126
- A. K. Ludlow, A. J. Wilkins and P. Heaton, “The Effect of Coloured Overlays on Reading Ability in Children with Autism,” Journal of Autism and Developmental Disorders, Vol. 36, No. 8, 2006, pp. 507-516. doi:10.1007/s10803-006-0090-5
- E. Pellicano, L. Gibson, M. Maybery, K. Durkin and D. R. Badcock, “Abnormal Global Processing along the Dorsal Visual Pathway in Autism: A Possible Mechanism for Weak Visuospatial Coherence?” Neuropsychologia, Vol. 43, No. 7, 2005, pp. 1044-1053. doi:10.1016/j.neuropsychologia.2004.10.003
- N. J. Rinehart, J. L. Bradshaw, A. V. Brereton and B. J. Tonge, “A Clinical and Neurobehavioural Review of High-Functioning Autism and Asperger’s Disorder,” Australian and New Zealand Journal of Psychiatry, Vol. 36, No. 6, 2002, pp. 762-770.
- R. Hecker and B. Mapperson, “Dissociation of Visual and Spatial Processing in Working Memory,” Neuropsychologia, Vol. 35, No. 5, 1997, pp. 599-603. doi:10.1016/S0028-3932(96)00106-6
- D. B. Bednarek and A. Grabowska, “Luminance and Chromatic Contrast Sensitivity in Dyslexia: The Magnocellular Deficit Hypothesis Revisited,” Neuroreport, Vol. 13, No. 18, 2002, pp. 2521-2525. doi:10.1097/00001756-200212200-00028
- B. J. W. Evans, N. Drasdo and I. L. Richards, “Dyslexia: The Link with Visual Deficits,” Ophthalmic and Physiological Optics, Vol. 16, No. 1, 1996, pp. 3-10. doi:10.1016/0275-5408(95)00021-6
- D. Omtzigt, A. W. Hendriks and H. H. J. Kolk, “Evidence for Magnocellular Involvement in the Identification of Flanked Letters,” Neuropsychologia, Vol. 40, No. 12, 2002, pp. 1881-1890. doi:10.1016/S0028-3932(02)00069-6
- G. W. Stuart, K. I. McAnally and A. Castles, “Can Contrast Sensitivity Functions in Dyslexia Be Explained by Inattention Rather Than a Magnocellular Deficit?” Vision Research, Vol. 41, No. 24, 2001, pp. 3205-3211. doi:10.1016/S0042-6989(01)00176-6
- P. H. Schiller, “The ON and OFF Channels of the Mammalian Visual System,” Progress in Retinal and Eye Research, Vol. 15, 1995, pp. 173-195. doi:10.1016/1350-9462(95)00009-7