Journal of Geographic Information System, 2011, 3, 160-165
doi:10.4236/jgis.2011.32013 Published Online April 2011 (http://www.SciRP.org/journal/jgis)
Copyright © 2011 SciRes. JGIS
Creation of New Global Land Cover Map with Map
Integration
Koki Iwao1, Kenlo Nishida Nasahara2, Tsuguki Kinoshita3, Yoshiki Yamagata4, Dave Patton4,
Satoshi Tsuchida1
1GEO Grid Research Group, Information Technology Research Institute, National Institute of Advanced Industrial
Science and Technology, Tsukuba, Japan
2Institute of Agricultural and Forest Engineering, University of Tsukuba, Ts ukub, Japan
3School of Agriculture, Ibaraki University, Ibaraki, Japan
4Center for Global Environmental Research, National Institute for Environmen tal Studies, Tsukuba, Japan
5Degree Confluence Project, Victoria, Canada
E-mail: iwao.koki@aist.go.jp
Received January 12, 2011; revised February 4, 2011; accepted February 9, 2011
Abstract
We present here a new approach to the development of a global land cover map. We combined three existing
global land cover maps (MOD12, GLC2000, and UMD) based on the principle that the majority view pre-
vails and validated the resulting map by using information collected as part of the Degree Confluence Project
(DCP). We used field survey information gathered by DCP volunteers from 4211 worldwide locations to
validate the new land cover map, as well as the three existing land cover maps that were combined to create
it. Agreement between the DCP-derived information and the land cover maps was 61.3% for our new land
cover map, 60.3% for MOD12, 58.9% for GLC2000, and 55.2% for UMD. Although some of the improve-
ments we achieved were not statistically significant, this project has shown that an improved land cover map
can be developed and well-validated globally using our method.
Keywords: Global Land Cover Map, Map Integration, Validation
1. Introduction
Many organizations have developed and distributed glo-
bal land cover maps. The differences among the various
maps hinder their effective use for modeling phenomena
such as the carbon cycle and the water cycle, as well as
for ecosystem modeling. For example, terrestrial ecosys-
tem models rely on land cover maps to estimate to tal net
primary production and to model its spatial distribution;
consequently, the accuracy of existing land cover maps
needs to be quantitatively evaluated [1-4]. Land cover
maps are also used to model changes in global land cover.
The model outputs of these studies are also hindered by
the differences in the available maps used as input [5].
There is a crucial need for systematic validation of land
cover maps and improvement of their accuracy.
Studies comparing several land cover maps have
found that the total global areas for particular land cover
classes are similar, but vary significantly by region [6,7].
These results clearly demonstrate that there has been
insufficient progress in validating existing land cover
maps. A new validation method for land cover maps was
recently proposed by Iwao et al. [8]. They used informa-
tion compiled by volunteers contributing to the Degree
Confluence Project (DCP), a project that aims to collect
land cover information at each of the terrestrial intersec-
tions of integer degrees of latitude and longitude
throughout the world (DCP points hereafter). The DCP
contains four directions of photos taken at the conflu-
ences together with text information which explains the
points and its surroundings. It allows registering users
any number of visits to each confluence which enables to
estimate the land cover change as well. Based on that
text and photos, they categorized each confluence into 6
classes (forest, grassland, cropland, wetland, settlements
and other land) and developed validation data. By using
information derived from 749 DCP points, Iwao et al. [8]
validated existing land cover maps of Eurasia. Their re-
K. IWAO ET AL.161
sults suggest that further improvement of the accuracy of
land cover maps is needed and that their validation
method should be applied to global land cover maps. A
similar approach to integrate volunteers input to develop
validation of global land cover map is conducted under
the GEO-Wiki project [9].
Several methods have been proposed to improve the
accuracy of existing land cover maps. One such example
is by the integration of land-classification methods [10].
The fuzzy agreement technique is another method that
has been applied, for example, in the development of the
SYNMAP land cover map [4]. Based on the existing
ecophysiological model, they defined a new legend and
made a relationship between defined legend classes and
the combinations with the legend classes of the original
maps by assigning affinity scores between them based on
fuzzy. They merged map data from MODIS Land Cover
(MOD12), Global Land Cover 2000 (GLC2000), and
Global Land Cover Characteristics (GLCC) to produce
SYNMAP, and described the synergies of the different
map products they used. However, Jung et al. [4] con-
cluded that there was insufficient reference data available
to allow them to thoroughly validate SYNMAP an d show
that it was more accurate than its predecessors.
In this study, we present a new approach for the de-
velopment of a global land cover map by combining three
existing land cover maps and adopting the land classifi-
cation favored by the majority of the contributing maps.
We then validated the n ew land cover map, and the three
maps that contributed to it, by using newly developed
information from 4211 DCP-derived points.
2. Methodology
In our new approach we compared the land cover classes
at corresponding pixels on the three existing land cover
maps and adopted the classification favored by the ma-
jority of those maps. That is, where either two or three
classes at a particular sample point were in agreement,
we used that class. For sample points with three different
classifications, we adopted the classification of the ex-
isting land cover map with the highest lev el of accuracy.
For our study, we used the three most accurate land cover
maps as determined by the valid ation results of Iwao et al.
[8]: these were MOD12 (Boston University, Land cover
and land cover dynamics products user guide, 2003;
available at http://geography.bu.edu/landcover/ userguidelc/
index.html), GLC2000 (Joint Research Centre, Global
land cover 2000; available at http://www-gvm.jrc.it/
glc2000/), and the University of Maryland’s 1-km Global
Land Cover prod uct (UMD) [11].
The simplified IGBP class scheme (14 classes) was
previously used to compile MOD12 and UMD (hereafter,
MOD12_sigbp and UMD_sigbp, respectively), whereas
the LCCS class scheme (22 classes) was used for GLC
2000 (GLC2000_lccs hereafter). To properly reach a
majority decision, the land cover classification schemes
used for the contributing maps must be the same. We
therefore adopted the six classes (forest, croplands,
grassland, wetlands, settlements, and other land) of the
LULUCF (Land Use, Land Use Change and Forestry)
classification scheme established by the Intergovern-
mental Panel on Climate Change (IPCC). This scheme is
available at http://www.ipcc-nggip.iges.or.jp/public/gpglu-
lucf/gpglulucf_contents.htm [12]. The relationships we
used between the LULUCF scheme and the three classi-
fication schemes of the three maps that contributed to our
new map were those proposed by Sato and Tateishi [13].
We refer hereafter to the three contributing land cover
maps after conversion to the LULUCF scheme as
MOD12_6c, GLC2000_6c, and UMD_6c.
Because MOD12 had the highest accuracy of the three
contributing maps described in section 3, the land class
of MOD12_sigbp was replaced by the others only when
the classes of GLC2000_6c and UMD_6c agreed, and
only the MOD12_6c class differed. For GLC2000 and
UMD, we assumed the same accuracy of the
GLC2000_lccs and UMD_sigbp classes at a particular
sample point if each pixel showed the same class for all
six classes. If this was the case, we used UMD_sigbp as
the replacement because it used the classification system
we needed for our new land cover map. Compared to
SYNMAP, which employed a new land cover classifica-
tion scheme, this map is more user-friendly for existing
global land cover map users.
Using the rules described above, we produced a new
land cover map based on the simplified IGBP class
scheme (Figure 1). As the new map reflects the Simpli-
fied IGBP class scheme, past users of MOD12_sigbp and
UMD_sigbp can use the new land cover map without the
need to convert classification schemes. The agreement
between the new map and MOD12_sigbp was 97%.
3. Results and Discussion
We developed a global validation dataset based on the
method proposed by Iwao et al. [8]. As of December
2008, 5568 DCP points had been visi t ed at l east once and
photographed by DCP volunteers. Of those DCP points
4211 reflect the characteristic land cover over the sur-
rounding square kilometer. We categorized the land
cover of each of the 4211 DCP points as forest land
(1166), grassland (1 250), crop land (721) , wetland s (378) ,
settlements (40), or other land (656) (Figure 2). The
Copyright © 2011 SciRes. JGIS
K. IWAO ET AL.
Copyright © 2011 SciRes. JGIS
162
Figure 1. The new global land cover map developed by merging land cover maps MOD12, GLC2000, and UMD. Spatial
resolution: 30 arc seconds; Map projection: Plate Caree (Geographic); Classification scheme: Simplified IGBP.
Figure 2. Distribution of the 4211 DCP-derived validation points used in this project. Green, forest; Yellow, croplands; Or-
ange, grasslands; Blue, wetlands; Red settlements; and Gray, other land.
validation data we developed is one of the best available
global validation datasets for global land-cover maps.
For example, in the case of SYNMAP, the author men-
tioned the insufficient reference data available, compared
to the validation information published by Boston Uni-
versity for MOD12 (IGBP land cover validation confi-
dence sites at Boston University: Sample index, 2005,
http://duckwater.bu.edu /lc/sample/index.html), which co-
vers 413 sites (as of May 2006). The validation data we
have developed is almost 10 times that number. Even
compared with the previous study which covers 749 sites
in Eurasia by Iwao et al. [8], the number and the cover-
K. IWAO ET AL.163
age has drastical l y improved. than that of our new land cover map, bu t still higher than
those of GLC2000 and UMD in the arid climatic zone.
Moreover, there is little DCP-derived validation data for
the polar zone. Because this zone is vulnerable to the
effects of global warming, much more DCP-derived
validation data is required in polar zone.
Comparison of the DCP-derived validation informa-
tion with the new land cover map and the existing land
cover maps produced overall agreement rates of 61.3%
for our new land cover map, 60.4% for MOD12, 58.9%
for GLC2000, and 55.2% for UMD. Similarly, compari-
son of the DCP-derived validation information with the
new land cover map and the existing land cover maps
produced kappa coefficient of 0.5 for our new land cover
map, 0.47 for MOD12, 0.47for GLC2000, and 0.41 for
UMD. (Table 1).
Although accurate evaluation data for each of the six
LULUCF land cover classes (Table 3) show that the
overall agreement with DCP data was higher for our new
land cover map than for the existing three maps, UMD
showed the highest agreement for grasslands, GLC2000
for croplands, and MOD12 for settlements. However, the
agreement rate of GLC2000 with 721 croplands DCP
validation points is only 46%. This suggests that the ar-
eas of grassland shown by UMD, and of cropland shown
by GLC2000, are excessive. There are comparatively
few incorrect classifications of forest. There are many
places in existing land cover maps where grassland that
has been validated by DCP data has been misclassified as
forest. These findings suggest that further work is re-
quired to improve the classification methodology for
grassland as well as to incite the definition of forest. We
compared mod12_6c, glc_6c and umd_6c and the agree-
ments between them were 87% between mod12_6c and
glc_6c, 86% between glc_6c and umd_6c and 90% be-
tween mod12_6c and u md_6c respectively. According to
the report of Giri, agreement between original MOD12
and GLC2000 is 59% which means that increasing the
number of class makes uncertainty in classification and
could assume that we need further investigation for the
integration in class as mod12_6c and umd_6c are much
similar than those mod12_6c and glc_6c.
These rates of agreement are similar to those obtained
by Iwao et al. [8] in their validation of Eurasian land
cover maps.
We used the 4211 DCP points to determined the rates
of agreement of each land cover map with DCP data for
six major climatic zones (tropical, arid, temperate, cold,
polar, and other) according to the Köppen-Geiger climate
classification map [14] (Table 2). Although our results
show that the agreement rate for MOD12 was higher
Table 1. Rates of agreement (%) between the global land
cover maps of this study with DCP-derived validation data
for six LULUCF land cover classe s.
LULUCF class
(Points) New MOD12 GLC2000UMD
Forest land 1166 79.5 78.2 73.2 66.7
Grassland 1250 35.4 36.4 31.5 43.8
Cropland 721 65.9 64.5 71.7 43.8
Wetland 378 86.8 83.6 82.8 85.7
Settlements 40 32.5 37.5 25.0 20.0
Other land 656 60.4 57.8 59.9 54.1
Overall agreements(%)
4211 61.3 60.4 58.9 55.2
Kappa Coefficient 0. 5 0.47 0.47 0.41
The integration and construction of SYNMAP included
data from the GLCC Data Base Version 2.0 (U.S. Geo-
logical Survey, Global land cover, 1999; available at
http://edcsns17.cr.usgs.gov/glcc/globdoc2_2.html) as well
as MOD12 and GLC2000. As a further test of our new
integration method, we also merged the data from
MOD12, GLC2000, and GLCC, and compared both the
output of this merged data set and GLCC data with DCP
validation points (Table 4). For GLCC, we used the
simplified IGBP class scheme (GLCC_sigbp) as a re-
placement for UMD_sigp of our previous integration.
The overall agreement rate for GLCC with 4211 DCP
validation points was 53.2% (Table 4), which is lower
than the three land cover maps we had already validated.
Table 2. Rates of agreement j(%) between the global land
cover maps of this study and DCP-derived validation data
for the six climatic zones of the Köppen-Geiger climate
classification scheme.
Köppen-Geiger
Class Points New MapMOD12 GLC2000UMD
Tropical 383 55.4(%)52.2 47.3 43.3
Arid 1360 54.9 56.4 54.8 47.3
Temperate 1007 58.4 54.4 56.0 53.6
Cold 1143 66.9 66.8 63.8 61.4
Polar 21 47.6 42.9 33.3 66.7
Other 297 87.2 85.2 85.5 87.5
Among the 4211 DCP points, there were 492 for
which the GLC2000_6c and UMD_6c classes agreed,
but disagreed with MOD12_6c. Among these 492 DCP
points, 218 agreed with UMD_6c classes. Further, DCP
data agreed with MOD12_6c class values at 178 data
points. So, at 40 DCP points, the new land cover map
integrated from MOD12, GLC2000, and UMD showed
Copyright © 2011 SciRes. JGIS
K. IWAO ET AL.
164
Table 3. Agreement pattern between the land cover maps of
this study with DCP-derived validation data for six LU-
LUCF land cover classes. F, Forest lands; G, Grasslands; C,
Croplands; W, Wetlands; U, Settlements; O, Other.
Table 4. Rates of agreement (%) between the combined
MOD12, GLC2000, and GLCC global land cover map and
GLCC alone with DCP-derived validation data for six
LULUCF land cover classes.
F G C W UO
F (1166points) 927 123 98 10 8 0
G (1250) 485 443 296 6 8 12
C (721) 111 122 475 4 5 4
W (378) 24 6 15 328 3 2
U (40) 5 5 15 2 130
O (656) 191 49 11 7 2 396
MOD12
F G C W UO
F 912 177 118 9 9 1
G 471 455 296 9 9 10
C 116 127 465 3 5 5
W 36 4 13 316 5 4
U 6 5 12 2 150
O 209 47 9 9 3 379
GLC2000
F G C W UO
F 853 119 168 20 4 2
G 440 394 372 10 7 27
C 118 78 517 4 1 3
W 27 13 20 313 0 5
U 6 5 19 0 100
O 82 150 22 8 1 393
UMD
F G C W UO
F 778 305 65 17 1 0
G 438 548 244 5 4 11
C 109 287 312 8 4 1
W 22 17 14 324 0 1
U 6 16 10 0 8 0
O 230 56 10 5 0 355
LULUCF class
(Points) New (MOD12,
GLC2000, GLCC) GLCC
Forest land 1166 79.1 67.4
Grassland 1250 29.9 23.4
Cropland 721 73.1 72.0
Wetland 378 84.9 83.9
settlements 40 30.0 27.5
Other land 656 57.5 48.2
Overall
agreements(%) 4211 60.2 53.2
ments than MOD12_6c did. As a result, the overall
agreement rate for MOD12, GLC2000 and GLCC with
the new combined map with 4211 DCP validation poin ts
was 60.2%, which is slightly lower than th at of MOD12.
These results suggest that the accuracy of the resultant
map produced by using our new method is very reliant
on the accuracy of the input land cover maps and does
not always provide improvement. DCP-derived valida-
tion information is indispensable for the assessment of
land cover maps.
Our results show statistically significant differences
between our new land cover map and both GLC2000 and
UMD, and also showed the improvement in kappa coef-
ficient, but no statistically significant difference between
our new land cover map and MOD12.
Several new land cover maps that can be usefully in-
tegrated to produce another DCP-validated land cover
are available such as Global Land Cover by National
Mapping Organizations (GLCNMO) produced by the
International Steering Committee for Global Mapping
(ISCGM) (available at http://www.iscgm.org/cgi-bin/fs-
wiki/wiki.cgi) and GlobCover Land Cover produced by
the European Space Agency (available at http://ionia1.
esrin.esa.int/index.asp).
4. Conclusions
We developed a new map integration method based on
the principle of favoring the majority view to produce a
new global land cover map by combining data from three
existing land cover maps. The method we have proposed
in this paper enables the combination of existing global
land cover maps based on different classification schemes
and provides a user-friendly map which utilizes an ex ist-
ing land cover classification scheme. We validated the
resultant map, and the individual maps merged to produce
it, by comparing them to 4211 terrestrial DCP-derived
better agreement rates than MOD12_6c.
There were a total of 523 DCP points for which
GLC2000_6c and GLCC_6c classes agreed, but dis-
agreed with MOD12_6c classes. Of these 523 DCP
points, 188 agreed with the GLCC_6c classes. Among
492 DCP points, 197 agreed with MOD12_6c classes. So,
at nine DCP points, the land cover map derived from-
MOD12, GLC2000, and GLCC showed fewer agree-
Copyright © 2011 SciRes. JGIS
K. IWAO ET AL.
Copyright © 2011 SciRes. JGIS
165
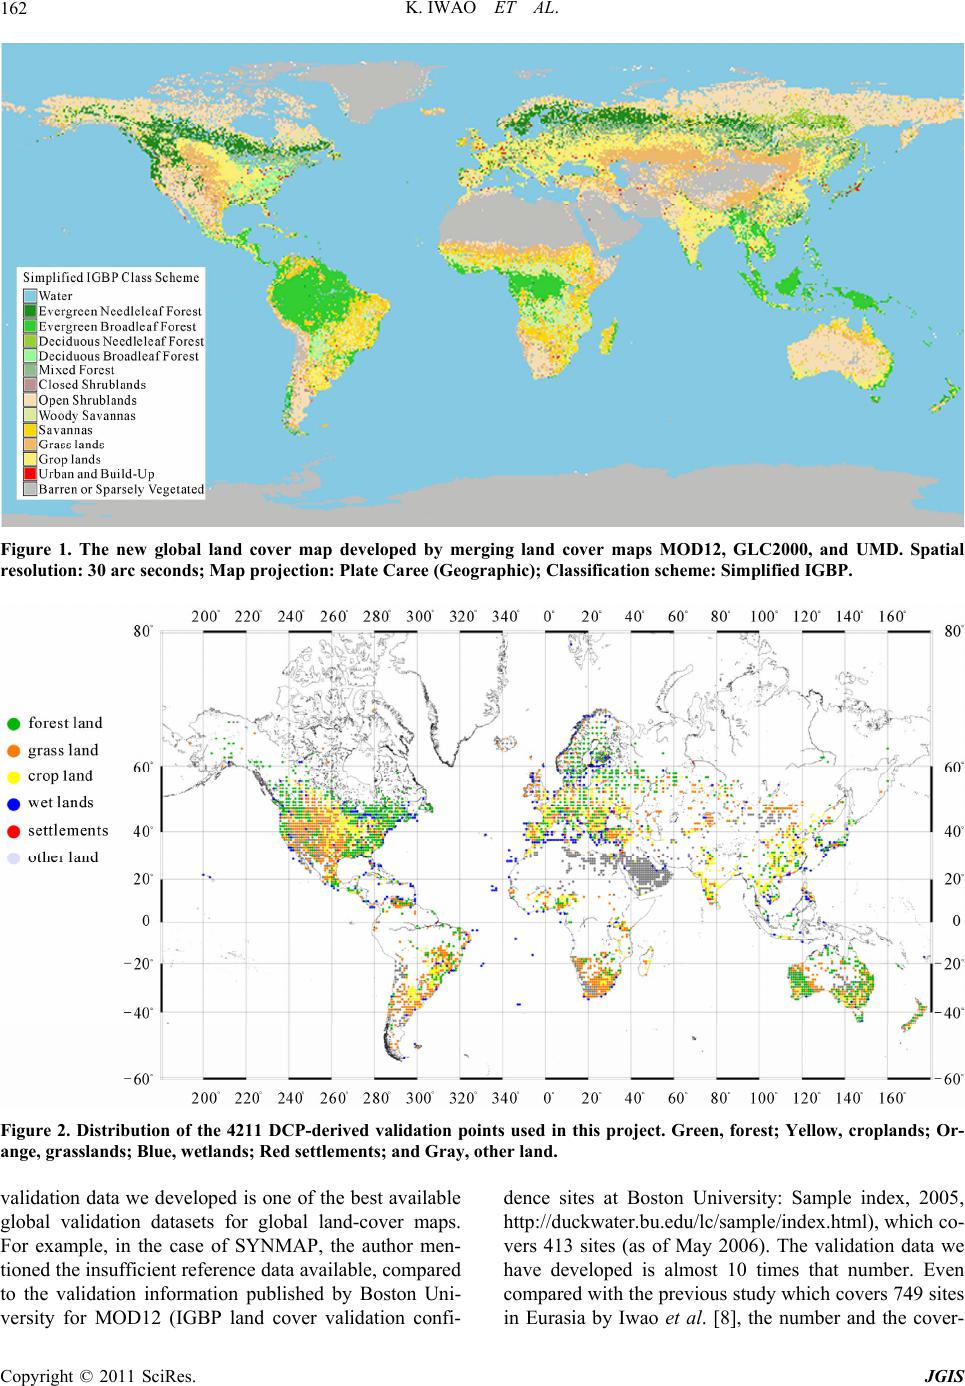
validation points worldwide. The validation data we h ave
developed is one of the best available land cover valida-
tion datasets based on field observations in terms of its
numbers and its distribution. The validation showed
agreement rates of 61.3% for the new land cover map,
60.4% for MOD12, 58.9% for GLC2000, 55.2% for
UMD, and 53.2% for GLCC which showed the same
tendency compared with the previous work applied for
Eurasia using 749 DCP-derived validation points. Our
analysis shows statistically significant differences be-
tween the new land cover map and both GLC2000 and
UMD. The agreements were improved in most of the
classes as well as major climate zones. Some existing
maps might overestimate specific classes such as an
overestimate of cropland in GLC2000, which might ap-
pear as high agreements. Also, our findings suggest that
further work is required to improve the classification
methodology for grassland as well as to clarify the defi-
nition of forest. Moreover, there is little DCP-derived
validation data for the polar zone. Because this zone is
vulnerable to the effects of global warming, much more
DCP-derived validation data is required. DCP-derived
validation data will be available in 2011 at the GEO Grid
(Global Earth Observation Grid). A map integration sys-
tem based on the principle of favoring the majority view
will also be available as a service at the website.
5. Acknowledgements
We acknowledge with gratitude funding support for this
study from the Global Environmental Research Fund of
the Ministry of the Environment of Japan (Study leader:
Takehisa Oikawa) under program S-1: Integrated Study
for Terrestrial Carbon Management of Asia in the 21st
Century Based on Scientific Advancements. We thank
the founder, organizers, and all particip an ts in th e Degree
Confluence Project. We also acknowledge ongoing sup-
port from the National Institute of Advanced Industrial
Science and Technology and the National Institute for
Environmental Studies.
6. References
[1] R. S. DeFries, C. B. Field, I. Fung, G. J. Collatz and L.
Bounoua, “Combining Satellite Data and Biogeochemical
Models to Estimate Global Effects of Human-Induced
Land Cover Change on Carbon Emissions and Primary
Productivity,” Global Biogeochemical Cycles, Vol. 13,
No. 3, 1999, pp. 803-815.
doi:10.1029/1999GB900037
[2] D. E. Ahl, S. T. Gower, D. S. Mackay, S. N. Burrows, J.
M. Norman and G. R. Diak, “The Effects of Aggregated
Land Cover Data on Estimating NPP in Northern Wis-
consin,” Remote Sensing of Environment,2005, Vol. 97,
pp. 1-14.
doi:10.1016/j.rse.2005.02.016
[3] T. Sasai, K. Ichii, Y. Yamaguchi and R. Nemani, “Simu-
lating Terrestrial Carbon Fluxes Using the New Bio-
sphere Model ‘Biosphere Model Integrating Eco-Physio-
logical and Mechanistic Approaches Using Satellite Data’
(BEAMS),” Journal of Geophysical Research, Vol. 110,
2005.
[4] M. Jung, H. Kathrin, H. Martin and C. Galina, “Exploit-
ing Synergies of Global Land Cover Products for Carbon
Cycle Modeling,” Remote Sensing of Environment, Vol.
101, 2006, pp. 534-553. doi:10.1016/j.rse.2006.01.020
[5] M. Obersteiner, G. Alexandrov, P. Benítez, I. McCallum,
F. Kraxner, K. Riahi, D. Rokityanskiy and Y. Yamagata,
“Global Supply of Biomass for Energy and Carbon Se-
questration from Afforestation/Reforestation Activities,”
Mitigation and Adaptation Strategies for Global Change,
Vol. 11, No. 5-6, 2006, pp. 1003-1021.
doi:10.1007/s11027-006-9031-z
[6] C. Giri, Z. Zhu and B. Reed, “A Comparative Analysis of
the Global Land Cover 2000 and MODIS Land Cover
Data Sets,” Remote Sensing of Environment, Vol. 94,
2005, pp. 123-132. doi:10.1016/j.rse.2004.09.005
[7] I. McCallum, M. Obersteiner, S. Nilsson and A. Shvi-
denko, “A Spatial Comparison of Four Satellite Derived 1
km Global Land Cover Datasets,” International Journal
of Applied Earth Observation and Geoinformation, Vol. 8,
No. 4, 2006, pp. 246-255.
doi:10.1016/j.jag.2005.12.002
[8] K. Iwao, K. Nishida, T. Kinoshita and Y. Yamagata,
“Validating Land Cover Maps with Degree Confluence
Project Information,” Geophysical Research Letters, Vol.
33, 2006.
[9] F. Fritz, I. McCallum, C. Schill, C. Perger, R. Grillmayer,
F. Achard, F. Kraxner and M. Obersteiner, “Geo-
Wiki.Org: The Use of Crowdsourcing to Improve Global
Land Cover,” Remote Sensing of Environment, Vol. 1,
2009, pp. 345-354.
[10] X. H. Liu, A. K. Skidmore and O. H. Van, “Integration of
Classification Methods for Improvement of Land-Cover
Map Accuracy,” The ISPRS Journal of Photogrammetry
and Remote Sensing, Vol. 56, 2002, pp. 257-268.
doi:10.1016/S0924-2716(02)00061-8
[11] M. Hansen, R. DeFries, J. R. G. Townshed and R. Sohl-
berg, “Global Land Cover Classification at 1km Resolu-
tion Using a Decision Tree Classifier,” International
Journal of Remote Sensing, Vol. 21, No. 6-7, 2000, pp.
1331-1365. doi:10.1080/014311600210209
[12] Intergovernmental Panel on Climate Chang, “Good Prac-
tice Guidance for Land Use, Land-Use Change, and For-
estry,” 2003.
[13] H. Sato and R. Tateishi, “The Review of a Global Land
Use, Land Cover, and Vegetation Classification System,”
Geogr. Surv. Inst. Japan Annu. Rep., 2001, Vol. 96, pp.
69-99.
[14] M. C. Peel, B. L. Finlayson and T. A. McMahon, “Up-
dated World Map of the Köppen-Geiger Climate Classi-
fication,” Hydrology and Earth System Sciences, Vol. 11,
No. 5, 2007, pp. 1633- 1644.
doi:10.5194/hess-11-1633-2007