Natural Science
Vol.07 No.01(2015), Article ID:53199,9 pages
10.4236/ns.2015.71004
Adaptation of Resilience against Disaster― Case Study of 2000 Tokai Flood and 2011 Flood in Shonai River, Japan
Marie Thomas, Makiko Obana, Tetsuro Tsujimoto
Department of Civil Engineering, Nagoya University, Nagoya, Japan
Email: ttsujimoto@genv.nagoya-u.ac.jp
Copyright © 2015 by authors and Scientific Research Publishing Inc.
This work is licensed under the Creative Commons Attribution International License (CC BY).
http://creativecommons.org/licenses/by/4.0/


Received 11 December 2014; accepted 21 December 2014; published 14 January 2015
ABSTRACT
In this study, the application of the resilience concept of the flood event depending on progress of the time is analyzed as the hazard occurrence, the disaster risk, the damage risk, and the evolution of the damages. Flood disaster is defined as the occurrence of an inundation in an exposed area. The human exposure (loss of life, injury, ・・・), structural (buildings, roads, ・・・) and functional (economic, political, ・・・ functions of an area) economic exposure cause high risk of damage if the area in which the hazard occurs is at low resilience. Furthermore the damage will increase without adequate response against disaster. The flood disaster risk is decreased by flood control measures, reducing structural and functional exposure. Non-structural measures, such as appropriate prior-evacuation, decrease the human exposure to flood disaster. This study reviews the events of 2000 and 2011 floods in the Shonai River basin in Japan to help assess resilience to flood disaster. These two events had the same type of hazards in intensity and location, allowing the study in terms of adaptation to flood disaster in the river basin to focus on the structural and nonstructural effort to increase resilience of the disaster depending on progress of the time.
Keywords:
Heavy Rainfall, Flood, Flood Mitigation, Evacuation, Hazard, Resilience, Risk Management

1. Introduction
Flood disaster is one of the major natural disasters around the world in terms of frequency, victims and economic losses [1] . Flood management and mitigation consisting in the establishment of structural measures in flood- prone areas such as levees setup to protect directly exposed areas, dams and retarding pond upstream to reduce the peak discharge of floods and so on, even if sometimes criticized [2] , not only are still up to date the only way of reducing the geographical impact of a hazard, but also are part of holistic the concept called “the modes of coping with natural hazard” of Burton et al. [3] . It is however true that structural measures have unpredicted impacts as the effect of a disaster in case of levee breach [4] or reduction of risk awareness; therefore, they should be complemented by non-structural measures to face potential levee breach and maintain risk knowledge.
The purpose of this research is to link conceptual research done during the past 30 years in social sciences on disaster management and applied previous hydrology with river hydraulic engineering. Because in social sciences there is no consensus on concepts meaning [5] [6] , it is necessary to define clearly what word will be used with what meaning.
Japan is known for its exposition to numerous hazards, and the high exposure of its population in megacities in deltaic floodplains. Continuous flood levees and flood control dams are characteristic and reasonably significant infrastructures for flood protection in Japan since the eighteenth century. But the rapid urban changes during the high economic growth era (1950-1980) had an influence on the lifestyle and the risk culture of urbanites changing the acceptation of risk and increasing people’s vulnerability to hazard.
From the above recognition of the topics, firstly in this paper we review the characteristics of floods in Japan simply; then we will present the definitions of several concepts used in this study to assess the adaptation to flood risk by increasing structural and non-structural measure to fight flood risk.
Then two floods in the Shonai River basin near Nagoya metropolis which affected unban activity are taken as examples to be investigated, based on the above scenario described by the fundamental concepts. Two floods occurred in the Shonai River basin in 2000 and 2011, and we analyze how the adaptation of resilience against flood disaster was achieved.
2. Flood Disasters in Japan
Japan stretches from the south west to the north east, and mountains higher than 2000 m form a backbone which brings short and steep rivers with rapid runoff. It is located at the west of the Pacific Ocean (see Figure 1), and is exposed to typhoons and characteristic fronts which bring heavy torrential downpours in summer and autumn. Such conditions cause serious floods. Population and human activities are concentrated in limited alluvial plains, where floods with large discharge threat them. Alluvial plains are protected against river floods by continuous flood levees additionally with flood control by dams reducing peak discharge. Such infrastructures against floods have been improved with gradual river improvement projects based on the master plan and concentrated efforts especially after flood disasters. Actually we have experienced a lot of flood disasters in alluvial plains where inundations due to levee breaches have caused serious damage in human life and activities. We have also experienced disasters in mountain area where debris flows have caused serious losses of life and properties, but this category of flood is not dealt with in this paper.
The safety level of the river improvement is measured by the return period of flood discharge which is related to the accumulated rainfall of the river basin for one event. In Japan, the duration of a flood (rainfall) is 1 - 3 days. The discharge is related to the return period, and the safety level is measured whether corresponding discharge can be safely conveyed within the flood levees considering the free board. In other words, if the flood stage exceeds the “high water level” (HWL, the elevation of the top of the levee minus the free board), the chances of a flood disaster (inundation due to levee breach) is increasing (hypothesis in flood mitigation planning). The return period of the maximum discharge which can be safely conveyed within the levees indicates the

Figure 1. Map of Japan.
safety level of the river or the floodplain of that river. At present in Japan, each river has the master plan which must be completed within 30 years, though we have higher safety level as project.
Japan has a disadvantage against floods because the population and human activities are concentrated in lowland floodplain, therefore sometimes the floodplain protected by levees is lower than the river bed. Furthermore under poor river improvement conditions, the flood risk is extremely higher against the possible hazard which must be measured by the flood discharge or the accumulated rainfall in a river basin for an event. Poorly prepared river means not only one with insufficient levees but also with insufficient cross section (higher bed level and river with higher hydraulic resistance). Previously, inundations were frequently occurring due to poor achievement of levee construction and higher bed level (poorly dredged), but inhabitants were ready to protect their daily lives by several strategies recognized as non-structural measures: living in higher lands, small-scale ring levees surrounding homes or villages and evacuation on flooding.
Recently, river improvement has been advanced though it has not reached the master plan level. Because of accumulation of flood protection infrastructures, the decreasing trend of the number of casualties has been achieved from a few thousand to a few dozen during this half century. However, the recent problems exist on the casualties due to insufficient strategy of evacuation once inundation is occurred. The river improvement is still undergoing (under the master plan level), non-structural measures are needed to reduce the risk of disaster once the hazard exceeds the mitigation measures (inundation). In order to reduce the risk of damage by flood, human activities would avoid those in the lower area. However, on the urban development process, population and human activities have expanded to the extremely risky areas because of the lower price of land. Furthermore, non-structural measures have not very effective (low evacuation rates) because inhabitants in flood plains had less experience of inundation and their life style has been extremely changed. We have to devise new system to operate such non-structural measures even in modern society.
3. Concepts Employed in Discussion of Flood Disaster
Though some concepts necessary in discussion of flood mitigation were already employed in the previous chapter, they are carefully defined in the following (see Figure 2) in order to make the further discussions clear. The concepts to be discussed here are “hazard”, “disaster risk”, “exposure”, “damage risk”, and “resilience” and/or “vulnerability” for the discussion on flood disaster in a floodplain with particular reference to examples in Japan.
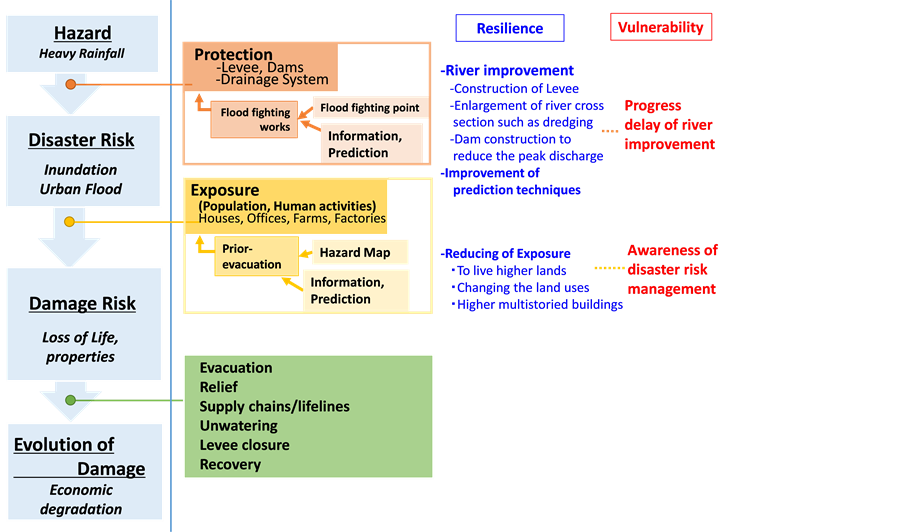
Figure 2. Some concepts employed in discussion of flood disaster.
“Hazard” is defined as “the manifestation of a natural or human originated phenomenon with uncertain but supposed extreme intensity and/or very low occurrence potentiality”, in our flood case it is the discharge in a river which may cause a “disaster risk”. Discharge is brought by accumulated rainfall of a river basin because duration of one-event heavy rainfall and its runoff into a river are in the same order in Japan and within a few days. If the water stage due to the discharge hydrograph exceeds the safety level (HWL = “high water level”) of the flood levee, the risk of flood “disaster” becomes extremely high. “Disaster” is defined as “the occurrence of a hazard exceeding the mitigation-structural measures―and preparedness-nonstructural measures setup up to this time to prevent disaster, therefore causing structural, functional and human damages to the exposed areas”. In our case, the flood disaster can be caused by levee overtopping or levee breach. Simply saying, the risk of flood is determined by the comparison between forthcoming flood discharge and the “protection level” (height of levee and height of river bed level). In order to reduce the risk of flood disaster, river improvement (flood protection) should be done (construction of levee, enlargement of river cross section such as dredging, and dam construction to reduce the peak discharge). Due to the megacity environment of our study field, it has to be remembered that one hazard causing a disaster (levee overtopping) can also occasion events increasing the original disaster (shortage in electricity, inability to reach persons in danger・・・) therefore preparedness (nonstructural measures setup) like prior evacuation, risk culture maintenance, real-time information dispatch are needed.
When inundation (flood disaster) occurs, “damage”: human, functional and structural losses and disturbances is related to the “exposure”: human structural and functional activities located in areas where a hazard can be expected. Reducing the exposure must be done by structural (reducing the hazard-prone area) and non-structural measures (maintain activities, functions and preserve human life) to reduce the risk of damage. Prior-evacuation is a strategy to reduce temporarily the human exposure in addition to land use change and building surrounding dikes. In modern urbanized area where life style has been changed, we have to construct a system to assist a strategic prior-evacuation with proper information and alert and to support the shelters.
Furthermore, we have to consider how to reduce the evolution of damage, and it requires rapid recover and restoration. For the time being, the areas of human activities in floodplains particularly in urbanized area are vulnerable (inability to cope with a disaster) against flood disaster and the subsequent damages. In order to overcome such vulnerability or to increase resilience (ability to prepare for, cope with, and recover from a disaster) against flood disaster and the subsequent damages, we have to prepare firstly structural measures (flood management infrastructures) to reduce the structural and functional exposure (inundation), then the nonstructural measures to reduce the human exposure against damages by inundation, and furthermore the disaster management system has to support rapid recover and restoration to reduce the expansion of damages.
4. Tokai Heavy Rainfall Disaster in 2000 and Shonai River Flood in 2011
4.1. Shonai River Basin and Nagoya City
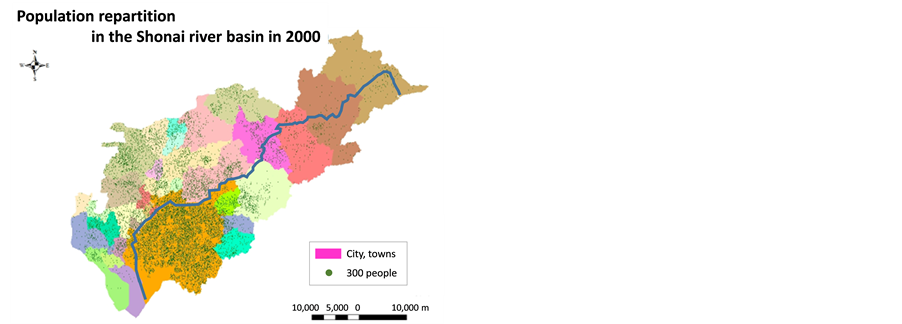
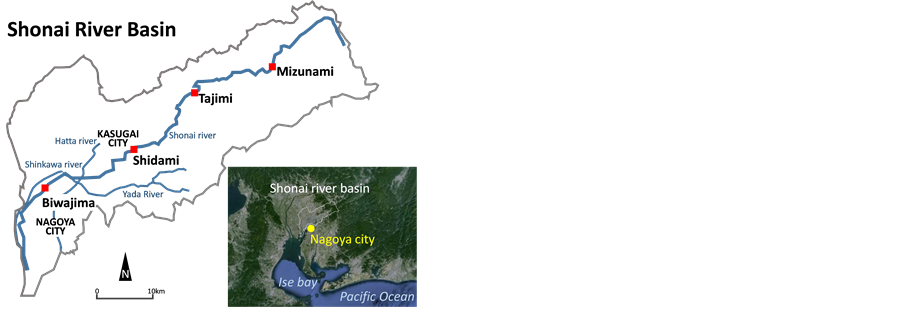
The Shonai River basin is located in the center of Japan (see Figure 1 and Figure 3(a)). The total length of Shonai River is 96 km and the area of its river basin is 1010 km2. There are 17 municipalities in this river basin. The lower reach (0 - 35 km) flows in an alluvial plain, and Nagoya metropolitan is located in this area where the main central function such as industries, economies and transportation system and the population are concentrated. The population in this river basin is about 4.3 million, and more than 3.9 million is concentrated in the lower reach including in Nagoya and Kasugai cities (see Figure 3(b)). The site of Shidami (34 km from the river mouth) and Biwajima (lower reach, 14.5 km from the river mouth) is selected as the reference site of river master plan.
4.2. Heavy Rainfall Events in 2000 (Tokai Heavy Rainfall Disaster)
In September 2000, we experienced a severe flood disaster in Nagoya metropolitan area. The heavy torrential downpour recorded 100 mm within an hour at Nagoya meteorological observatory and the accumulated rainfall of the Shonai River basin exceeded 500 mm, then the peak discharge of the Shonai River exceeded the capacity at that time. The safety level of the river reached at most the level with return period of 30 years in those days. Hence, the water stage along the river exceeded HWL, several levee breaches occurred and the most serious one was a levee breach in “Shinkawa River,” a tributary (diversion) of the Shonai River in northern Nagoya. In addition, because of insufficient urban drainage, a wide area was seriously inundated. Insufficient urban drainage
 (a) (b)
Figure 3. (a) Shonai River basin; (b) Population distribution map in the Shonai River basin in 2000.
was caused not only by limited capacity of pumping but also by stopping pumps mechanically by inundation and institutionally because of higher river stage at the outlet of drainage.
The casualties were fortunately few (less than 10 casualties in the Shonai River basin), but the economic loss due to this disaster reached 70 billion yen (US $7 billion) and around 90% was from general economic activities (not related to public works loss). There were a lot of inhabitants and small factories in lowland area near the river, which were seriously affected.
In addition, various damages were focused on related to daily urban activities not only in seriously inundated area but also even in not-inundated area. In particular, inundated water invaded into the subway facilities (stations and railways) and metropolitan functions were paralyzed. Needless to say, the transportation failure is serious in daily life and economic activities particularly in urban area and the flood caused the Japanese bullet train to stop, causing communication problems between the two major cities of Japan, increasing the scale of the disaster’s consequence at national level. Not only transportation, sewage system were damaged. In general, serious inundation brings paralysis of life lines such as water supply, energy (electricity and city gas) and telecom. Because of inundation and subsequent damage of lifelines, many people required refuges and could not return to their houses and offices for several days. Furthermore the garbage treatment problem after inundation was serious. Nagoya metropolis area had a serious issue to look for garbage dump area even before the disaster, and in addition they had to treat large amount of garbage due to inundation disaster. In particular, electric products such as refrigerators and computers, cars, and furniture such as tatami mats and so on could not be reused after inundation and they were bulky and heavy to deal with, slowing the recovery period after the disaster.
Some areas were inundated because of insufficient urban drainage system, but some of them were caused by insufficient river improvement because the pumping from the sewage system to the river was not allowed when the water stage exceeds the limit. During Tokai flood, however, some levee breaches occurred and some inhabitants doubted illegal release from the pumps after the water stage exceeded HWL.
4.3. Resilience Adaptation after Tokai Flood
The Tokai flood in 2000, helped to recognize the vulnerability of this, and river improvements have been undertook using the framework of “special recovering project against serious disaster” and the successive planned river improvement according to the master plan. The former is the framework to repair and improve infrastructure to avoid the disaster due to the hazard of the same pattern then the previous (Tokai flood) disaster which has been done during the 5 following years (2001-2006). This project was realized on the Shonai River and its tributary the Shinkawa River, and for the Tenpaku River (another river system in Nagoya metropolis). This project consisted of the expansion of the cross section of the river to keep the capacity of flood passing by river-bed dredging and the strengthening of the levee (seepage protection against levee breach). The expected return period for structural measures was increased and the Shonai River has now the protection ability against the level of Tokai flood. After Tokai flood after finishing the special project, the master plan project understanding successive river improvements to aim the level of 50 years return period was undertook and should be completed within 30 years.
In addition to the structural measures (flood protection), the non-structural measures have been discussed. The effective way is reducing the exposure to the risk of inundation. The targeted project was to improve prior- evacuation, and firstly the proper information system has been improved at all levels of the disaster management system. First, the river manager made an “inundation map for design flood” (prediction for 200 years return period flood intensity, which are more severe than the master plan level) and provide it to the city disaster managers in charge of evacuation, and then the city made a “hazard map” distributed it to the inhabitants to show individuals inundation to expect and evacuation information at the community level. Then the inhabitants can acknowledge the hazardous area for flood risk, and can recognize the risk of inundation with successive damages for each forthcoming event and take necessary pre-evacuation measures (information provided on pre-evacua- tion measures by the city with the hazard map). Some of the inhabitants can evacuate based on the information on real time weather and river (available on the Shonai River Bureau website) and with the “hazard map”. And the suggestions of the timing of prior-evacuation will help inhabitants who may not start actions without incentive.
The evacuation suggestion (advice) or order (obligation to evacuate) is issued from the community head (mayor), for whom it is generally difficult to judge the proper timing of evacuation with insufficient information on rivers and knowledge on inundation processes. They often hesitate to issue such orders, therefore, in order to avoid the situation of delayed evacuation suggestion, the process was systematized as follows: The river manager provides the information not only for the real time data on the river (water stage) but also their forecast. Then, the standardized process to judge the timing of evacuation with necessary procedures in the community (municipality) was discussed and the framework of the risk management system (information of river data from the river manager and suggested tasks of community) was established as shown in Figure 4. This figure shows timeline for the river manager which may help community to issue evacuation suggestion or commend.
Next, the information from the community to the inhabitants should be improved. In this area, a system was constructed through mobile-phone mail system to send automatically necessary information for emergency. Then, a necessary issue is the promotion for the inhabitants to carry out prior-evacuation (education and training). The system to support evacuees on the way of evacuation and in the refuges should be improved too. At the present time, the community cannot deal with all the evacuees properly.
4.4. Shonai River Flood in 2011 Compared with Tokai Flood in 2000
In September 2011, 11 years later after the Tokai flood, heavy rainfall stroke the Shonai River basin again and the peak discharge of flood along the Shonai River was almost same to each other (design flood level of the master plan). Figure 5 shows the weather maps for those events for comparison, and it is recognized that the weather conditions are very similar to each other where the typhoon existed on the south east of Kyushu island and the front expanded from the vicinity of the typhoon to the north east. Rainfalls within an hour were near 100 mm and accumulated rainfalls reached around 500 mm, though highest intensity of the hazard was slightly different for the two events. Heavy rainfall concentrated near Nagoya city in 2000 while it concentrated near Shidami in the middle reach of the Shonai River as shown in Figure 6.
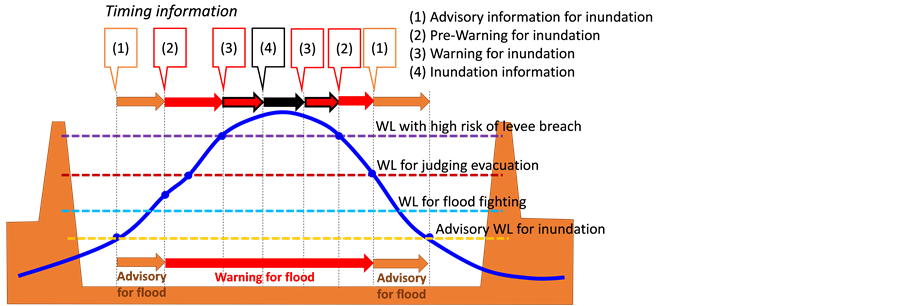
Figure 4. Timeline of timing information for river manager in stage hydrograph.
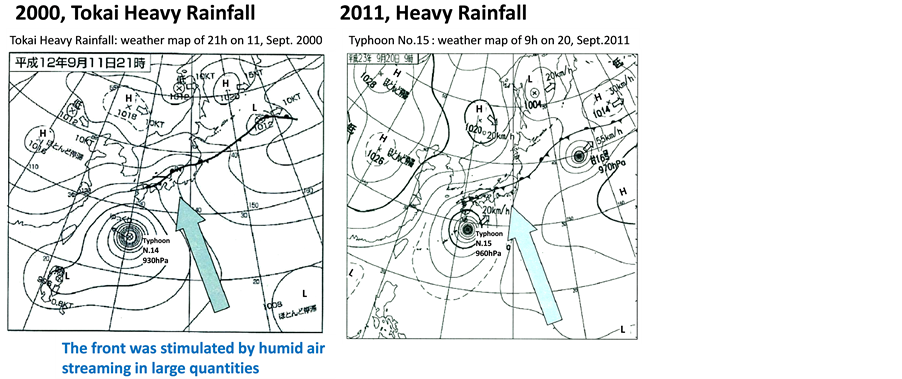
Figure 5. Weather maps for 2000 and 2011 of heavy rainfall.
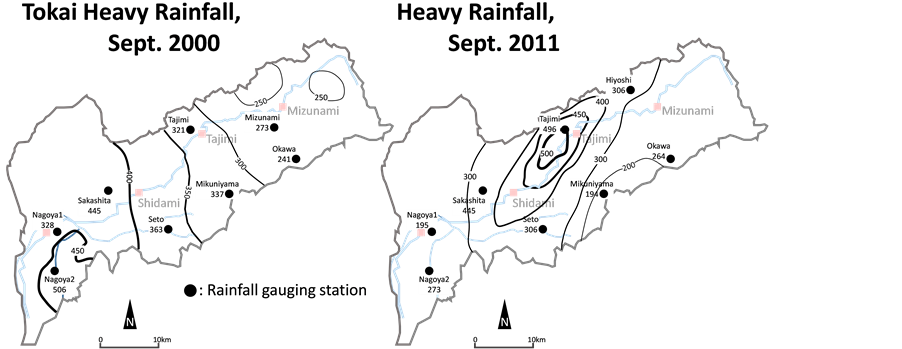
Figure 6. Spatial distribution of accumulated rainfalls for 2000 and 2011 rainfalls.
The observed peak discharges were almost the same on the both events and it was around the designed flood discharge (3500 m3/s). As seen in Figure 7 (comparison of the stage hydrographs between 2000 and 2011 floods), the peak stage at Shidami (middle reach) for 2011 flood was higher than the one for 2000 flood, but the peak stage at Biwajima was lower. In addition, the duration time of flood in 2011 was shorter than that in 2000.
We would say that the flood (heavy rainfall) in 2011 was the same level of “hazard” with that in 2000 though there were slight differences. In particular the spatial difference brought a great difference in exposure. The lower reach of the Shonai River where the 2000 flood occurred is a highly metropolitan exposed flood plain area with much more population and economic activities than the middle reach where the 2011 flood occurred.
4.5. Assessment of Resilience Adaptation after Tokai Flood
Because of the advancement of river improvement by the special project after 2000 flood and the successive river improvement according to the master plan, the impact of the hazard (inundation) were quite different from each other. The “disaster risk” is suggested by comparing the flood stage along the river with HWL. Figure 8 shows the longitudinal profiles of HWL with flood marks (peak water stage) for 2000 and 2011 floods. When the floods in 2000 and 2011 are compared with each other in this figure, in the lower reach the water stage in 2011 was obviously lower and it exceeded HWL nowhere though being almost the same discharge flow there. This was caused mainly by the result of the special project after 2000 flood. The hazard being contained by structural measures, the lower reach didn’t suffer any disaster, while in the middle reach near Shidami, the flood marks were higher than those in 2000 and exceeded HWL in some places. In Shidami district, the over flow
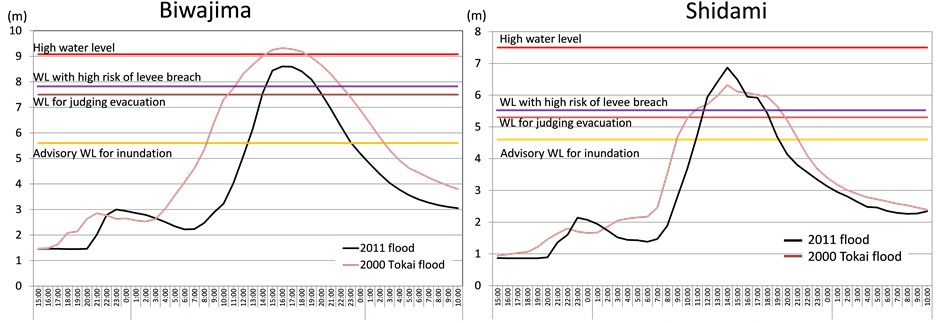
Figure 7. The stage hydrographs at Biwajima and Shidami for 2000 and 2011 floods (time axes set for the peaks to be the same).
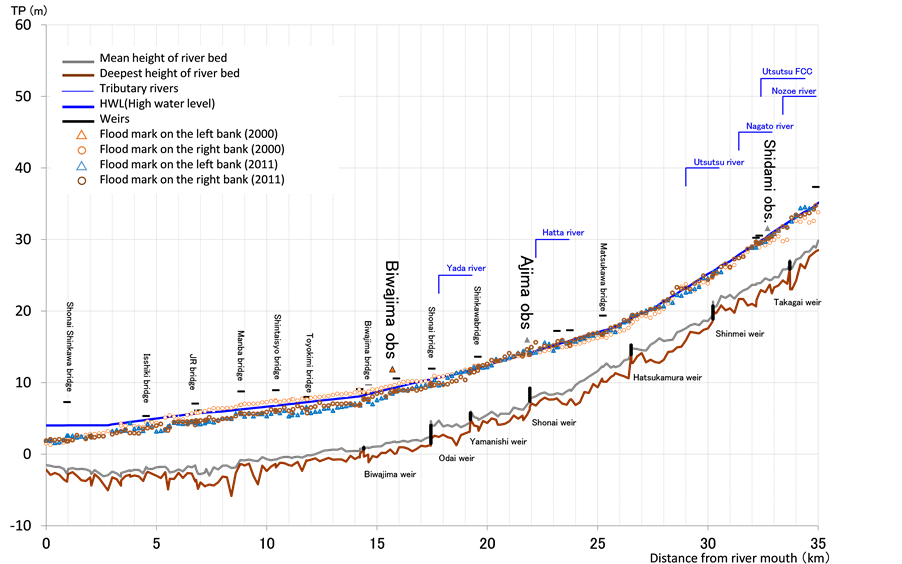
Figure 8. The longitudinal profiles of HWL with flood marks for 2000 and 2011 floods.
occurred to cause successive inundation (and high risk of levee breach to be accompanied with flood fighting activities), and higher stage of the river disturbed the drainage activity from the areas along the river (Tajimi and Kasugai cities).
The special project for 2000 flood was concentrated only in the lower reach, and even the successive river improvement according to the master plan has been progressed from the downstream. The project of the expansion of the cross section is an improvement that has to be realized progressing from the downstream from the viewpoint of hydraulic influence.
In addition, the concentration of rainfall in the middle reach in 2011 brought the rapid runoff with sharp hydrograph in the middle reach. Furthermore, it might be guessed that bed morphological change was promoted by the 2000 flood’s propagation and the vegetation invasion increased the hydraulic resistance leading to higher water stage consequences. It is reasonable to expect river improvement to progress from the downstream but we have to take care of the maintenance of river bed and vegetation even in the upstream reach.
In 2011 flood, higher water stage in the middle reach brought the higher downstream condition for the flood in the tributaries. Particularly along the Hatta River, a tributary of the Shonai River, on which a levee overtopping occurred, caused serious inundation with poor drainage, and the inhabitants along this river were seriously threatened by extremely high risk of levee breach (see Figure 9).
Because fortunately no obvious levee breaches occurred, the disaster was not serious. However from the viewpoint of risk management, comparatively large area of the river basin area was threatened by flood risk because the water stage exceeded HWL at several points along the middle reach of the Shonai River and its tributaries. After 2000 flood, the citizen was presumed to know the hazard map. The information of the water stage of the river was supplied to the municipalities from the river manager with its forecast, and the municipalities behaved almost exactly as expected to the presumed scenario (the standard was already shown by Figure 4) as shown in Figure 10.
In 2011, Nagoya mayor issued “evacuation recommendation” smoothly according to the aforementioned framework, and the number of targeted inhabitants was more than a million (1,095,204). The newspaper on the next day commented comparatively favorably. However, actually only 4394 peoples (around 0.4%) followed the suggestions to evacuate. In 2000, the prior evacuation was not suggested though 32,155 peoples finally evacuated. While, on the heavy rainfall in 2008, based on the standard framework, Nagoya city issued the evacuation recommendation to 360,000 peoples. Then, already the standard format for issuing recommendation was functioning but the number of peoples who evacuated was only 375 (0.1%). Because of the development of area mailing service for alert through mobile phones have been developed and became popular, the ratio of the evacuation has increased gradually. On 2011 flood, prior-evacuation was recommended at appropriate timing based on smooth process for issuing evacuation recommendation, but the following remains to be discussed: 1) Are the inhabitants targeted for evacuation reasonable, and if not how can we explain lack of interest in evacuation in order to fix the problem? 2) Are the communities ready to accept and support such number of evacuee?
According to the present manual, the target of evacuation recommendation is all inhabitants in the administrative districts parts of which may be inundated, and thus all of them are not necessary to evacuate. The inhabitants
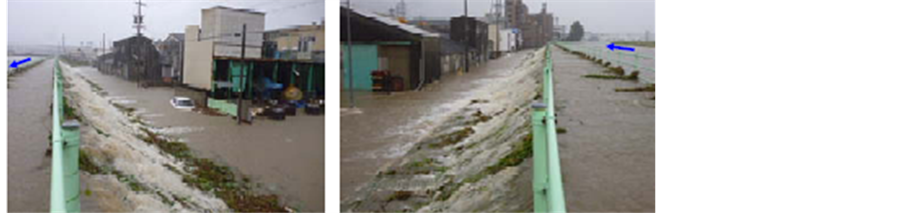
Figure 9. Overflowing from top of the levee in Hatta River.

Figure 10. The presumed scenario of timing information and action for river manager.
can recognize whether it is necessary to evacuate or not if they consult the hazard map, but only a few people will evacuate if they know not all are required to evacuate. Moreover, hazard map is based on an inundation map where inundated areas for some scenarios with different breaching points are overlaid, and it may include the area to be inundated later after the beginning of inundation (breach of the levee). In other words, nobody recognize the exact numbers of inhabitants necessary to evacuate.
On the other hand, the support for evacuees is not well prepared. The refuges or the shelters have less capacity compared with numbers of evacuees, while nobody has checked the exact number of evacuees.
5. Conclusions
In this study, we focused on the floods due to heavy rainfalls in Shonai River basin in 2000 and 2011, which were caused by hazards that could almost match the actual master plan projected structural measures improvements. Nagoya metropolis, the 4th largest city, exists on the Shonai River basin, and the floods threatened the urban functions both at local and national scale.
The research was conducted in the framework constituted by the following concepts: “hazard”, “disaster risk”, “exposure”, “damage risk”, “mitigation” as structural measures against flood, “preparedness” as non-structural measures mitigate the damages by flood, and “resilience” and/or “vulnerability” from more integrated viewpoints including prevention, coping, repair and restoration abilities. We clearly defined those concepts for floods in Japan. Based on these concepts, the two floods were investigated with particular reference of resilience adaptation after 2000 flood, and finally the remaining problems were pointed out.
Acknowledgements
The authors would show sincere gratitude to the Regional Bureau of MLIT (ministry of land, infrastructure, transportation and tourism), Shonai River Office and Nagoya Municipal Office for their efforts to collect and publicize data for floods in 2000 and 2011 and valuable discussion with them.
References
- Jonkman, S.N. (2005) Global Perspectives on Loss of Human Life Caused by Floods. Natural Hazards, 34, 151-175. http://dx.doi.org/10.1007/s11069-004-8891-3
- Dauphiné, A. and Provitolo, D. (2007) La résilience: Un concept pour la gestion des risques. Annales de Géographie, 654, 115-125. http://dx.doi.org/10.3917/ag.654.0115
- Burton, I., Kates, R.W. and White, G.F. (1978) The Environment as Hazard. Oxford University Press, New York.
- White, G.F., Calef, W.C., Hudson, J.W., Mayer, H.M., Schaeffer, J.R. and Volk, D.J. (1958) Changes in Urban Occupance of Flood Plains in the United States. Department of Geography Research Papers, 57.
- Gallopin, C.G. (2006) Linkages between Vulnerability, Resilience, and Adaptive Capacity. Global Environmental Change, 16, 293-303. http://dx.doi.org/10.1016/j.gloenvcha.2006.02.004
- Thomas, M. and Tsujimoto, T. (2012) Vulnerability to Flood Risk in Japanese Urban Areas: Crisis Management and Emergency Response in Nagoya, for an Efficient Evacuation Management. WIT Transaction on Ecology and the Environment, Flood Recovery and Response IV, 184, 61-71.