Applied Mathematics
Vol.4 No.3(2013), Article ID:28845,4 pages DOI:10.4236/am.2013.43066
The q-Exponential Social Discounting Functions of Gain and Loss
Department of Behavioral Science, Faculty of Letters, Hokkaido University, Sapporo, Japan
Email: taikitakahashi@gmail.com
Received November 29, 2012; revised January 18, 2013; accepted January 26, 2013
Keywords: Social Discounting; Altruism; Neuroeconomics; Econophysics; Sociophysics; Tsallis’ Statistics
ABSTRACT
Social discounting has been attracting attention in behavioral psychology, econophysics, and neuroeconomics. Several mathematical models have been proposed for social discounting; exponential discounting, hyperbolic discounting, a q-exponential discounting model based on Tsallis’ statistics. In order to experimentally examine the mathematical characteristics of the q-exponential social discounting models for gain and loss in humans, we estimated the parameters of the q-exponential social discounting models by assessing the points of subjective equality (indifference points) at seven social distances. We observed that gain was more steeply social-discounted than loss. Usefulness of the q-exponential social discounting model in social physics, econophysics, and cultural neuroeconomics are discussed.
1. Introduction
Applications of mathematical functions originally developed in mathematical and statistical physics to social sciences such as behavioral economics and neuroeconomics have been attracting attention [1-13]. These applications have started to elucidate anomalous human behaviors such as irrationality in individual decision making (e.g., hyperbolic temporal discounting [14] and altruism [11]).
A human social discount function measures the value to a person of a reward to another person at a given social distance [11,15,16]. Social discounting as a function of social distance’s effect on value of a reward was experimentally investigated [15,16]. For mathematically modeling social discounting behavior, several models were proposed: exponential discounting [15,16]; hyperbolic discounting [15,16], and q-exponential discounting [11]. The exponential social discounting model [15] is:
 , (1)
, (1)
where V(N) is a subjective value of a reward which another person at social distance N receives and  is an exponential social discount rate (:=
 ). The exponential social discount rate is constant across social distance. The hyperbolic social discounting model [15] is:
 , (2)
, (2)
where V(N) is a subjective value of a reward which another person at social distance N receives and  is a hyperbolic social discount rate (:=
 ) at social distance N = 0. The hyperbolic social discount rate is a decreasing function of social distance N. [15] and [16] reported that American subjects social-discounted monetary gain hyperbolically, rather than exponentially.
In order to generalize and unify these social discounting models, [11] proposed the q-exponential social discounting model based on deformed algebra developed in Tsallis’ statistics. The q-exponential social discounting model [11] is:
 , (3)
, (3)
where V(N) is a subjective value of a reward which another person at social distance N receives,  is a q-exponential social discount rate (:=
 ) at social distance N = 0, and 1 – q indicates the deviation of subject’s social discounting from exponential discounting. Namely, when q = 0, Equation (3) is equivalent to Equation (2), and when
 , Equation (3) is equivalent to Equation (1). Therefore, it can be said that q < 1 indicates the degree of interpersonal inconsistency in social choice. Note that larger social discount rates indicate stronger selfishness (weak generosity). Although the q-exponential function has been developed no study to date experimentally determined parameters in the q-exponential discounting model (Equation (3)), which is one of the objectives of the present study.
Studies in temporal discounting have revealed that gain is more steeply discounted than loss which is referred to as “sign effect” [13,17,18]. However, to date, no study examined social discounting of loss. Social discounting of loss is a measure of psychological tendency for allocation of social cost among people. Our present study is the first to experimentally examine social discounting behavior in the loss domain. Furthermore, there are cultural differences in temporal and probability discounting [10,19], indicating the importance of examining social discounting behavior by culturally different subjects from North Americans. The present study experimentally determined parameters in the q-exponential social discounting model (as well as exponential and hyperbolic social discounting models) for gain and loss in Japanese subjects.
2. Method
2.1. Participants
Twenty-six (13 male and 13 female, aged 20 - 21 years old) volunteers at Hokkaido University participated in the experiment. They conducted social discounting tasks for gain and loss, for their parameters of social discounting models to be estimated.
2.2. Procedure
We utilized similar experimental procedures as [16] in the social discounting tasks. We also conducted a social discounting task for loss, in addition to for gain. Firstly, participants were seated individually in a quiet room, and face the experimenter across a table. After that, participants received the simple instruction that the monetary gain and loss in this experiment were hypothetical, but the experimenter wanted you to think as though it were real money. In order to elicit the perception of other subjects at various social distances, the participants were instructed as:
The following experiment asks you to imagine that you have made a list of the 100 people closest to you in the world ranging from your dearest friend or relative at position #1 to a mere acquaintance at #100. The person at number one would be someone you know well and is your closest friend or relative. The person at #100 might be someone you recognize and encounter but perhaps you may not even know their name. You do not have to physically create the list—just imagine that you have done so.
Next you will be asked to make a series of judgments based on your preferences. On each line you will be asked if you would prefer to receive an amount of money for yourself versus an amount of money for the person listed. Please circle A or B for each line.
The A-column listed 9 amounts decrementing by \1000 (about US$10) on each line between \8500 and \500. The money amounts decreased from \8500 to \500 as above in the descending condition; while the order was reversed in the ascending condition. Column-B differed on each page by social distance [N]. The seven social distances were: 1, 2, 5, 10, 20, 50, and 100. On each line, participants were asked to choose between an amount of money for themselves and \7500 for Person-N. Crossover points were obtained for each participant at each tested N-value. The crossover point was estimated as the average of the last selfish (Column-A) choice and the first generous (Column-B) choice. Finally, the indifference point (a subjective value of the reward which another person at social distance N receives, i.e., V(N) in Equations (1)-(3)) is computed as the average of the crossover points in the descending and ascending conditions. It is to be noted that for the social discounting task for loss, monetary rewards above were replaced with monetary loss (i.e., taking money away from person N).
2.3. Data Analysis
The analytical strategy of statistical procedures in the present study was similar to that in our previous studies on intertemporal choice models [3-7,10,13,14]. We fitted the three types of the social discount model equations (i.e. Equations (1)-(3)) to the behavioral data of indifference points with the Gauss-Newton algorithm (R statistical language, non-linear modeling package), and the fitness of each equation was estimated with AIC (Akaike Information Criterion) values, which is the most standard criterion for the fitness of mathematical model to observed data, following previous studies [3-7,10,14]. It is to be noted that smaller AIC values correspond to better fitting (better fitting in terms of smaller AIC indicates a better tradeoff between overfitting and poor fitting). For the estimation of parameters in the social discounting models, we did not fix V(0) (i.e., V(0) was also estimated from behavioral data), following previous studies on social discounting [15,16]. All statistical procedures were conducted with R statistical language (The R Project for Statistical Computing).
3. Results
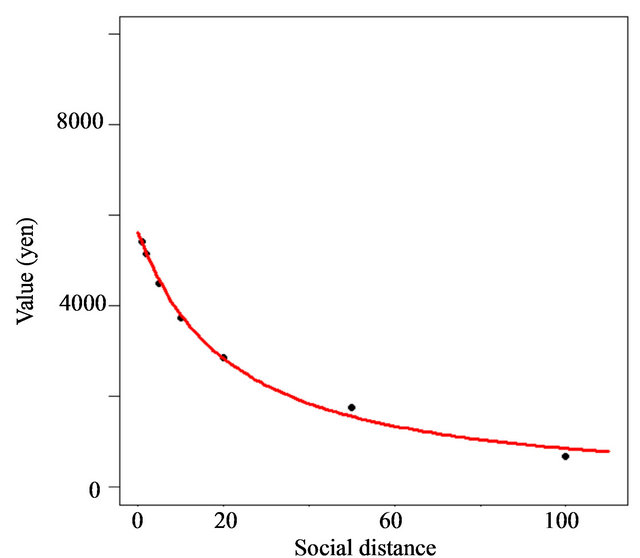
First, we estimated the parameters in the three types of social discounting models by fitting the three types of equations (Equations (1)-(3)) to group median data of the indifference points at the social distances. The fitted qexponential social discount curves were drawn in Figure 1(a) for gain and Figure 1(b) for loss. After fitting each model to the group data, we calculated AIC with best-fit parameters as an index of fitness (see Table 1 for estimated parameters and AICs). The orders of the AICs for
 (a)
(a) (b)
(b)
Figure 1. The q-exponential social discounting of gain (a) and loss (b). The horizontal axis is social distance and the vertical axis is subjective value of outcome which person at the social distance receives (a) or pays (b).
Table 1. Parameters and AIC (Akaike Information Criterion) for social discounting models for gain and loss.

Note that smaller AIC indicates better fitting. Note that smaller AIC indicates better fitting. For social discounting of gain, the orders of goodness-of-fit was [Hyperbolic > q-Exponential > Exponential]; while for loss [q-Exponential > Hyperbolic > Exponential].
group data were [Exponential discounting > q-exponential discounting > hyperbolic discounting] for social discounting of gain; while [Exponential discounting > hyperbolic discounting > q-exponential discounting] for social discounting of loss (note that smaller AIC corresponds to better fitting). The q-exponential social discounting model (Equation (3)) best fitted the behavioral data of social discounting of loss; while the hyperbolic social discounting (Equation (2)) best fitted the behavioral data of social discounting of gain. In both gain and loss, social discounting was more interpersonal-inconsistent than exponential discounting (i.e., q < 1). Furthermore, as can be seen from Figure 1, gain was more steeply social-discounted than loss at large social distances.
4. Discussion
To our knowledge, this study is the first to experimentally examine social discounting behavior for gain and loss, by utilizing the q-exponential discounting model based on deformed algebra developed in Tsallis’ thermostatistics. Our results demonstrated that the q-exponential models were characterized q values smaller than 1 for both gain and loss, indicating interpersonal inconsistency in human social choice, irrespective of the sign of social outcomes. Moreover, it was revealed that social loss is less greatly discounted than social gain, at large social distances. This indicates people are more other-regarding for socially-distant people when social loss is concerned, in comparison to social gain. These finding indicate social discounting of loss is distinct from social discounting of gain. This distinction should be investigated in future studies in mathematical physics of human decision-making and behavioral neuroeconomics.
Previous studies examined the sign effects in temporal and probability discounting [13,20]. Future mathematical psychological studies should examine these effects by employing the q-exponential functions, because the q-exponential function is a generalization of both hyperbolic and exponential functions and better fit the behavioral data than exponential functions for both gain and loss. Our previous study demonstrated that introducing psychological time in the analysis reduces time-inconsistency in intertemporal choice [13]. Future studies should investigate whether the interpersonal inconsistency in social discounting is mitigated by considering the nonlinearity of perceived social distance.
5. Acknowledgements
This work was supported by Grant-in-Aid for Scientific Research on Innovative Areas (23118001; Adolescent Mind & Self-Regulation) from the Ministry of Education, Culture, Sports, Science and Technology of Japan.
REFERENCES
- C. Tsallis, “Nonadditive Entropy Sq and Nonextensive Statistical Mechanics: Applications in Geophysics and Elsewhere,” Acta Geophysica, Vol. 60, No. 3, 2012, pp. 502-525. doi:10.2478/s11600-012-0005-0
- C. Tsallis, C. Anteneodo, L. Borland and R. Osorio, “Nonextensive Statistical Mechanics and Economics,” Physica A: Statistical Mechanics and Its Applications, Vol. 324, No. 1, 2003, pp. 89-100.
- T. Takahashi, “A Comparison of Intertemporal Choices for Oneself versus Someone Else Based on Tsallis’ Statistics,” Physica A: Statistical Mechanics and Its Applications, Vol. 385, No. 2, 2007, pp. 637-644.
- T. Takahashi, H. Oono and M. H. B. Radford, “Empirical Estimation of Consistency Parameter in Intertemporal Choice Based on Tsallis’ Statistics,” Physica A: Statistical Mechanics and Its Applications, Vol. 381, 2007, pp. 338-342.
- T. Takahashi, H. Oono and M. H. B. Radford, “Comparison of Probabilistic Choice Models in Humans,” Behavioral and Brain Functions, Vol. 3, No. 1, 2007, p. 20.
- T. Takahashi, K. Ikeda and T. Hasegawa, “A Hyperbolic Decay of Subjective Probability of Obtaining Delayed Rewards,” Behavioral and Brain Functions, Vol. 3, 2007, p. 52.
- T. Takahashi, “A Comparison between Tsallis’s Statistics-Based and Generalized Quasi-Hyperbolic Discount Models in Humans,” Physica A: Statistical Mechanics and Its Applications, Vol. 387, 2008, pp. 551-566.
- T. Takahashi, “Tsallis’s Non-Extensive Free Energy as a Subjective Value of an Uncertain Reward,” Physica A: Statistical Mechanics and Its Applications, Vol. 388, No. 5, 2009, pp.715-719.
- T. Takahashi, “Theoretical Frameworks for Neuroeconomics of Intertemporal Choice,” Journal of Neuroscience, Psychology, and Economics, Vol. 2, No. 2, 2009, pp. 75- 90. doi:10.1037/a0015463
- T. Takahashi, T. Hadzibeganovic, S. A. Cannas, T. Makino, H. Fukui and S. Kitayama, “Cultural Neuroeconomics of Intertemporal Choice,” Neuro Endocrinology Letters, Vol. 30, No. 2, 2009, pp. 185-191.
- T. Takahashi, “A Social Discounting Model Based on Tsallis’ Statistics,” Physica A: Statistical Mechanics and Its Applications, Vol. 389, No. 17, 2010, pp. 3600-3603.
- T. Takahashi, “Psychophysics of the Probability Weighting Function,” Physica A: Statistical Mechanics and Its Applications, Vol. 390, No. 5, 2011, pp. 902-905.
- R. Han and T. Takahashi, “Psychophysics of Time Perception and Valuation in Temporal Discounting of Gain and Loss,” Physica A: Statistical Mechanics and Its Applications, Vol. 391, No. 24, 2012, pp. 6568-6576.
- T. Takahashi, H. Oono and M. H. B. Radford, “Psychophysics of Time Perception and Intertemporal Choice Models,” Physica A: Statistical Mechanics and Its Applications, Vol. 387, No. 8-9, 2008, pp. 2066-2074.
- B. Jones and H. Rachlin, “Social Discounting,” Psychological Science, Vol. 17, No. 4, 2006, pp. 283-286. doi:10.1111/j.1467-9280.2006.01699.x
- H. Rachlin and B. Jones, “Social Discounting and Delay Discounting,” Journal of Behavioral Decision Making, Vol. 21, No. 1, 2008, pp. 29-43. doi:10.1002/bdm.567
- U. Benzion, A. Rapoport and J. Yagil, “Discount Rates Inferred from Decisions: An Experimental Study,” Management Science, Vol. 35, No. 3, 1989, pp. 270-284. doi:10.1287/mnsc.35.3.270
- Y. Ohmura, T. Takahashi and N. Kitamura, “Discounting Delayed and Probabilistic Monetary Gains and Losses by Smokers of Cigarettes,” Psychopharmacology, Vol. 182, No. 4, 2005, pp. 508-515. doi:10.1007/s00213-005-0110-8
- W. Du, L. Green and J. Myerson, “Cross-Cultural Comparisons of Discounting Delayed and Probabilistic Rewards,” Psychological Record, Vol. 52, No. 4, 2002, pp. 479-492.
- S. J. Estle, L. Green, J. Myerson and D. D. Holt, “Differential Effects of Amount on Temporal and Probability Discounting of Gains and Losses,” Memory & Cognition, Vol. 34, No. 4, 2006, pp. 914-928. doi:10.3758/BF03193437