Wireless Engineering and Technology
Vol.4 No.3(2013), Article ID:34183,9 pages DOI:10.4236/wet.2013.43022
Blind Modulation Recognition in Wireless MC-CDMA Systems Using a Support Vector Machine Classifier
![]()
1Egyptian Space Program, National Authority for Remote Sensing and Space Science, Cairo, Egypt; 2Faculty of Electronic Engineering, Menoufia University, Menouf, Egypt.
Email: mo7amed_elhady@yahoo.com
Copyright © 2013 Mohamed El-Hady Magdy Keshk et al. This is an open access article distributed under the Creative Commons Attribution License, which permits unrestricted use, distribution, and reproduction in any medium, provided the original work is properly cited.
Received April 26th, 2013; revised May 30th, 2013; accepted June 12th, 2013
Keywords: ADMR; MC-CDMA; MFCC; DT; SVM; ANN
ABSTRACT
Automatic Digital Modulation Recognition (ADMR) is becoming an interesting problem with various civil and military applications. In this paper, an ADMR algorithm in Multi-Carrier Code Division Multiple Access (MC-CDMA) systems using Discrete Transforms (DTs) and Mel-Frequency Cepstral Coefficients (MFCCs) is proposed. This algorithm uses various DT techniques such as the Discrete Wavelet Transform (DWT), Discrete Cosine Transform (DCT) and Discrete Sine Transform (DST) with MFCCs to extract features from the modulated signal and a Support Vector Machine (SVM) to classify the modulation orders. The proposed algorithm avoids over fitting and local optimal problems that appear in Artificial Neural Networks (ANNs). Simulation results shows the classifier is capable of recognizing the modulation scheme with high accuracy up to 90% - 100% using DWT, DCT and DST for some modulation schemes over a wide Signal-to-Noise Ratio (SNR) range in the presence of Additive White Gaussian Noise (AWGN) and Rayleigh fading channel, particularly at a low Signal-to-Noise ratios (SNRs).
1. Introduction
ADMR is an intermediate step between signal detection and demodulation. It is a rapidly evolving area in various digital signaling systems currently developed or planned for various civilian and military communication applications [1]. Recent developments in software defined radio are based on perfect recognition of the modulation scheme of the received signal. Automatic recognition plays an important role in both military and civilian applications due to its capability of placing several receivers in one universal receiver. ADMR techniques usually can be categorized in two main principles, the first is based on the Decision-Theoretic Approach (DTA) and the second is based on the Pattern Recognition Approach (PRA).The DTA is a probabilistic solution based on a priori knowledge of probability functions and certain hypotheses [2], and the PRA consists of two subsystems. The first one is the feature extraction subsystem and the second one is the classifier.
Feature extraction extracts useful small amount of data from the signal. The classifier uses the useful information extracted from the feature extraction subsystem to classify the signal. In this paper, we use the pattern recognition approach.
In the last years, MC-CDMA has become the dominant transmission technique for both wired and wireless communication systems. Besides its advantages to combat multipath propagation with simple receiver structures, it furthermore enables a flexible adaption of modulation schemes on a subcarrier basis or group of subcarriers [3,4]. MC-CDMA is praised as a modulation solution that merges the insights due to Shannon (particularly those related to CDMA) with insights due to Fourier (particularly those explaining why OFDM has advantages in a dispersive channel).
There are many studies in ADMR field with different methods about the way the features can be extracted. In [5], the authors presented a kernel-based modulated signal classification method for a Cognitive Radio (CR) system, which cast into machine learning approaches. This method extracts both statistical and spectral features from the received signals. The Kernel-based Generalized Discriminant Analysis (KGDA) projects these features to a new feature space with C−1-dimensions such that the separability of the classes increases.
In [6], multi-class classification of analog and digital signals in CR was presented using SVMs. The author implemented a simulated model of an SVM signal classifier trained to recognize seven distinct modulation schemes; five digital (BPSK, QPSK, GMSK, 16QAM and 64QAM) and two analog (FM and AM). The results show that the SVM correctly classified signals with success rate of 85% - 98%.
In [7], an equalizer was used to reduce the channel effects. A selected combination of the fourth, sixth and eighth order moments and cumulants of the received signal was used to better represent the digital signal. A multiclass classifier based on SVMs was used to determine the types of the received signals. Simulation results showed that this method has a success rate in the presence of noise and fading.
In [8], an automatic digital modulation identifier in dispersive media was proposed. Prior to this identifier, the undesired effects of channel are mitigated with an equalizer. Higher order cumulants and moments (up to eight) were used as features. Simulation results showed that this identifier is able to identify different types of modulations (e.g. QAM64, V.29, and ASK8) with high accuracy even at low SNRs.
In [9], an approach to signal classification combining spectral correlation analysis and SVMs was introduced. Four spectral coherence characteristic parameters were chosen via spectral correlation analysis. By utilizing a nonlinear SVM, a significant amount of calculation was performed offline, thus the computational complexity was reduced. Simulations indicated that the overall success rate is above 92.8% when the SNR is equal to 4 dB.
In [10], a total of 7 statistical signal features were extracted and used to classify 9 modulation signals. The authors investigated the performance of the two types of SVM classifiers. Classification results up to 97% were obtained on an AWGN channel.
In this paper, we propose an algorithm capable of identifying digital modulation techniques in MC-CDMA system, and after identification it is capable of recovering transmitted data. This algorithm uses different discrete transform techniques (DWT, DCT and DST) for features extraction, and then applies MFCCs to obtain the useful features. The proposed classifier is a multi-class SVM which can classify more than two classes. This classifier has the capability of recognizing the M-ary Phase Shift Keying (M-PSK) signals and the order of the identified modulation. The performance of the proposed algorithm is examined based on Correct Recognition Probability (CRP). AWGN and multi-path fading (Rayleigh) channels are considered when developing the mathematical model and through most of the results.
The remainder of the paper is organized as follows. Section 2 shows the proposed ADMR technique for the MC-CDMA System. Section 3 defines the mathematical model of the proposed algorithm and presents the cepstral analysis methods. Section 4 shows feature extraction from discrete transforms. Section 5 is dedicated to the structure of SVM. The results, algorithm performance analysis, and a comparative study for various orders of digital modulation types are presented in Section 6. Conclusions of this research work are presented in Section 7.
2. Proposed ADMR Techniquein MC-CDMA System
In a multipath fading environment, not only a direct transmission signal but also many reflected signals arrive at the receiver at the same time, which causes Inter-Symbol Interference (ISI) leading to a significant degradation in the network performance. In broadband wireless communications, high bit rate transmission is required for high quality communications. The most important objective of Software Defined Radio (SDR) systems is to take care of the ISI resulting from high data rates. To overcome this problem, it is necessary to use parallel transmission, in which high speed data is converted to slow parallel data in several channels.
System Configuration
In Figure 1, we illustrate the sequence of processes of ADMR in the training mode and recognition mode.
Features extraction involves two stages, the first one is the discrete transforms (DCT, DST, DWT) and the second one is MFCCs extraction. Here, we use 13 features only, because these features are unique from a modulation technique to another.
In Figure 2, the transmitted high speed data (random number) is first converted into parallel data sub-channels to overcome the problem caused by multi path fading environment. then, the transmitted data of sub-channel is

Figure 1. Proposed ADMR technique.

Figure 2. ADMR in MC-CDMA system.
modulated by the whole types of modulation techniques which mentioned before (BPSK, QPSK, 8PSK, 16PSK, 64PSK). In training mode, features of modulated data is extracted and fed to SVM The classification process consists of two main modes; training mode and recognition mode. In the training mode, the SVM is trained to classify input features into unique classes (modeling), in our study we have 5 classes. Once a proper set of feature vectors is obtained from the previous stage, the SVM develop a model for each modulated signal features for building the reference models into the system database.Then the modulated signals are fed to the spreading process (hadamard code is used), then the Inverse Fast Fourier Transform (IFFT) is applied for the multiplexing processes to distinguish between the subchannels and to generate MC-CDMA signal. This MCCDMA signal is fed to the guard interval insertion block which adds the cyclic guard interval before every symbol to reduce the problems resulting from ISI, and then the signal is transmitted.
In the recognition mode, unknown signal features are extracted and passed to the system. The system tests these features bycomputing a matching score between the unknown received signal feature vector and the reference models stored in the system database, and the output ofthis matching score is usedto classify the received signal into one of the reference model vectors (classify received signal order), i.e. the system is capable of taking a decision about the signal identity. This decision is made based on the result of the matching technique used.
3. Cepestral Analysis
The idea of cepstral analysis is to separate the spectral components (characteristics) of the signal so that signal dependent information can be obtained. Mathematically, the cepstrum is computed by taking the fast Fourier transform (FFT) of the signal, taking the log of the magnitude of the spectrum and then taking the IFFT.
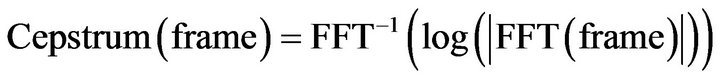 (1)
(1)
For the calculation of the MFCCs of a modulated signal, the signal is firstly framed and windowed, the DFT is then taken, and the magnitude of the resulting spectrum is warped by the Mel-scale. The log of this spectrum is then taken and the DCT is applied. The DCT replaces the IDFT stage in practice for I simplicity. This is illustrated in Figure 3.The steps of extraction of the MFCCs are summarized in the following subsections.
3.1. Framing and Windowing
The modulated signal is a slowly time-varying signal. In a signal identification system, the modulated signal is partitioned into short-time segments called frames. To make the frame parameters vary smoothly, there is normally a 50% overlap between each two adjacent frames. Win-

Figure 3. Extraction of MFCCs from a modulated signal.
dowing is performed on each frame with one of the popular signal processing windows like the Hamming window [11]. Windowing is often applied to increase the continuity between adjacent frames and smooth out the end points such that abrupt changes between ends of successive frames are minimized.
The shape of the Hamming window is similar to that of a cosine wave. The following equation defines the window:
 (2)
(2)
for ; where N is the length of the window.
As a frame is multiplied by a window, most of the data at the edges of the frame becomes insignificant causing loss of information. An approach to tackle this problem is to allow overlapping in the sections between frames, which allows adjacent frames to include portions of data in the current frame. This means that the edges of the current frame are included as the centre data of adjacent frames. Typically, around 50% of overlapping is sufficient to embrace the lost information.
3.2. The DFT
Fourier analysis provides a way of analysing the spectral properties of a given signal in the frequency domain. The Fourier transform converts a discrete signal s(n) from time domain into frequency domain with the equation [12]:
 (3)
(3)
where , and N is the number of samples in the signal s(n). k represents the discrete frequency index, and j is equal to
 The result of the DFT is a complex-valued sequence of length N. The IDFT is defined as:
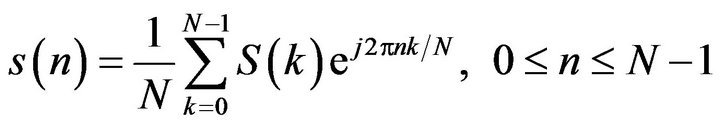 (4)
(4)
3.3. The Mel Filter Bank
The power signal is then applied to this bank of filters called Mel filter bank to determine the frequency content across each filter. The Mel frequency filter bank is a series of triangular band pass filters. The filter bank is based on a non-linear frequency scale called the Mel scale which has been discussed earlier. The filters are overlapped in such a way that the lower boundary of one filter is situated at the centre frequency of the previous filter and the upper boundary is situated at the centre frequency of the next filter. The maximum response of a filter, that is, the top vertex of the triangular filter, is located at the filter centre frequency and is normalized to unity.
In the MFCCs method, the main advantage is that it uses Mel-frequency scaling, The Mel scale is defined as [12]:
 (5)
(5)
where Mel is the Mel-frequency scale and f is the frequency on the linear frequency scale.
The final step is to compute the MFCCs. For this purpose the log Mel spectrum is converted back to time. Then, the DCT is applied to it to get MFCCs. The DCT is applied to the filter outputs and the first few coefficients are grouped together as a feature vector If the output of the mth Mel filter is , then the MFCCs are given as [13]:
 (6)
(6)
where , G is the number MFCCs, Nf is the number of Mel filters and cg is the gth MFCC.
The number of the resulting MFCCs is chosen between 12 and 20, since most of the signal information is represented by the first few coefficients. The 0th coefficient represents the mean value of the input signal.
4. Feature Extraction from Discrete Transforms
Discrete transforms can be used for extraction of robust MFCCs in modulation identification systems. The DWT, the DCT, and the DST have been investigated in the literature for this purpose [14]. Figure 4 illustrates the utilization of discrete transforms in modulation identification systems.
4.1. The DWT
The wavelet transform is computed separately for differ-

Figure 4. Mel-spaced filter bank.
ent segments of the time-domain signal at different frequencies. Wavelet transform allows Multi-Resolution Analysis (MRA), where it has time-frequency localization. This property allows locality both in time and frequency domains. MRA is designed to give good time resolution and poor frequency resolution at high frequencies and good frequency resolution and poor time resolution at low frequencies. The locality of transformation of a signal is important in two ways for pattern recognition. Firstly, different parts of the signal may convey different amounts of information. Secondly, when the signal corrupted by local noise in time and/or in frequency, the noise affects only a few coefficients if the coefficients represent local information in time and frequency.
The idea of DWT is to represent a signal as a series of approximations (low pass version) to the signal and details (high pass version) at different resolutions.
4.2. The DCT
The DCT is a 1-D transform with an excellent energy compaction property. For a modulated signal x(n), the DCT is represented by [15]:
 (7)
(7)
where

IDCT is given by:
 (8)
(8)
The features are extracted from X(k) and used for modulation identification.
4.3. The DST
The DST is another triangular transform with common properties with the DCT. The mathematical representation of the DST is given by [15]:
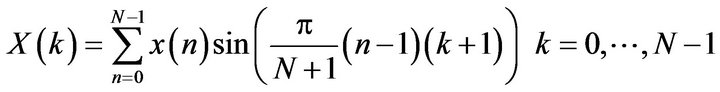 (9)
(9)
The features are extracted from X(k) and used for modulation identification.
5. Classification
SVM
Support Vector Machine (SVM) is an empirical modeling algorithm and is the state-of-the-art for the existing classification methods. The SVM is basically a two-class classifier based on the ideas of “large margin” and “mapping data into a higher dimensional space”, and the kernel functions in the SVM.
The first objective of the SVM classification is the maximization of the margin between the two nearest data points belonging to two separate classes. The second objective is to constraint that all data points belong to the right class. It is a two-class solution which can use multidimension features.
The two objectives of the Support Vector Classifier (SVC) problem are then incorporated into an optimization problem. SVC classifies the points from two linearly separable sets in two classes by solving a quadratic optimization problem in order to find the optimal separating hyper plane between these two classes. This hyper plane maximizes the distance from the convex hulls of each class. These techniques can be extended to the nonlinear cases by embedding the data in a nonlinear space using kernel functions. The robustness of SVC originates from the strong fundamentals of statistical learning theory.
SVC can be applied to separable and non-separable data points. In the non-separable case, the algorithm adds one more design parameter. This parameter is the weight of the error caused by the points present in the wrong class region. In MC, this issue occurs in the low SNR cases. Another degree of freedom in the SVC is the kernel function used. SVM must firstly transform the similarity space to a manageable space. This is done by defining a “kernel” which is an inner product to convert points in the input space to points in the feature space as shown in Figure 5, In MC using SVM, we used quadratic kernels. Since SVM is basically a binary classifier,

Figure 5. The idea of SVM.
it is not straightforward to apply it to multi-class classification problems. The most typical method for the multiclass problem is to classify one class from the other classes (refer 1-v-r), another typical method is to combine all possible two-class (pair wise) classifiers (refer 1-v-I) [10]. It’s known as 1-v-I type SVM is superior to 1-v-r with respect to its learning time, but execution time for classification of 1-v-I is much worse than 1-v-r [16].
The third method is the DDAG SVM proposed in [17]. Its training phase is the same as the 1-v-I type but its testing time is less than the 1-v-I type. In Figure 6 we illustrate the method we used in this paper to classify 5 modulation techniques, first we classify one class from the others and if the received signal features (which belong to one class of 5 classes) does not belong to the single class and belongs to the other class, we remove the single class and take one class from the other classes and classify it from the rest of other classes and so on until we correctly classify the received signal.
6. Results and Discussion
The proposed algorithm was verified and validated for various orders of digitally modulated signals (BPSK, QPSK, 8PSK, 16PSK and 64PSK) in AWGN and multipath fading channels. All the simulation steps for MCCDMA system including the digitally modulated signals, the feature extraction, training of the SVM and performance evaluation were developed using MATLAB. The proposed classifier has shown an excellent performance over AWGN and fading channels even at low SNR.
In the training phase, 5 modulated signals of different orders are fed to the feature extraction stage (Discrete Transform and MFCCs) to generate the feature vectors, which are used to form the system database and these features are used to train the SVM. In the testing phase, each one of these modulated signals is received. Similar features to those used in the training are extracted from those received modulated signals and used for matching.

Figure 6. Method to classify 5 classes of modulation techniques.
The features used in all experiments are 13 or 26 MFCCs to form a feature vector of the modulated signal, depending on which method we choose. There are seven methods for extracting features adopted in the experiments. In the first method, the MFCCs (13) are extracted from the modulated signals, only. In the second one, the features (13 MFCCs) are extracted from the DWT of the modulated signals. In the third method, the features (26 MFCCs) are extracted from both the original modulated signals and the DWT of these signals and concatenated together. In the fourth method, the features (13 MFCCs) are extracted from the DCT of the modulated signals. In the fifth method, the features (26 MFCCs) are extracted from both the original modulated signals and the DCT of these signals and concatenated together. In the sixth method, the features (13 MFCCs) are extracted from the DST of the modulated signals. In the seventh method, the features (26 MFCCs) are extracted from both the original modulated signals and the DST of these signals and concatenated together. The recognition rate is used as the performance evaluation metric in all experiments. It is defined as the ratio of the number of success identifications to the total number of identification trials The discrete transforms and cepstral coefficient were calculated, and the features set are extracted. Then, preprocessing these features subset of each modulation order is performed as a preparation of SVM training. In training mode, we use quadratic kernel function as a learning function. The performance of the classifier was examined for 200 realizations for each modulation order, and the results are presented using the Correct Recognition Probability (CRP).
In Figure 7, we found that at the low SNR (SNR= −10 dB), the recognition rate for all modulation techniques is among 5 to 97 percent and BPSK recorded the highest percent and 16PSK recorded the lowest one. Then, as the

Figure 7. Recognition rate at different SNRs for various modulation schemes when features extracted from the signal.
SNR increases the modulation schemes BPSK, 64PSK QPSK, 16PSK and 8PSK, reach to 100 percent at SNR = 0, 10, 20, 30 and 30, respectively.
In Figure 8, we found that at the low SNR (SNR= −10 dB) the recognition rate for all modulation techniques is among 20 to 100 percent and BPSK recorded the highest percent and 16PSK recorded the lowest one. Then as the SNR increases the modulation schemes BPSK, QPSK, 8PSK, 16PSK and 64PSK are reached to 100 percent at SNR −10, 0, 25, 25 and 30 dB respectively.
In Figure 9, we found that at the low SNR (SNR= −10 dB), the recognition rate for all modulation techniques is among 18 to 99 percent. 64PSK recorded the highest percent and 8PSK recorded the lowest one. As the SNR increases, the modulation schemes 64PSK, BPSK, QPSK 8PSK and 16PSK reach 100 percent at SNR −5, 0, 15, 20, 30 dB respectively.
In Figure 10, we found that at the low SNR (SNR= −10 dB), the recognition rate for all modulation tech-

Figure 8. Recognition rate at different SNR for various modulation schemes, when features extracted from DWT.

Figure 9. Recognition rate at different SNR for various modulation schemes, when features extracted from signal plus DWT of signal.
niques is among 0 to 100 percent and QPSK recorded the highest percent. 8PSK, 16PSK, 64PSK recorded the lowest one. Then as the SNR increases the modulation schemes QPSK, BPSK, 8PSK, 164PSK and 64PSK reach 100 percent at SNR = −10, 0, 10, 10 and 10 dB, respectively.
In Figure 11, we found that at the low SNR (SNR = −10 dB) the recognition rate for all modulation techniques is among 0 to 100 percent. BPSK recorded the highest percent and 16PSK recorded the lowest one. Then, as the SNR increases, the modulation schemes BPSK, QPSK, 8PSK, 64PSK and 16PSK are reach 100 percent at SNR −10, −10, −5, 10 and 20 dB, respectively.
In Figure 12, we found that at the low SNR (SNR = −10 dB), the recognition rate for all modulation techniques is among 13 to 99 percent. QPSK recorded the highest percent and 16PSK recorded the lowest one. Then, as the SNR increases the modulation schemes QPSK, 64PSK, BPSK, 8PSK and 16PSK reach 100 percent at SNR = −5,

Figure 10. Recognition rate at different SNRs for various modulation schemes, when features extracted from the DCT of signal.

Figure 11. Recognition rate at different SNRs for various modulation schemes, when features extracted from signal plus DCT of signal.
−5, 0, 0 and 0 dB, respectively.
In Figure 13, we found that at the low SNR (SNR= −10 dB), the recognition rate for all modulation techniques is among 0 to 100 percent. BPSK, QPSK, and 8PSK recorded the highest percent and 16PSK recorded the lowest one. Then, as the SNR increases the modulation

Figure 12. Recognition rate at different SNRs for various modulation schemes, when features are extracted from DST of signal.
schemes BPSK, QPSK, 8PSK, 64PSK and 16PSK reach 100 percent at SNR −10, −10, −10, −5 and 10 dB, respectively.
So from the above results and by comparing them with the results of previous studies, we find that in [5], the CRPs of BPSK and QPSK when using 1024 samples at SNR = −10 dB are90.44 and 91.25 percent, respectively and at SNR = 25 dB are 99.71, and 99.90 percent, respectively. In [6], the CRPs of BPSK and QPSK at SNR = 0 dB are 93 and 89 percent, respectively, and at SNR = 30 dB are 99 and 100 percent, respectively. In [7], the CRP of BPSK, QPSK and 8PSK at SNR = 2 dB are 91, 84 and 78 percent, respectively, and at SNR = 8 are 100, 96 and 93 percent, respectively, and at SNR = 17 are 100, 100 and 100 percent, respectively. In [8], the CRPs of BPSK, QPSK and 8PSK at SNR = 2 dB are 91, 84 and 78 percent, respectively, and at SNR = 8 dB are 100, 96 and 93 percent, respectively, and at SNR = 17 dB are 100, 100 and 100 percent, respectively. In [9], the CRPs of BPSK and QPSK at SNR = 0 dB are 86.3 and 85.1 percent respectively, and at SNR = 4 dB are 93 and 92.8 percent, respectively. Comparison results are shown in Table 1. All these results are in favor of our proposed approach.

Table 1. Comparison between the proposed approach and other approaches.

Figure 13. Recognition rate at different SNRs for various modulation schemes, when features are extracted from signal plus DST of signal.
7. Conclusion
This paper presented an efficient ADMR approachusing discrete transforms and cepstral analysis for MC-CDMA, and it can be used in any communication system this Simulation results have shown a great success of the proposed approach with various modulation techniques which opens the door for further research on automatic modulation classification with cepstral features.
REFERENCES
- M. W. Aslam, Z. Zhu and A. K. Nandi, “Automatic Digital Modulation Classification Using Genetic Programming with K-Nearest Neighbor,” The 2010 Military Communications Conference—Unclassified Program Waveforms and Signal Processing Track.
- K. Hassan, I. Dayoub, W. Hamouda and M. Berbineau, “Automatic Modulation Recognition Using Wavelet Transform and Neural Networks in Wireless Systems,” EURASIP Journal on Advances in Signal Processing, 2010. doi:10.1155/2010/532898
- N. Yee, J. P. Linnartz and G. Fettweis, “Multi-Carrier CDMA in Indoor Wireless Radio Networks,” Proceedings PIMRC ‘93, Yokohama, 8-11 September 1993, pp. 109-113.
- G. Fettweis, “Multi-Carrier Code Division Multiple Access (MC-CDMA): Basic Idea,” Internal Report, Technekron Communication Systems.
- T. Zarey, J. Aboueiyy and K. N. Plataniotisyy, “KGDA for Signal Classification in Cognitive Radio.”
- M. Petrova, P. M¨ah¨onen and A. Osuna, “Multi-Class Classification of Analog and Digital Signals in Cognitive Radios Using Support Vector Machines,” Institute for Networked Systems, RWTH Aachen University Kackertstrasse 9, Aachen, Germany
- A. Ebrahimzadeh and G. Ardeshir, “A New Signal Type Classifier for Fading Environments,” Journal of Computing and Information Technology, Vol. 15, No. 3, 2007, pp. 257-266. doi:10.2498/cit.1000874
- A. Ebrahimzadeh and S. A. Seyedin, “Automatic Digital Modulation Identification in Dispersive Channels,” Proceedings of the 5th WSEAS International Conference on Telecommunications and Informatics, Istanbul, 27-29 May 2006, pp. 409-414.
- H. Hu, J. Song and Y. Wang, “Signal Classification Based on Spectral Correlation Analysis and SVM in Cognitive Radio,” 22nd International Conference on Advanced Information Networking and Applications, Okinawa, 25-28 March 2008.
- C.-S. Park, W. Jang and S. P. Nah, “Automatic Modulation Recognition Using Support Vector Machine in Software Radio Applications,” EW Lab, Agency for Defense Development, Korea.
- O. A. Dobre, A. Abdi, Y. Bar-Ness and W. Su, “Survey of Automatic Modulation Classification Techniques Classical Approaches and New Trends,” Sarnoff Symposium, Princeton, 2005.
- T. Kinnunen, “Spectral Features for Automatic Test Independent Speaker Recognition,” Licentiate’s Thesis, Department of Computer Science, University of Joensuu, Finland, 2003.
- T. Matsui and S. Furui, “Comparison of Text-Independent Speaker Recognition Methods Using VQ-Distortion and Discrete/Continuous HMMs,” IEEE Transactions on Speech and Audio Processing, Vol. 2, No. 3, 1994, pp. 456-459. doi:10.1109/89.294363
- B. S. Andrew and C. Lindgren, “Speech Recognition Using Features Extracted from Phase Space Reconstructions,” 2003.
- J. S. Walker, “A Primer on Wavelets and Their Scientific Applications,” CRC Press LLC, 1999. doi:10.1201/9781420050011
- Z. Wu, X. Wang, Z. Gao and G. H. Ren, “Automatic Digital Modulation Recognition Based on Support Vector Machines.”
- J. C. Platt and N. Cristianini, “Large Margin DAGs for Multiclass Classification,” In: S. A. Solla, T. K. Leen and K.-R. M¨uller, Eds., MIT Press, Cambridge, 2000, pp. 547-553.