Journal of Flow Control, Measurement & Visualization
Vol. 1 No. 1 (2013) , Article ID: 30723 , 4 pages DOI:10.4236/jfcmv.2013.11004
Temperature Measurement of Air Flow Using Fluorescent Mists Combined with Two-Color LIF
Department of Mechanical Systems Engineering, University of Yamanashi, Kofu, Japan
Email: sfunatani@yamanashi.ac.jp
Copyright © 2013 Shumpei Funatani et al. This is an open access article distributed under the Creative Commons Attribution License, which permits unrestricted use, distribution, and reproduction in any medium, provided the original work is properly cited.
Received January 22, 2013; revised February 25, 2013; accepted March 4, 2013
Keywords: Flow Visualization; Two-Color LIF; Temperature Measurement; Spraying Mist
ABSTRACT
This study proposes a two-color laser-induced fluorescence (LIF) technique for measuring the temperature distribution of an airflow by spraying a mist of a fluorescent dye. The mist is generated by using propylene glycol, the vapor pressure of which is much lower than that of water, as the solvent of the fluorescent dyes. A supersonic moisture chamber is used as the atomizer for seeding the tracer particles to be visualized. The proposed technique is applied to the measurement of the temperature distribution in a thermal vertical buoyant plume. The proposed two-color LIF thermometry is found to be very effective for the study of such a thermal structure, and it is well suited for measuring the temperature field of an airflow.
1. Introduction
In order to understand the transport phenomena of heat and fluid flow in various fields of engineering, it is essential to develop experimental methods for measuring the temperature field in the fluid flow.
For temperature field measurement of an airflow, the nitric oxide LIF (NO-LIF) method [1-3] or the acetone planar LIF (PLIF) method [4-5] have been employed. However, these methods have two drawbacks: the sensitivity of fluorescence intensity for temperature variation in these methods—NO-LIF: 0.05%/K [1] and PLIF: 0.4%/K [4]—is lower than that for the two-color laserinduced fluorescence (LIF) method for the temperature measurement of water flow—2.3%/K [6]—and a very expensive UV laser is required for the NO-LIF and PLIF methods.
The two-color LIF technique is suitable for performing temperature measurements of water flow. Doing so eliminates the influence of laser intensity fluctuations observed in the single-color LIF technique, which is a significant source of error in the temperature measurement [6]. But the two-color LIF technique has not been applied to airflows because while the fluorescent dyes could be dissolved and could generate water mist for visualizing the airflow, they vaporized easily and dissipated immediately and could thus not be visualized successfully.
The present study aims to solve the abovementioned problems by developing a technique for the simultaneous measurement of the temperature field of an airflow by using the two-color LIF method.
2. Measurement Techniques
2.1. Improvement of Visualization Techniques
In this study, we used a single-color camera for temperature measurement using the two-color LIF technique [4]. Therefore, the fluid temperature could be measured if the relationship between the intensity ratio and the temperature was known. It should be noted that the R, G, and B filters of the color camera pass light having a wavelength of 575 - 640, 490 - 575, and 400 - 485 nm, respectively. Rhodamine B (emission wavelength: 575 nm) and Rhodamine 110 (emission wavelength: 520 nm) are selected as the temperature-sensitive and insensitive dyes, respectively. The R and G filters of the color camera serve to separate the excitation light and the emission light.
The temperature measurement of an airflow using two-color LIF was performed by spraying a mist of the fluorescent dye in the test vessel. A solution mist of fluorescent dyes could not be used for visualization because it vaporized and dissipated as soon as it was sprayed. To avoid this problem, we used propylene glycol, the vapor pressure of which (~10 Pa) is much lower than that of water (>2000 Pa), as the solvent of the fluorescent dyes. A supersonic moisture chamber was used as the atomizer and the Sauter mean diameter of the propylene glycol mist was ~3 µm, which was measured using a light-scattering airborne particle counter.
The fluorescence intensity from the mist is much smaller than that from the liquid solution, and it is difficult to visualize clearly. In the previous study, a 488 nm Arion laser was used as the light source. Such a process could not be applied when the fluorescence intensity becomes relatively too small compared to that by scattering using an incident laser beam. To solve this problem, we used a 445 nm diode laser (power: 1000 mW) as the light source, because the shorter wavelength can reduce the incidence of the laser beam to the green image of the color camera such that the fluorescence can be detected. Furthermore, we used a long-pass filter (>480 nm) to reduce the incidence of the 445 nm diode laser on the camera.
2.2. Experimental Setup
The temperature field of air was measured using the experimental apparatus shown in Figure 1. The test section’s volume was 400 × 250 × 280 mm3. The test section was visualized by using a 445 nm diode laser (power: 1000 mW). The laser light sheet was generated by scanning a laser beam by using a rotating mirror instead of a cylindrical lens, because the light sheet generated by a cylindrical lens has nonuniformity and the S/N ratio varies significantly over the measurement region.
The concentration ratio of Rhodamine B and Rhodamine 110 was set to CR = 20, which was known as the optimum concentration ratio of these dyes [6]. A color camera (Nikon D5100, 14bit, 4928 × 3264 pixels) was used to record the visualized image.
The temperature of the atmosphere was Tc = 25˚C, and a buoyant plume was generated from the circular pipe

Figure 1. Experimental setup (unit in mm).
(inside diameter: D = 14 mm) at the bottom surface of the test section. The temperature of hot air was Th = 35˚C at y = −10 mm in the nozzle, and the average velocity was V0 = 10 mm/s. Therefore, the Froude number of the vertical buoyant plume was Fr0 = 4.23, and the Reynolds number was Re = 1670. The above conditions were selected because the temperature distribution of the thermal plume was obtained suitably [7]; the temperature distribution was predicted to be stable. These conditions were suitable for evaluating this measurement method.
3. Results
3.1. Application to Temperature Distribution in Thermal Buoyant Plume
Figure 2(a) shows images of the sprayed fluorescent mist as visualized by a diode laser and color camera at various temperatures. The image at lower temperature (25˚C) has an orange color, and the color changes slightly at a higher temperature (35˚C). Figure 2(b) shows the variation of R/G with respect to temperature; the R/G value constantly decreased with an increase in temperature, which was the same result as that of the two-color LIF method using a single-color camera [4]. This result suggests that the R and G filters of a color camera can be used as filters for the two-color LIF technique even though the object to be visualized has changed from a liquid to a spray. In this study, the temperature measurement range was limited by the specifications of the experimental setup; however, this measurement range is expected to extend to be the same as that of the two-color LIF technique for water flow (0˚C - 60˚C) [6].
 (a)
(a) (b)
(b)
Figure 2. Visualized image and optical characteristics of two-color LIF image. (a) Visualized images; (b) Relationship between temperature and R/G.
Figure 3 shows the temperature distributions in the thermal buoyant plume. It shows the instantaneous structure of the thermal plume that was generated from a circular nozzle and that interacted with the stagnant surrounding cold air. In the previous experimental and numerical study of a vertical buoyant jet, it was shown that the jet became stable and the decrease in temperature by the inflow did not occur [7]. The temperature distribution in this study shows good agreement with that in the previous study. We found two-color LIF thermometry to be very effective for the study of the thermal structure of plumes. Furthermore, we found that the two-color LIF technique was well suited for measuring the temperature field of an airflow.
3.2. Uncertainty Analysis
As a part of our assessment of the proposed visualization technique, we investigated its temperature measurement uncertainty. The uncertainty originates from the error sources, such as the temperature calibration by a thermocouple (bias error: ±0.05 K), color-to-temperature transformation, image processing, fluctuation of the particle density of the fluorescent mist, and tracing accuracy of the fluorescent mist. The measurement uncertainty in color-to-temperature transformation and image processing can be evaluated from a comparison of the experimental data of the temperature measurement of two-color LIF with that of a thermocouple in a uniform temperature field.
A uniform temperature field was generated by heating and mixing the atmosphere in the test section by using a heater and an electric fan. The result indicates that the standard deviation of temperature was ±0.30 K (precision error).
The non-uniform tracer particle diameter of the fluorescent mist was considered to influence the evaluated temperature, but it was not kept steady because the mist was always dropping and mixing with surrounding flows. Therefore, the influence of the dropping and mixing of the fluorescent mist was also evaluated by spraying the

Figure 3. Temperature distribution of vertical thermal plume.
mist and recording the visualized images and evaluating the time variation of the evaluated temperature for 10 min (Figure 4). The result shows that the evaluated standard deviation of the temperature fluctuation due to nonuniform tracer particles was ±0.41 K (precision error).
It was also necessary to evaluate the tracing accuracy of the fluorescent mist as it is related to the temperature of the atmosphere. The temperature variance of a propylene glycol mist surrounded by air was evaluated by numerical simulation using an unsteady one-dimensional thermal diffusion equation of spherical coordinates which is expressed by the following Equation [8]:
 (1)
(1)
where, r is the radial coordinate, τ is the time, T is the temperature, k, r and c is the thermal conductivity, density and specific heat at constant pressure, respectively. These thermal properties are given as a function of temperature.
The tracking time of the propylene glycol mist to reach the temperature of air was evaluated at various diameters of the mist (Dp: 1 - 5 µm, 25˚C) and the temperature difference between the mist and surrounding air (2.5 - 40 K). The mist temperature is defined as volume average temperature. Table 1 lists these results. The tracking time is defined as the time until the temperature difference becomes smaller than 0.01 K. In these conditions, the tracking time is less than 0.1 ms.
The latent heat of vaporization of propylene glycol is

Figure 4. Time variation of evaluated temperature.
Table 1. Tracking time of propylene glycol mist without vaporization.
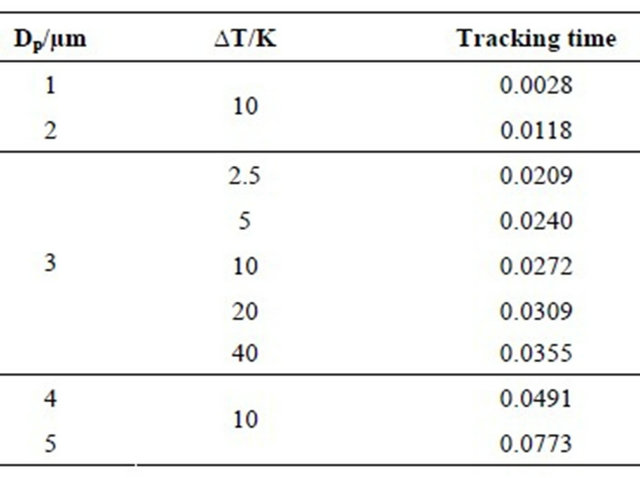
Tracking time: unit of milliseconds.
300 times the heat capacity of the liquid state. The tracking time increases with the increasing heat quantity during the phase change. However, this increasing time decreases when the magnitude of the heat flow from the surrounding air to the mist increases. For example, if the temperature difference is 1 K and all the mist vaporizes, the tracking time is about 301 times longer than that in the non-vaporized case. This is because the required heat quantity is the sum of the increase in the amount of internal energy and the heat quantity during the phase change. However, under normal conditions, the temperature difference is larger than 1 K, and only a part of the mist is vaporized. Therefore, the tracking time did not become so large. We assume that the tracking time was less than 1ms.
This evaluation did not take into account the influence of convective heat transfer by the difference between the speed of the mist and the surrounding air. Therefore, the actual tracing accuracy will be higher than is indicated by this result, because the influence of the convective heat transfer leads to an improvement in the tracing accuracy. Therefore, the total uncertainty interval of temperature at 95% coverage was ±0.99 K and the tracking time was less than 1 ms.
4. Conclusions
The two-color LIF technique was used for measuring the temperature of an airflow by spraying a mist of propylene glycol and by using a 445 nm diode laser. The proposed measurement technique was successfully applied to a vertical buoyant plume. The total uncertainty interval of temperature at 95% coverage was ±0.99 K and the tracking time was less than 1 ms.
The expansion of the temperature measurement range and a detailed study of a vertical buoyant plume for various Froude numbers will be conducted in the next study.
5. Acknowledgements
This research was supported by the Grant-in-Aid for Young Scientists (B) No.24760131 of the Japan Society for the Promotion of Science (JSPS).
REFERENCES
- W. G. Bessler, C. Schulz, T. Lee, D.-I. Shin, M. Hofmann, J. B. Jeffries, J. Wolfrum and R. K. Hanson, “Quantitative NO-LIF Imaging in High-Pressure Flames,” Applied Physics B, Laser and Optics, Vol. 75, No. 1, 2002, pp. 97-102. doi:10.1007/s00340-002-0946-0
- W. G. Bessler and C. Schulz, “Quantitative Multi-Line NO-LIF Temperature Imaging,” Applied Physics B, Laser and Optics, Vol. 78, No. 5, 2004, pp. 519-533. doi:10.1007/s00340-004-1421-x
- C. Hecht, A. Abdali, T. Dreier and C. Schulz, “GasTemperature Imaging in a Microwave-Plasma Nanoparticle-Synthesis Reactor Using Multi-Line NO-LIF Thermometry,” Zeitschrift Fur Physikalsche Chemie—International, Vol. 225, 2011, pp. 1225-1235. doi:10.1524/zpch.2011.0162
- M. C. Thunber, F. Grisch and R. K. Hanson, “Temperature Imaging with Singleand Dual-Wavelength Acetone Planar Laser-Induced Fluorescence,” Optics Letters, Vol. 22, No. 4, 1997, pp. 251-253. doi:10.1364/OL.22.000251
- T. Handa, M. Masuda, M. Kashitani and Y. Yamaguchi, “Measurement of Number Densities in Supersonic Flows Using a Method Based on Laser-Induced Acetone Fluorescence,” Experiments in Fluids, Vol. 50, No. 6, 2011, pp. 1685-1694. doi:10.1007/s00348-010-1029-3
- S. Funatani, N. Fujisawaand and H. Ikeda, “Simultaneous Measurement of Temperature and Velocity Using TwoColour LIF Combined with PIV with a Colour CCD Camera and Its Application to the Turbulent Buoyant Plume,” Measurement Science and Technology, Vol. 15, No. 5, 2004, pp. 983-990. doi:10.1088/0957-0233/15/5/030
- T. Maeda, N. Fujisawa, T. Syuto and T. Yamagata, “Experimental and Numerical Study on Onset of Inflow in Near Field of Buoyant Jet at Low Froude Number,” Journal of Visualization, Vol. 15, No. 1, 2012, pp. 67-75. doi:10.1007/s12650-011-0104-z
- J. P. Holman, “Heat Transfer,” 10th Revised Edition, McGraw Hill Higher Education, New York, 2009.