Open Journal of Applied Biosensor
Vol. 2 No. 2 (2013) , Article ID: 31248 , 8 pages DOI:10.4236/ojab.2013.22007
Twin-T Oscillator Containing Polymer Coated Parallel Plate Capacitor for Sea Water Salinity Sensing
1BioMEMS and Microsystems Lab, Department of Electrical Engineering, University of South Florida, Tampa, USA
2Bioelectronics Program, Institute of Microelectronics, A*Star, Singapore Science Park II, Singapore City, Singapore
3Department of Electrical and Computer Engineering, Florida International University, Miami, FL, USA
Email: *sunilarya333@gmail.com
Copyright © 2013 Shreyas Bhatt et al. This is an open access article distributed under the Creative Commons Attribution License, which permits unrestricted use, distribution, and reproduction in any medium, provided the original work is properly cited.
Received February 26, 2013; revised April 2, 2013; accepted April 16, 2013
Keywords: Impedance Spectroscopy; Salinity Sensing; Capacitive Sensors; Polymer Coating; Twin-T Oscillator
ABSTRACT
This paper presents the development of a Twin-T oscillator comprising polymer coated parallel plates as a sensor for ocean water salinity monitoring. This sensor employs a parallel plate capacitor design, with sea water serving as the medium between plates. Novalac resin and a proprietary commercial polymer (Accuflo™) were investigated as corrosion protective coatings for the copper electrodes of the capacitor. Electrochemical Impedance Spectroscopy (EIS) was employed to evaluate corrosion inhibition of polymer coating in sea water. A detection circuit was designed and simulated using P-spice and then implemented in Printed Circuit Board (PCB). EIS results indicate that Accuflo exhibits better corrosion inhibition in ocean water than Novolac. Further, the use of Twin-T oscillator based detection circuit resulted in enhanced sensitivity and better detection limit. Experiments performed using ocean water samples resulted in oscillator frequency shift of 410 Hertz/power supply unit (Hz/PSU). Oscillator frequency drift was reduced using frequency-to-voltage converters and sensitivity of 10 mV/PSU was achieved.
1. Introduction
The oceanic studies began in the 1930s with the search for petroleum, continued with the emphasis for improved naval warfare and more recently have been driven by a need to understand and protect the ecosystem. No discussion on oceanography is complete without a mention of parameters such as salinity, temperature, pressure and density. Extensive research has been conducted to understand the role of these parameters in regulating oceanic processes, [1,2] but there is still a lot of latent information that seems to remain elusive to the oceanographers worldwide. Salt concentration measurement in sea water is very important as it affect the weight of surface waters. Fresh water is light and floats on the surface, while salty water is heavy and sinks. Together, salinity and temperature determine seawater density and buoyancy, driving the extent of ocean stratification, mixing, and water mass formation. The density of surface seawater ranges from about 1020 to 1029 kg m−3, depending on the temperature and salinity. Salinity is commonly defined as the ratio between the weight of dissolved material in the sea water sample and the weight of the sample [3] and is generally expressed in parts per thousand. The dissolved material includes dissolved gases, but excludes fine suspended particles and other solids that are in contact with sea water. Majority of seawater has a salinity of between 3.1% and 3.8%, with average of about 3.5% (35 g·L−1).
Salinity varies from place to place and it is lower where mixing occurs with fresh water runoff from river mouths or near melting glaciers, and found higher where high rates of evaporation, low precipitation and river inflow, and confined circulation occurs such as Red Sea. Chlorine (55.3%), sodium (30.8%), sulfate (7.7%), magnesium (3.7%), calcium (1.2%) and potassium (1.1%) are the major constituent of sea water salts [4]. Salinity is also conveniently referred to as TDS or Total Dissolved Salts. Greater salinity and colder temperatures results in an increase in ocean density with a corresponding depression of the sea surface height, whereas in fresh waters and warm temperature the density is lower resulting in an elevation of the sea surface [3-7]. Further, the presence of high concentrations of salts in sea water makes it very harsh for any material to sustain in it. Thus, salinity measurement is important to people and Industries dealing with sea water and require sensors which can withstand the harsh conditions of sea water for salinity monitoring. In ocean sciences, the electrical conductivity of seawater is used as an indication of salinity. Seawater salinity is calculated by formulas of the Practical Salinity Scale of 1978 (PSS-78) based on conductivity ratio measured by conductance sensors [4,8,9]. Conductivity measures how well the water sample conducts an electrical current, a property which is proportional to the concentration of ions in solution. The saltier the water, the higher the conductivity will be. The advantage of using conductivity over TDS is the ease with which measurements can be made. Thus, Seawater salinity can be calculated from measured values of conductivity and temperature.
Recently various principles and techniques have been reviewed for sensing sea surface salinity [10,11]. Menn et al. described the advances in measuring ocean salinity using optical sensors. Such sensor usually measure refractive index of seawater which is related to density and can therefore be used to measure absolute salinity [12]. Malarde et al., described optical refractometer based salinity measurement via refractive index recording of seawater. Tests and calibrations were made in a temperature-stabilized seawater tank. Results indicated that it is capable of measuring seawater refractive index with a resolution of about ± 4 × 10⁻⁷, equivalent to a salinity resolution of ± 2 × 10⁻³ g·kg−1 [13]. Among conductivity based sensors, two types of sensors I.e. Contact type sensors and Non-Contact type sensors are available for salinity measurement. In Contact type of sensors, there is a direct contact between the measurement probes and the surrounding media, whereas there is no contact between the analyte and the sensing device for Non-Contact type sensors. This gives Non-Contact type sensors an apparent advantage over the Contact type sensors, whose long term stability is limited by polarization and fouling. The measuring principle for most non-contact conductivity sensors is inductive. However, inductive sensors suffer from the problem of external fields’ interference. Apparently, the measuring field in this type of sensing is exposed to the surrounding media and does not couple entirely to the secondary coil of the transformer. Sea-bird Electronics Inc., in their comparative study on conductivity cells showed that most of the inductive cells currently in use have 11% to 20% of their field as external field which causes error in measurement [14]. The external fields lead to errors commonly known as proximity errors, which can have major consequences on the data. Thus, any material that has a conductivity value other than that of sea water can influence the calibration of the system. Cables, sensor housings and marine growth close to the conductivity cell also contribute to a shift in the system’s calibration.
To overcome the problem of external fields associated with inductive sensing capacitive principles for conduction sensing can be employed. Parallel plate capacitors rely on trapping the electric field in the region between the plates, [15,16] which provides an inherent confinement of the measuring field between the two plates, with little interference due to external fields/objects. Only a small portion of the field is exposed to the external media causing fringing effects at the corners and edges of the plates. Thus, due to the fringing fields at the plate edges the measured capacitance of a capacitor is generally higher than the calculated capacitance. Although, it is difficult to calculate the fringe field analytically, these are significant when the distance between the electrodes, is comparable to the smallest dimension of the electrode [17]. However, its effect can be minimized by using Kelvin guard electrodes (ring) in system [18].
In this work attempts have been made to use parallel plate based capacitor for salinity measurement. Two commercially available polymers have been investigated to solve the problem of electrode fouling in sea water. Simulations have been conducted using P-spice software to simulate results and Twin-T oscillator design was employed to achieve higher sensitivity. Further, a reduction in frequency drifts has been achieved using frequency to voltage converter and Kelvin ring guard was employed to reduce the fringing field effects at edges of device.
2. Materials and Methods
2.1. Sensor Design and Simulation
Figure 1(A) shows the schematic of sensor design having two parallel plates with a Kelvin guard ring. The Kelvin guard ring was used to minimize the effect of fringing fields and to improve the accuracy of capacitance measurements. Further, to reduce the effects of fringing fields in the proposed meso-scale capacitor, the distance between the electrodes was kept ~600 microns, and the smallest dimension (length of the top electrode) was kept 1 cm. Additionally, the following design features ensured high fidelity in measurements, a) the guard ring and the electrode were fabricated in one step and were coplanar, b) the distance between the guard ring and top electrode was kept at 400 µm, smaller than the 600 µm distance between the capacitor plates, c) the guard ring was held at a potential equal to that of the opposite plate.
Finite Element Modeling (FEM) using the FEM tool Comsol Multiphysics was performed to quantify the reduction in fringe field due to the incorporation of the Kelvin guard ring. Further, “Quasi-static” a sub-module of the “Electromagnetic” section was used to simulate appropriate sensors operational frequency range. Each
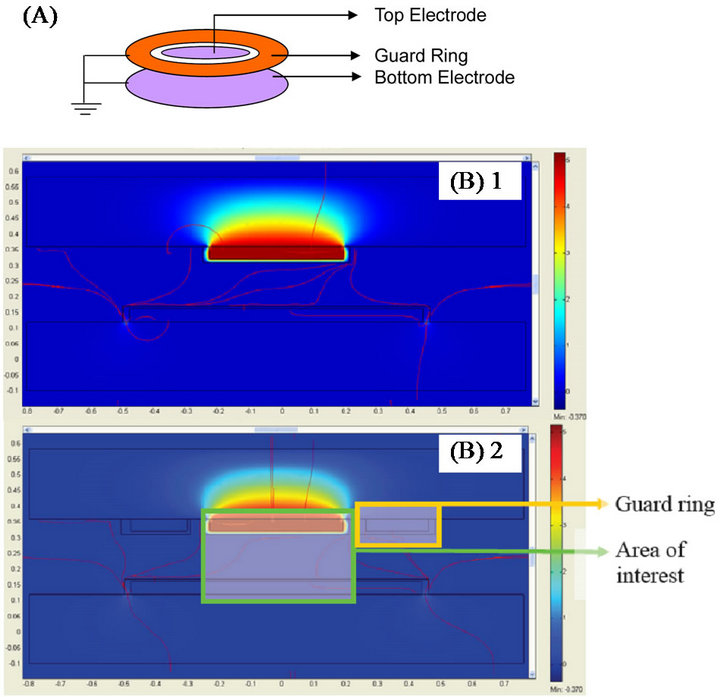
Figure 1. (A) Illustration of a capacitor incorporating kelvin guard ring; (B-1) Potential and electric field distribution of the capacitive sensor in seawater, (B-2) with guard rings.
shape in the geometry was assigned a sub-domain name to facilitate the specification of materials used in the construction of the sensor. To simulate the seawater medium around the sensor, the capacitor was enclosed in a box with dielectric properties matching those of seawater. Next, the boundary conditions were specified by assigning voltage for each of the interfaces. This is the most important step prior to simulation, as the nature of the boundary dictates the electromagnetic equation used in the calculation of the electric fields in the system. The boundaries of the top metal plate were assigned a sinusoidal voltage, 5 Vp-p in magnitude, while those of the lower plate were assigned to ground. The junction of the liquid-dielectric interface was assigned as a continuous interface and is hence, governed by the equation,
 (1)
(1)
where n is the normal vector and J1, J2 are the current density vectors of the two adjoining materials in consideration. In reality the space charge region in liquid dielectric junction with polarization contribute to the overall impedance. However, for simplicity these contributions were neglected in this simulation. Further, a mesh with “normal” mesh size was used for the mesh elements in simulation. The sensor was analyzed in the “time harmonic, small current” mode and solved using “UMFPACK”. The simulated system results for the potential distribution and electric field are shown in Figure 1(B).
Top in Figure 1(B) shows the electric field distribution represented by the streamlines while the color gradient represents the potential distribution at various regions in the capacitor. The energy density (E) stored by a capacitor was obtained using the post-processing operation via quasi-static simulation in COMSOL and given by the Expression 2,
 (2)
(2)
 (3)
(3)
Consequently, Equation (3) gives the capacitance from the energy density. The simulated capacitance for the modeled capacitor was obtained as 4.608 pF. Further, the capacitance of system obtained after the addition of guard rings (held at ground potential) around the capacitor plate (shown in bottom of Figure 1(B)), was computed using Expression 3 and found as 4.1026 pF. As expected, the capacitance for this system was found lower than the sensor without guard ring. The reduction in the computed capacitance was 10.9%.
2.2. Detection Circuit
2.2.1. Employing Twin-T Oscillator Circuit
The capacitive sensor is part of a Twin-T oscillator detection circuit. The Twin-T circuit consists of two arms, the high pass arm and the low pass arm. The advantage of Twin-T oscillator over other single-capacitor circuits is a lower distortion sine wave output. This circuit functions as a notch filter by eliminating a particular frequency from the incoming signal, [19] which can be achieved by adjusting the values of the constituent elements of the circuit. The schematic of the oscillator circuit is as shown in Figure 2" target="_self"> Figure 2(A). It was observed that at ~64 KHz (given by the circuit components), the phase of the output undergoes a 180˚ shift. For sustained oscillations, this filter can be configured as an oscillator by introducing an additional 180 degrees of phase shift around a closed loop.
In present work, capacitors in the circuit were replaced with the capacitive sensors fabricated in house, which act as the salinity senor. Also, the resistors used have a tolerance of 2%, to minimize drift in the oscillator response. This kind of a circuit incorporating R and C components can also be utilized in applications requiring low frequencies of operation.
2.2.2. Alternate Detection Circuit
To compare the response of system employing Twin-T oscillator, an alternative circuit for capacitive salinity sensing was developed based on frequency to voltage converters (F-V). This design employs only one capacitor and does not require matching of circuit components. A block diagram of the circuit is shown in Figure 2(C). The principal components of this circuit are: 1) Signal generator (or) voltage controlled oscillator chip. 2) Frequency to Voltage converters (NJM 4151). 3) Buffer and
(A)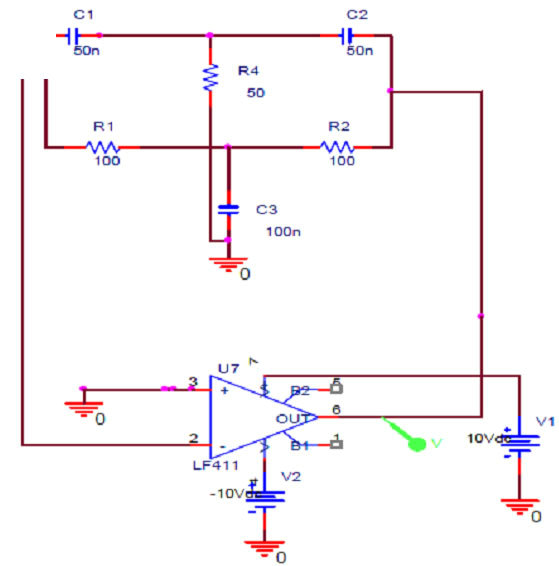 (B)
(B)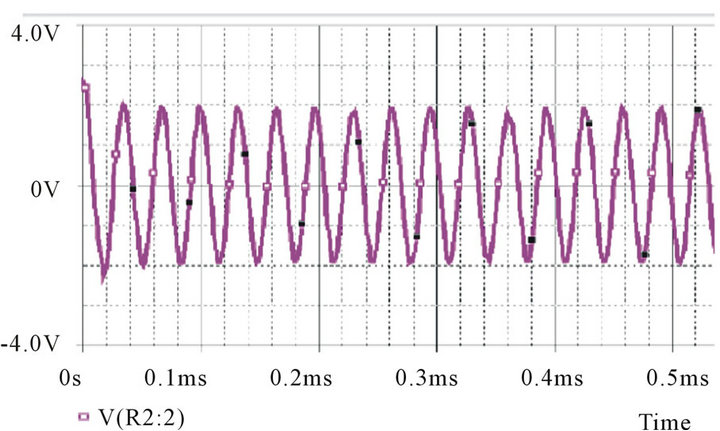 (C)
(C)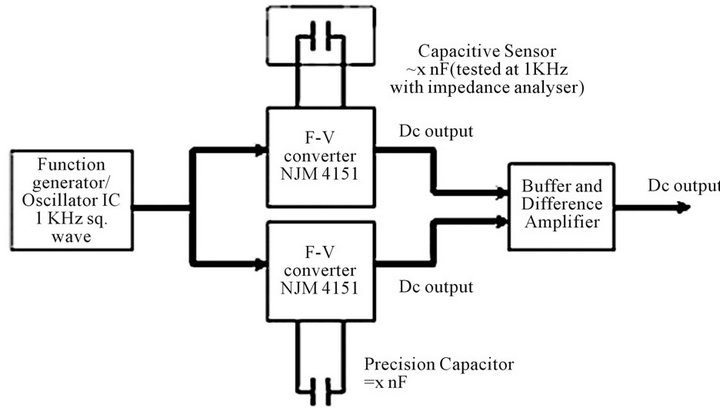
Figure 2. (A) Circuit schematic of Twin-T Oscillator; (B) Oscillator response simulated using Pspice; (C) Block diagram of circuit employing two frequency to voltage converters (F-V).
Difference amplifier (LM 6142).
In the schematic shown (Figure 2(C)), the square wave required for the operation of the circuit was generated using a 555 timer. This was done to ensure that the entire circuit could be driven from a single voltage source of 10 V. A 20 turn precision potentiometer R18 was used for calibration. The potentiometer adjusts the pulse-width of the one shot internal to the reference F-V converter U2 during the calibration of the circuit. The expression governing the output voltage of the F-V converters is given by equation 4 [20].
 (4)
(4)
2.3. Fabrication of Conductivity Sensor
The sensor consists of two parallel copper-coated FR4 plates. One of the plates had a dimension of 2 × 1 cm and the other plate has a slightly larger dimension (2.1 cm × 1.1 cm), for alignment tolerance and bonding. The sensor plates were fabricated using copper clad FR-4 substrate boards. The process flow steps for the fabrication are as depicted in Figure 3.
The first step in the fabrication of the sensor involves lithography. Electrode patterns were transferred using photolithography on positive photoresist coated FR-4. The pattern was developed in aqueous KOH (9 grams of KOH per liter of Deionized water) at 50˚C for 15 seconds. After development, the exposed copper was etched using Ferric Chloride solution. Subsequently, the photoresist over the copper was dissolved using acetone. Next, a thin layer of a dielectric material was coated on the plates. Two polymeric materials (Novolac and Honeywell’s Accuflo™) were evaluated to determine their effectiveness as corrosion inhibitors in ocean water.
Novolac resin was spin cast at 1000 rpm for 60 seconds to yield a thickness of ~5 microns. The resin was then hard baked on a hotplate at 140˚C for 90 sec. The top and bottom plates, fabricated separately, were aligned face to face with a spacing of ~600 mm, using spacers and bonded using photoresist. Similar methodology was adopted for Accuflo coating on electrodes.
2.4. Electrochemical Impedance Spectroscopy Analysis of Electrode Passivation
Electrochemical Impedance Spectroscopy (EIS) is a powerful technique with a wide range of applications from material characterization to corrosion monitoring. Depending upon the type of EIS response and the prior knowledge of system under test, one can arrive at plausible conclusions about the state of the system. Usually for analysis, the real part of impedance is plotted against the imaginary part (complex plane impedance plot). Such a plot usually gives a semicircular arc, which in the context of corrosion can be interpreted as the electrochemical

Figure 3. Process flow steps for fabrication of the sensor.
response of a corroding metal in a conductive solution.
Further, the solution resistance is given by the high frequency intercept of the semicircle (closest to imaginary axis) and the charge transfer resistance is estimated by the diameter of the semicircle. Based on the estimation of these parameters, many physical quantities such as solution conductivity, exchange current density etc. can be determined.
In the present work, EIS technique was employed for the salinity sensor to understand the bulk and interfacial phenomenon. An Agilent 4294A impedance analyzer was used to record the impedance spectra of the parallel plate sensor system. Complex nonlinear squares (CNLS) fitting was used to analyze the generated experimental data.
3. Results and discussion
3.1. Novolac AZ and Accuflo Coated Parallel plate Salinity Sensor
Figure 4(A-a) shows the Complex plane impedance diagram of copper electrode coated with Novolac AZ in 34.471 power supply unit (PSU) sea water. In Figure 4(A), generation of semicircle in the Complex impedance plane is attributed to the convolution of coating and corrosion response [21]. Figure 4(A-b) shows the equivalent circuit used for data fitting and parameter extraction, and it includes the coating elements and interfacial elements [22-24]. The model consists of solution resistance in series with a parallel combination of coating capacitance and pore resistance. Each pore provides an ionic pathway; hence, electro-migration and diffusion proceed in the pores leading to a charge transfer at the electrode and double layer formation.
The overall impedance of the equivalent circuit of Figure 4(A-b) is given by,
 (5)
(5)
where, Rpore is the pore resistance, Rct is the charge transfer resistance, Ccoat is the coating capacitance, Cdl is the double layer capacitance and Rsol is the solution resistance.
Figure 4(B-a) shows the complex plane impedance plot of the Accuflo coated copper electrode. The shape of the curve indicates a low frequency Constant Phase Element (CPE) process in series with a parallel combination of pore capacitance and pore resistance. Figure 4(B-a) and the circuit (Figure 4(B-b)) reveal good coating properties, which is indicated by the absence of charge transfer resistance, that represents the corrosion process. Circuit shown in Figure 4(B-b) was used to model the impedance data of Figure 4(B-a). The overall impedance of this circuit is given by,
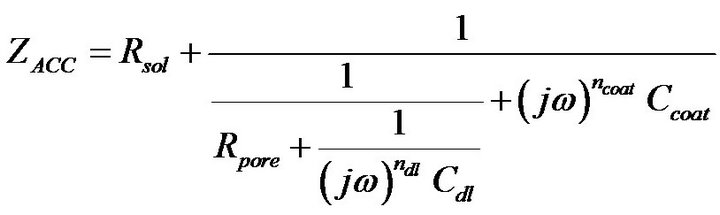 (6)
(6)
where, ω is the angular frequency. The CPE1, is a constant phase element, which represents pore capacitance. The impedance of a constant phase element is given by the expression, 1/A*(j*ω)n, where A is the magnitude of the element, ω = 2*pi*f, is the angular frequency, and f is
(A) (B)
(B) 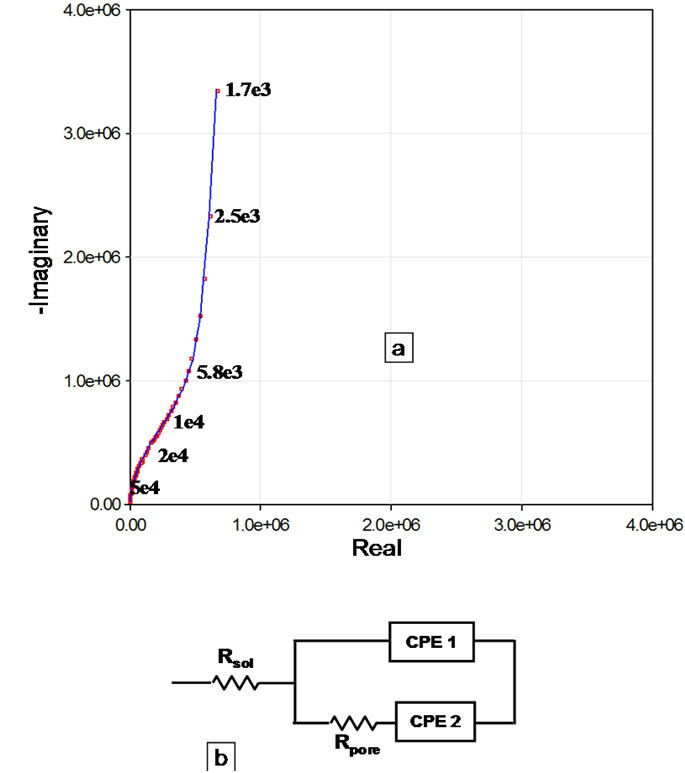
Figure 4. Complex plane impedance response of parallel plate conductivity sensor system with (A) (a) Novolac coating. (b) Equivalent circuit used to parameterize the impedance data. (B)(a) Accuflo (b) Equivalent circuit used to parameterize the impedance data. Points represent measured data and line shows the fitting curve.
the frequency in Hertz. The parameter n is such that if n = 1, the impedance of a CPE is that of an ideal capacitor and when n = 0, the CPE is a pure resistor. The parameter CPE2 represents the electrical double layer effects. Even though the use of CPE yielded better quality than using discrete capacitances, the CPE power factors, α, is close to unity, indicating proximity to pure capacitor behavior. The overall impedance response might also be affected by the polymer film relaxation, [25,26] introducing the slight frequency dependence to film and interfacial capacity.
3.2. Twin-T Oscillator Response with Novolac Resin and Accuflo Passivation Layer
Figure 5(A) shows the Twin-T oscillator with Novolac resin coating response to the variation in salinity of sea water. The frequency drift in the output for constant salinity of the solution was found to be ~400 Hz. This large frequency drift indicate the poor dielectric characteristics of Novolac. The frequency of the oscillator was observed to increase with increasing salinity. The oscillator frequency is inversely proportional to the capacitance of the sensor and hence, as salinity increases, the capacitance decreases, resulting in increased frequencies. The change in frequency was observed to be ~500 Hz for 0.0875 PSU change in salinity. It is observed from Figure 5(A) that, as temperature increases the oscillator frequency increases. This is because the sensor’s capacitance decreases with increasing temperature. Hence, frequency of the oscillator increases with temperature. The frequency was observed to shift by 0.12 KHz for every 5˚C.
Figure 5(B) shows the Twin-T oscillator’s with Accuflo as insulation layer response for varying salinities at 22˚C. The oscillator frequency was observed to increase by 0.058 KHz for every 0.14 PSU change in salinity which implies a sensitivity of 0.41 KHz/PSU. Further, with Accuflo as the insulation layer, good stability was achieved in the output of the oscillator. The frequency was observed to drift only by ± 10 Hz about a mean value at constant salinity and temperature.
3.3. Optical Characterization of Novolac Resin and Accuflo Coated Sensors
Two sensors, one coated with Novolac and the other coated with Accuflo were characterized using optical observations (data not shown). After 48 hours of immersion in ocean water sample at room temperature indicated that the Novolac coating is severely compromised, whereas Accuflo coating maintained its structural integrity during the period of exposure. These observations were found consistent with the EIS analysis of the two polymers, where it was found that the pore resistance of Novolac was three orders of magnitude lower than that of
(A)  (B)
(B) 
Figure 5. Twin-T Oscillator frequency vs salinity at 22˚C and frequency vs temperature at 34.471 power supply unit (PSU) salinity for (A) Novolac and (B) Accuflo.
Accuflo. Pore resistance represents the cross sectional dimension of the electrolytic pathway that connects the electrolyte to the electrode metal. The larger the pore resistance means smaller the pathway and hence lesser the corrosion.
The shape of the Nyquist plot itself provides a good inferential tool to predict coating failure. For example, the low frequency portion of the complex plane impedance plot of Accuflo is projected away from the real axis, as opposed to Novolac, for which it is approaching the real axis. The approach to real axis indicates a resistive mechanism at low frequencies, which is the corrosion mechanism. A straight line-like low frequency behavior parallel to the imaginary axis, such as the one seen for Accuflo, indicates a capacitive blocking behavior at low frequencies, which indicate an absence or very small amount of corrosion. Thus, visual observation of these plots could be used as visual corrosion diagnostic.
3.4. Response of F-V Converter Circuit
From the impedance analysis performed earlier, it was determined that Honeywell Inc’s proprietary (Accuflo) spin-on-polymer is more suitable as a dielectric layer for this application than Novolac. Hence, it was selected as the coating material of choice for the salinity sensor. Experiments were performed to determine its sensitivity using the Frequency to Voltage conversion scheme discussed in section 2.2.
From Figure 6, it is clear that the output voltage decrease with increasing salinity. This is because the output voltage is proportional to the sensor capacitance. For a change in salinity of 0.07 PSU, the change in output voltage was obtained as 0.7 mV. Thus, the sensitivity of this detection circuit is 10 mV/PSU. Further, the effect of temperature on the output voltage was studied in this experiment, at constant salinity of 34.65 PSU. The output voltage was observed to follow a decreasing trend with a temperature due to the capacitance drop with increasing temperature. Sensitivity of this approach to variations in temperature was found to be equal to 6.3 mV/˚C.
4. Conclusion
A polymer coated parallel-plate capacitive salinity sensor was fabricated and tested for salinity monitoring in marine environment. The use of standard PCB process for sensor fabrication provided low cost and mass fabrication. The EIS investigations on two polymeric materials as possible electrode passivation coatings for corrosion inhibition, namely, Novolac resin polymer (Novolac) and a proprietary commercial organic polymer (Accuflo™) reveals that Accuflo maintains its structural integrity, whereas Novolac is severely compromised and the underlying electrode undergo corrosion, which is in agreement with optical observations of the sensors after 48 hours of immersion in ocean water. Optimization of the sensor geometry was performed using Finite Element Modeling for fringe field reduction and interference minimization. By the addition of guard ring around one of the electrodes; the capacitance was observed to fall by 10%. In salinity detection strategies the Twin-T oscillator based detection circuit provided a sensitivity of 410 Hz/

Figure 6. Output voltage versus Salinity at 22˚C and output voltage versus temperature at 34.65 PSU.
PSU and enhanced frequency stability of the oscillator, with Accuflo as the electrode barrier layer. Whereas, the adoption of frequency-to-voltage conversion approach eliminated the effects due to drift in source frequency and sensitivity of this detection circuit was found to be 10 mV/PSU. Results indicate that Accuflo coating with Twin-T oscillator design can be used as effective sensor for monitoring of salinity under harsh conditions of sea water.
5. Acknowledgement
Authors are thankful to University of South Florida, Tampa, FL, USA, for providing facility and funding to carry out experimental work for this study.
REFERENCES
- D. Roemmich and J. Gilson, “The 2004-2008 Mean and Annual Cycle of Temperature, Salinity, and Steric Height in the Global Ocean from the Argo Program,” Progress in Oceanography, Vol. 82, No. 2, 2009, pp. 81-100. doi:10.1016/j.pocean.2009.03.004
- J. Church, P. L. Woodworth, T. Aarup and S. Wilson, “Ocean Temperature and Salinity Contributions to Global and Regional Sea-Level Change,” In: J. A. Church, P. L. Woodworth, T. Aarup and W. S. Wilson, Eds., Understanding Sea-level Rise and Variability, Wiley, UK, 2010, pp. 143-176. doi:10.1002/9781444323276.ch6
- H. V. Thurman and A. P. Trujillo, “Essentials of Oceanography,” Prentice Hall, Upper Saddle River, NJ, 2002.
- R. H. Stewart, “Temperature, Salinity, and Density,” In: R. H. Stewart, Ed., Introduction to Physical Oceanography, Prentice Hall, 2008, pp. 73-102.
- H. U. Sverdrup, “Oceanography for Meteorologists,” Prentice-Hall, Inc., New York, 1942. doi:10.5962/bhl.title.17039
- S. H. Jury, M. T. Kinnison, W. H. Howell and W. H. Watson, “The Effects of Reduced Salinity on Lobster (Homarus Americanus Milne-Edwards) Metabolism: Implications for Estuarine Populations,” Journal of Experimental Marine Biology and Ecology, Vol. 176, No. 2, 1994, pp. 167-185. doi:10.1016/0022-0981(94)90183-X
- NASA Oceanography, Sea Surface Salinity. http://science.hq.nasa.gov/oceans/physical/SSS.html
- R. G. Perkin and E. L. Lewis, “The Practical Salinity Scale 1978: Fitting the Data,” IEEE Journal of Oceanic Engineering, Vol. 5, No. 1, 1980, pp. 9-16. doi:10.1109/JOE.1980.1145441
- UNESCO, “Algorithm for Computation of Fundamental Properties of Seawater,” UNESCO Technical Papers in Marine Sciences, Vol. 36, 1983, p. 36.
- V. Klemas, “Remote Sensing of Sea Surface Salinity: An Overview with Case Studies,” Journal of Coastal Research, Vol. 27, No. 5, 2011, pp. 830-838. doi:10.2112/JCOASTRES-D-11-00060.1
- M. L. Heron, A. Prytz, T. Stieglitz and D. M. Burrage, “Remote Sensing of Sea Surface Salinity: A Case Study in the Burdekin River, North-Eastern Australia,” Gayana (Concepc.), Vol. 68, No. 2, 2004, pp. 278-283. doi:10.4067/S0717-65382004000200050
- M. L. Menn, J. L. de Bougrenet de la Tocnaye, P. Grosso, L. Delauney, C. Podeur, P. Brault and O. Guillerme, “Advances in Measuring Ocean Salinity with an Optical Sensor,” Measurement Science and Technology, Vol. 22, No. 11, 2011, pp. 1-8. doi:10.1088/0957-0233/22/11/115202
- D. Malarde, Z. Y. Wu, P. Grosso, J. L. de Bougrenet de la Tocnaye and M. L. Menn, “High-resolution and compact refractometer for salinity measurements,” Measurement Science and Technology, Vol. 20, No. 1, 2009, Artical ID: 015204. doi:10.1088/0957-0233/20/1/015204
- G. R. Langereis, “An Integrated Sensor System for Monitoring Washing Purposes,” University of Twente, Netherlands, 1999.
- B. H. Timmer, O. W. Sparreboom, P. Bergveld and A. Berg van den, “Planar Interdigitated Conductivity Sensors for Low Electrolyte Concentrations,” Proceedings Semiconductor Sensor and Actuator Technology, 2001, pp. 878-883.
- W. Fritz and T. Fritz, “A Parallel-Plate Capacitor Used to Determine the Complex Permittivity of Supercooled Aqueous Solutions in the 1 MHz Range,” Measurement Science and Technology, Vol. 7, No. 8, 1996, pp. 1190. doi:10.1088/0957-0233/7/8/018
- W. C. Heerens, “Multi-Terminal Capacitor Sensors,” Journal of Physics E: Scientific Instruments, Vol. 15, No. 1, 1982, pp. 137-141.
- H. Golnabi, “Guard-Ring Effects on Capacitive Transducer System,” Scientia Iranica, Vol. 7, No. 1, 2000, pp. 25- 31.
- R. Mancini, “Op Amps for Everyone: Design Reference,” Newnes, 2003.
- Electronic Datasheet, “NJM4151: V-F/F-V Converters,” New Japan Radio Co., Ltd. http://www.experimentalistsanonymous.com/diy/Datasheets/NJM4151.pdf
- I. Thompson and D. Campbell, “The Development of a Non-Contact Probe for A.C. Impedance Measurements,” Corrosion Science, Vol. 37, No. 1, 1995, pp. 67-78. doi:10.1016/0010-938X(94)00107-H
- A. R. A. Rahman, S. Bhat and S. Bhansali, “Design, Fabrication, and Impedance Characterization of a Capacitance-Based Salinity Sensor for Marine Applications,” Journal of the Electrochemical Society, Vol. 155, No. 12, 2008, pp. J355-J360. doi:10.1149/1.2981045
- D. Loveday, P. Peterson and B. Rodgers, “Evaluation of Organic Coatings with Electrochemical Impedance Spectroscopy, Part 3: Protocols for Testing Coatings with EIS,” JCT Coatingstech, Vol. 2, No. 13, 2005, pp. 22-27.
- G. P. Bierwagen, L. He, J. Li, L. Ellingson and D. E. Tallman, “Studies of a New Accelerated Evaluation Method for Coating Corrosion Resistance—Thermal Cycling Testing,” Progress in Organic Coatings, Vol. 39, No. 1, 2000, pp. 67-78. doi:10.1016/S0300-9440(00)00106-5
- S. Duval, M. Keddam, M. Sfaira, A. Srhiri and H. Takenouti, “Electrochemical Impedance Spectroscopy of Epoxy-Vinyl Coating in Aqueous Medium Analyzed by Dipolar Relaxation of Polymer,” Journal of the Electrochemical Society, Vol. 149, No. 11, 2002, pp. B520-B529. doi:10.1149/1.1512667
- W. Strunz, C. A. Schiller and J. Vogelsang, “The Evaluation of Experimental Dielectric Data of Barrier Coatings in Frequencyand Time Domain,” Electrochimica Acta, Vol. 51, No. 8-9, 2006, pp. 1437-1442. doi:10.1016/j.electacta.2005.02.122
NOTES
*Corresponding author.