Open Journal of Fluid Dynamics
Vol.04 No.05(2014), Article ID:52854,6 pages
10.4236/ojfd.2014.45034
Determination of Aerodynamic Sound Sources on Periodicity Noise Generated from a Micro Wind Turbine
Soichi Sasaki, Ryo Sakada, Kota Suzuki
Graduate School of Engineering, Nagasaki University, Nagasaki, Japan
Email: souichi@nagasaki-u.ac.jp
Copyright © 2014 by authors and Scientific Research Publishing Inc.
This work is licensed under the Creative Commons Attribution International License (CC BY).
http://creativecommons.org/licenses/by/4.0/


Received 26 October 2014; revised 19 November 2014; accepted 17 December 2014
ABSTRACT
To discuss the relationship between the periodicity noise and the aerodynamic noise source of a wind turbine, the characteristics of the actual wind turbine were measured by a wind tunnel; moreover, the flow around the impeller immersed in the uniform flow was solved by numerical simulation. In the observed wind turbine, when the mainstream velocity was 7.4 m/s or more, the power coefficient reached maximum at tip speed ratio 8. When the mainstream velocity increased in the driving condition of the maximum power point, the aerodynamic noise increased due to the periodicity noise in the vicinity of 1000 Hz and the broadband noise in the high-frequency domain. The noise sources were concentrated at the leading edge and trailing edge on the suction surface side. We experimentally indicated that the pressure fluctuation of the leading edge was the source of the periodicity noise.
Keywords:
Aerodynamic Noise, Wind Turbine, Renewable Energy

1. Introduction
A micro wind turbine can be used in a variety of ways; for instance, backup power at a time of disaster, an auxiliary power supply in a public place, power supply in an isolated place, and so on. Moreover, because a wind turbine is subject to a Feed-in Tariff that has been executed since July 2013, it is also expected to be used as a power supply for a smart grid. However, the aerodynamic noise of the wind turbine, which is driven by a general composition, becomes 80 dB or more. Solving this noise problem is one of the important technical issues for the development of this renewable energy. Although a low-frequency vibration can be the cause of the noise that occurs in a large-scale wind turbine [1] , such a noise differs from the main factor of the aerodynamic noise from a micro wind turbine. Our research group is experimentally investigating the relation between the aerodynamic noise generated from a micro propeller wind turbine and the flow around the impeller [2] [3] . We have experimentally confirmed that there are two types of aerodynamic noise: 1) the broadband noise distributed over the domain in the high frequency of 1000 Hz or more; and 2) the periodicity noise in the specific frequency. The former is similar to the characteristics of trailing edge noise. An early model for this noise was established by Amiet and Howe in the 1970s [4] [5] . Roger and Moreau extended Amiet’s trailing edge noise model to the limited chord length model [6] [7] ; then, they indicated that the broadband noise in the high-frequency domain is closely related to trailing edge noise. However, for the latter periodicity noise, there are many unconfirmed results. In the future, if it is supposed that such a wind turbine is positively utilized in our life environment, the elucidation of the physical mechanism of the periodicity noise in the audio frequency band in the vicinity of 1000 Hz will be an important technical issue.
In this study, the relationship between the source of the periodicity noise and the flow is discussed. The aerodynamic characteristics and the noise of the turbine are measured by a wind tunnel, and the wake of the impeller immersed in the uniform flow is measured by a hot-wire anemometer. Based on the analysis of the pressure fluctuation quantities on the blade surface of the numerical simulation, we discuss the sources of the periodicity noise.
2. Experimental Procedure
The experimental apparatus of the wind turbine is shown in Figure 1. The specifications are summarized in Table 1. The diameter of the impeller is 1170 mm, there are three blades, and the design output is 400 W. In the experimental apparatus, the three-phase induction motor (Mitsubishi Electric Co., Ltd., SF-JR 400 W) for giving the reaction torque and the torque meter (Ono Sokki, SS-020) are used. This experimental setup can directly measure the mechanical output of the turbine. The rotational speed of the impeller is measured by the photoelectric rotation speed meter.
Figure 2 shows the schematic view of the suction wind tunnel. The wind tunnel is composed of a collector, a measurement duct, a nozzle, a deformed duct, and an axial flow fan. A honeycomb with 1 mm of the two stages is attached to the collector, and the turbulence of the incoming flow is removed by the honeycomb. The section of the measurement duct is 3.24 m2, and the entire length is 5000 mm. The choke mechanism with a diameter of 1200 mm is provided to obtain enough uniform velocity to turn the impeller of the wind turbine. The mainstream velocity in the wind tunnel is controlled by the inverter of the axial flow fan. To estimate the aerodynamic characteristics of the wind turbine, the output coefficient Cp and the tip speed ratio λ are defined in Equation (1).
 (1)
(1)
where R is the radius of the impeller, ω is the angular speed, V is the mainstream velocity, T is the torque, ρ is the density of air, and A is the swept area. A 1/2-in. microphone (Ono Sokki; LA-4350) is set at a distance of 1.0 m from the impeller inlet on the rotational axis of the impeller. The frequency content of the delivered signal is provided by a FFT analyzer (Ono Sokki; CF5210).
The measurement method of the impeller in the wake is shown in Figure 3. X-type hot wire is used for the measurement of the wake. The hot-wire probe is moved at a position of 900 mm from the floor face by the traverse machine. The measurement region of the flow field in the wake is 540 mm to the span direction and is 600 mm to the mainstream direction; the initial measurement position of the wake is 50 mm from the rear side of the trailing edge; the measurement interval is 20 mm. The whole flow field is divided by 15 blocks because the span of the traverse machine cannot reach the whole span for the measurement flow field.
The model of the wind turbine used by the numeric simulation is shown in Figure 4. SCRYU/Tetra of Cradle Co. Ltd. is used for the numeric simulation. The flow rate of the actual measurement in the wind tunnel is given to the inlet boundary, and the atmospheric pressure is given to the exit boundary. The entire flow field is composed of approximately 7.5 million elements. The rotation of the impeller is analyzed with the sliding mesh. The time step is set as 3.125 × 10⁻⁵ s; in this condition, the periodic phenomenon in 2000 Hz can be analyzed by 16 points.

Table 1. Specifications of the wind turbine.
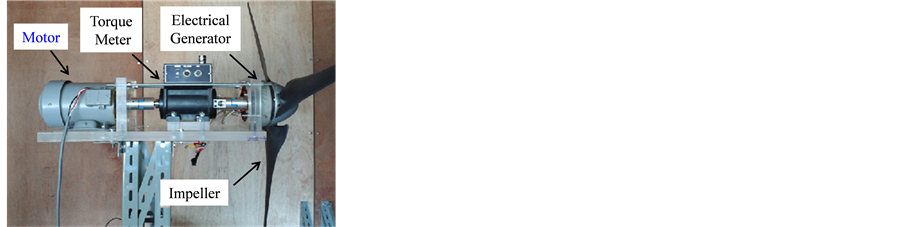
Figure 1. Experimental apparatus of a micro wind turbine.

Figure 2. Suction wind tunnel.

Figure 3. Measurement method of the wake.
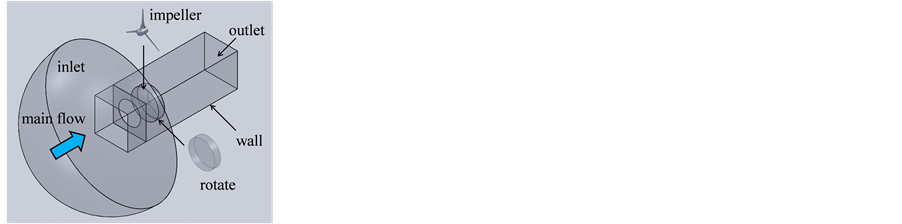
Figure 4. Model for the computational fluid dynamic.
3. Results and Discussion
Figure 5 compares the relations of the output coefficient with the tip speed ratio of the wind turbine in each mainstream velocity. When the mainstream velocity becomes 7.4 m/s or more, the output coefficient reaches the maximum value in the vicinity of tip speed ratio 8. In the following discussion, we discuss the characteristics of the wind turbine by comparing the maximum output point and the free torque condition.
The relation of the tip speed ratio and the aerodynamic noise is shown in Figure 6. In the vicinity of tip speed ratio 8, the noise level of the wind turbine is increased because the impeller is rotating with a high rotating speed due to the fast mainstream velocity. However, in the case of tip speed ratio 11, the difference of the noise levels is little because the flow around the impeller is strongly perturbed.
Figure 7 compares the spectrum distributions of the noise. Figure 7(a) shows the mainstream velocity; Figure 7(b) shows the tip speed ratio. The dashed line is the background noise of the wind tunnel in the case of the mainstream velocity of 8.7 m/s. In Figure 7(a), the periodicity noise in the vicinity of 1000 Hz is generated in each mainstream velocity. When the mainstream velocity increases, the periodical frequency becomes high. At the time, the noise level increases. Figure 7(b), the mainstream velocity is set at 8.7 m/s. The noise level of tip speed ratio 11 becomes 5.7 dB larger than that of tip speed ratio 8. The noise level of the periodicity noise in approximately 1000 Hz of the wind turbine in tip speed ratio 11 is smaller than that of the noise level of the turbine in tip speed ratio 8.
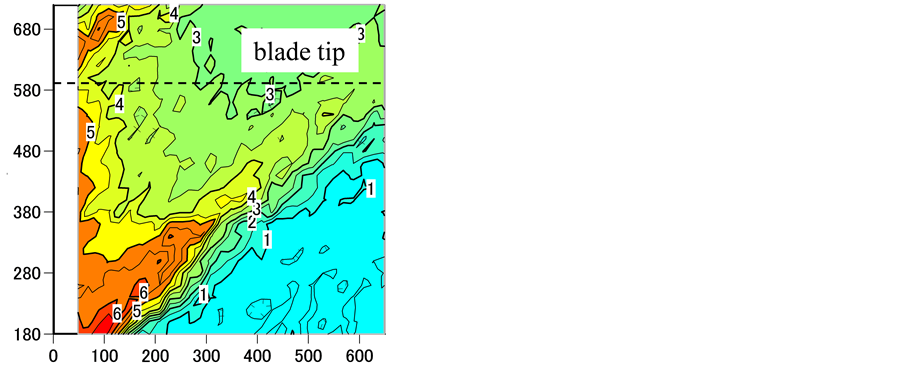
The velocity distribution of the wake is presented in Figure 8. Figure 8(a) shows tip speed ratio 8; Figure 8(b) shows tip speed ratio 11. The mainstream velocity is passing through to the wake in both cases because the cir- cumferential velocity is slow in the hub side. In the case of tip speed ratio 8, the wake of 5 m/s is distributed in the wide-span domain, whereas in the case of tip speed ratio 11, the wake has no speed in the mid-span because the mainstream velocity is not passing through the impeller. Thus, the mainstream velocity is passing through
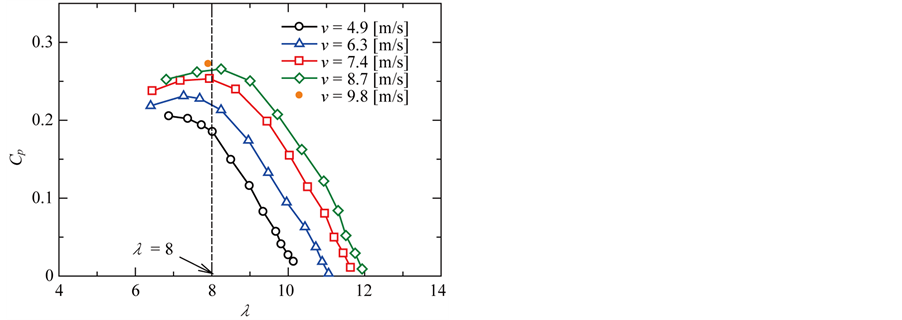
Figure 5. Aerodynamic characteristics.
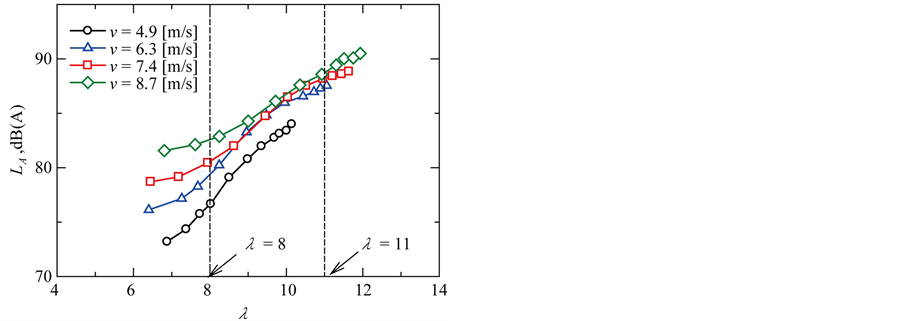
Figure 6. Noise characteristics.

 (a) (b)
Figure 7. Comparison of the noise spectra generated from the wind turbine. (a) Mainstream velocity; (b) Tip speed ratio.
 (a) (b)
Figure 8. Distribution of the velocity in the wake (V = 7.4 m/s). (a) λ = 8; (b) λ = 11.
from the blade-tip side. According to this process, because the main flow is inclined to the blade-tip side, this profile indicates that the velocity of the blade-tip side in tip speed ratio 11 becomes faster than that of tip speed ratio 8.
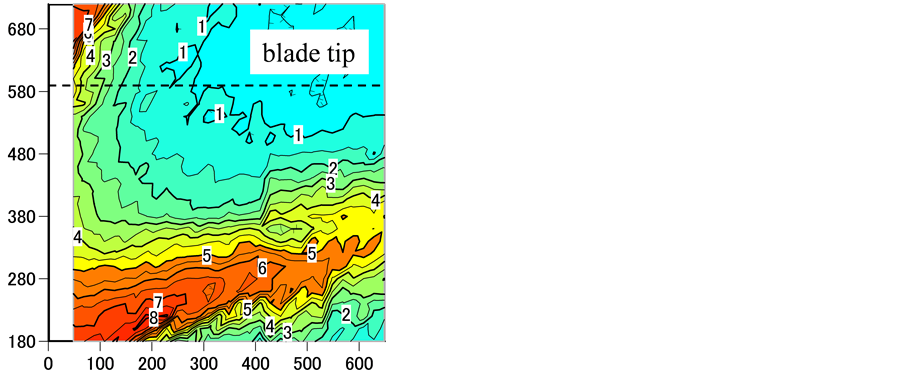
Figure 9 shows the distribution of the velocity fluctuation quantities. The velocity fluctuation at the blade-tip side in tip speed ratio 8 becomes larger than that of tip speed ratio 11. In the case of tip speed ratio 8, it is considered that the share layer at the blade-tip side is so easily formed that the structural vortex is formed at the blade-tip side. The tendency of the relation of the velocity fluctuation quantities agrees with the tendency of the level of periodicity noise.
In Figure 10, the distribution of the pressure fluctuation on the suction surface side is analyzed in each span position. The pressure fluctuation at the blade-tip side is concentrated to the leading edge and the trailing edge. Reference [7] has explained the pressure fluctuation at the trailing edge is the noise source of the broadband noise in the high-frequency domain.
The spectrum distribution of the pressure fluctuation at the leading edge is shown in Figure 11. When the mainstream velocity increases, the periodical phenomena fluctuate in the high-frequency domain. This tendency agrees well with the spectra of the aerodynamic noise. However, in the vicinity of the trailing edge, we confirmed that there is no periodic phenomenon. These results indicate the pressure fluctuation at the leading edge is the major cause of the periodicity noise.

 (a) (b)
Figure 9. Distribution of the velocity fluctuation in the wake (V = 7.4 m/s). (a) λ = 8; (b) λ = 11.
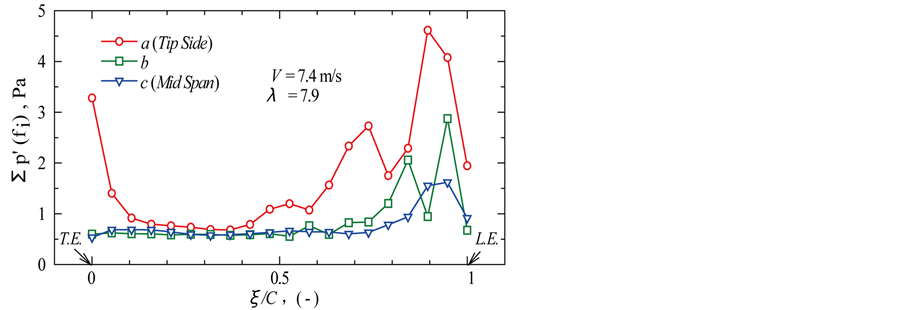
Figure 10. Pressure fluctuation distribution on the blade chord.
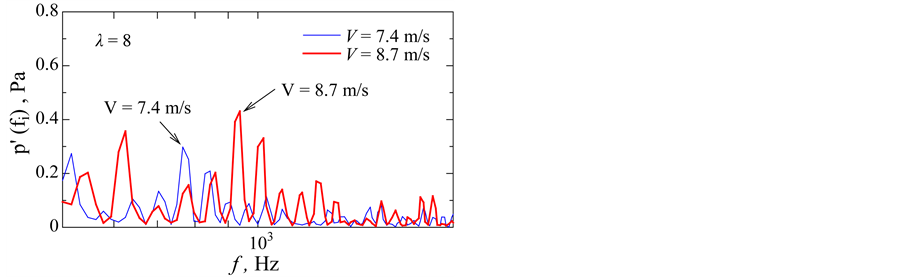
Figure 11. Spectral distribution of the pressure at the leading edge.
4. Conclusion
When the mainstream velocity reaches 7.4 m/s or more, the output coefficient reaches maxima at tip speed ratio 8. The aerodynamic noise of the wind turbine in the maximum output point increases due to the periodicity noise and the broadband noise in the high-frequency domain. The pressure fluctuation on the blade-tip side is concentrated to the leading edge and the trailing edge. We determined that the pressure fluctuation at the leading edge is the source of the periodicity noise.
References
- Nii, Y., Gotanda, T., Matsumiya, H., Yamane, T. and Kawamura, S. (1992) Impulsive Low-Frequency Noise Generation by a 15 m Diameter Horizontal Axis Wind Turbine Generator with Downwind Configuration. Journal of the Acoustical Society of Japan, 13, 259-265. http://dx.doi.org/10.1250/ast.13.259
- Sasaki, S., Suzuki, K. and Sakada, R. (2014) Study of Output Characteristics and Broadband Noise of a Micro Propeller Wind Turbine. Reports of Graduate School of Engineering, Nagasaki University, 44, 1-6.
- Sasaki, S. and Sakada, R. (2014) Study of Aerodynamic Noise Source of Periodical Noise Generated from a Micro Wind Turbine. Reports of Graduate School of Engineering, Nagasaki University, 44, 1-6.
- Amiet, R.K. (1976) Noise Due to Turbulent Flow past a Trailing Edge. Journal of Sound and Vibration, 47, 387-393. http://dx.doi.org/10.1016/0022-460x(76)90948-2
- Howe, M.S. (1978) A Review of the Theory of Trailing-Edge Noise. Journal of Sound and Vibration, 61, 437-465. http://dx.doi.org/10.1016/0022-460x(78)90391-7
- Roger, M. and Moreau, S. (2005) Back-Scattering Correction and Further Extensions of Amiet’s Trailing Edge Noise Model. Part I: Theory, Journal of Sound and Vibration, 286, 477-506. http://dx.doi.org/10.1016/j.jsv.2004.10.054
- Moreau, S. and Roger, M. (2009) Back-Scattering Correction and Further Extensions of Amiet’s Trailing Edge Noise Model. Part II: Application, Journal of Sound and Vibration, 323, 397-425. http://dx.doi.org/10.1016/j.jsv.2008.11.051
Nomenclature
A: swept area (m2)
Cp: power coefficient
f: frequency (Hz)
LA: A-weighted sound pressure level (dB (A))
p′: pressure fluctuation (Pa)
R: radius of impeller (m)
T: torque (Nm)
V: mainstream velocity (m/s)
Greek Letters
λ: power coefficient
ρ: density of air (kg/m3)
ω: angular velocity (rad/s)