Open Journal of Medical Imaging
Vol.4 No.1(2014), Article ID:43549,8 pages DOI:10.4236/ojmi.2014.41004
Impact of Standardized Scheme on the Detection of Chest X-Ray Abnormalities and Radiographic Diagnosis of Pulmonary Tuberculosis in Adult
Marie Laure Gharingam1, Boniface Moifo1,2*, Eric Walter Pefura Yone1,3,4, André Pascal Kengne5, Jean Roger Moulion Tapouh2, Annick Laure Edzimbi2, Georges Nguefack-Tsague1,6, Samuel Nko’o Amvene1,2
1Faculty of Medicine and Biomedical Sciences, The University of Yaoundé I, Yaounde, Cameroon
2Department of Medical Imaging and Radiation Therapy, The University of Yaoundé I, Yaoundé, Cameroon
3Department of Internal Medicine and Specialties, The University of Yaoundé I, Yaoundé, Cameroon
4Service of Pulmonology, Yaounde Jamot Hospital, Yaounde, Cameroon
5South African Medical Research Council & University of Cape Town, Cape Town, South Africa
6Department of Public Health, The University of Yaoundé I, Yaoundé, Cameroon
Email: mclor01@yahoo.fr, *bmoifo@yahoo.fr, pefura2002@yahoo.fr, apkengne@yahoo.com, tapouh@yahoo.fr, eannickl2001@yahoo.fr, nguefacktsague@yahoo.fr, nkoo_as@yahoo.com
Copyright © 2014 by authors and Scientific Research Publishing Inc.
This work is licensed under the Creative Commons Attribution International License (CC BY).
http://creativecommons.org/licenses/by/4.0/


Received 13 November 2013; revised 10 December 2013; accepted 19 February 2014
ABSTRACT
Purpose: The complexity of chest radiography (CXR) is a source of variability in its interpretation. We assessed the effect of an interpretation grid on the detection of CXR anomalies and radiographic diagnosis of tuberculosis in an endemic area for tuberculosis. Methods: The study was conducted in Yaounde (Cameroon). Six observers (2 pulmonologists, 2 radiologists and 2 senior residents in medical imaging) interpreted 47 frontal CXR twice two months apart without (R1) and with (R2) the aid of an interpretation grid. We focused on the detection of micro nodules (n = 16), cavitations (n = 12), pleural effusion (n = 6), adenomegaly (n = 6), and diagnosis of tuberculosis (n = 23) and cancer (n = 7). Results: The average score for accurate detection of elementary lesions was 40.4% [95%CI: 25% - 58.3%] in R1 and 52.1% [36.9% - 65.3%] in R2. The highest improvement was observed for micro nodules (19.8%). Cavitations had the highest proportions of accurate detections (58.3% in R1 and 65.3% in R2). The average score of accurate diagnosis was 46.1% in R1 and 57.4% in R2. Accurate diagnosis improved by 3.6% for tuberculosis and 19% for cancer between R1 and R2. Intra-observer agreement was higher for the diagnosis of cancers (0.22 ≤ ( ≤ 1) than for diagnosing tuberculosis (0.21 ≤ ( ≤ 0.68). Inter-observer agreement was highly variable with a modest improvement for the diagnosis of tuberculosis in R2. Conclusion: Standardized interpretation scheme improved the detection of CXR anomalies and diagnosis of tuberculosis. It significantly improved inter-observer’s agreement in diagnosing tuberculosis but not in detecting most lesions.
Keywords:Chest Radiography; Interpretation Scheme; Tuberculosis; Micro Nodules; Cavitations; Agreement

1. Introduction
In spite of numerous advances in cross-sectional thoracic imaging, chest radiography (CXR) remains the leading imaging modality for the exploration, diagnosis and monitoring of many chest diseases [1] [2] . In most circumstances, it is the first-line imaging modality and frequently the only diagnostic imaging test used in patients with confirmed or suspected chest disease [1] -[4] .
The role of CXR in the screening and diagnosis of pulmonary tuberculosis (TB) is well established [5] -[8] . But the complexity of CXR image is a source of variability in the diagnosis of TB and lung diseases in general [5] [6] [9] [10] . In most sub-Saharan Africa countries where TB is endemic, CXR is very often the only available or accessible chest imaging test [11] [12] . Many CXR interpretation schemes have been developed in some countries in order to reduce interpretation discrepancies [5] [13] -[15] . However, we are not aware of studies on the benefit of a CXR standardized interpretations grid in sub-Saharan African countries.
Inspired by the Chest Radiography Reading and Recording System (CRRS) and Japan-Vietnam Chest x-ray Coding System (JVCS) reading systems [6] [9] , we developed a new CXR interpretation scheme and assessed its effect on the detection of CXR anomalies and radiographic diagnosis of pulmonary tuberculosis in adults Cameroonians.
2. Materials and Methods
This was an intervention study, carried out in Yaoundé (the Capital city of Cameroon) between December 2012 and February 2013. The study was approved by the Ethics Committee of the Faculty of Medicine and Biomedical Sciences and the administrative authorities of the Yaounde Jamot Hospital.
2.1. Development of the Interpretation Grid
A group comprising one experienced radiologist, one experienced pulmonologist, one final year specialist radiologist in training and one final year medical student developed the CXR interpretation grid based on an adaptation of the “Chest radiograph reading and recording system” CRRS [9] and “Japan-Vietnam CXR coding system” JVCs [6] (see appendix). The new grid was pre-tested before application for this study. The new grid included: one section for parenchymal lesions, one for pleural lesions, one for mediastinal lesions, one for other damages and a last section for radiographic diagnosis.
2.2. Selection of Radiographs
CXR were selected from the department of pulmonology of the Yaounde Jamot Hospital (YJH), which is the largest referral and treatment center for chest diseases in Yaounde and its neighborhoods [16] . Selected CXR were all posterior-anterior incidences of good photographic and technical quality, in digital format, performed in patients of more than 15 years of age. A total of 47 CXR were selected for this study: 23 of pulmonary tuberculosis, seven of lung cancers, seven of bacterial pneumonia, six normal CXR and four with diffuse infiltrative lung disease. All abnormal CXR had a confirmed diagnosis of the disease via appropriate investigations.
2.3. Selection of Observers
Six readers chosen by convenience, participated in this study: two pulmonologists totalizing five and 13 years of experience, two radiologists with one and five years of experience, and two final year residents in medical imaging. These readers are identified as “radiologist 1 and 2”, “pulmonologist 1 and 2” and “resident 1 and 2”.
2.4. Interpretation Procedure
Interpretation consensus for each CXR was obtained by the review of all the CXR images by a group consisting of one radiologist and one pulmonologist (8 years of experience each) and one final year resident in medical imaging. For each CXR, the consensual interpretation determined the elementary radiographic lesions and the radiological diagnosis. The first session of interpretation (R1) by the six observers was in the usual reading conditions using a report form with one part focusing on detection of elementary lesions and the other focusing on radiologic diagnosis. During the second reading session (R2) two months later, interpretation was made on an interpretation grid (see appendix). Each participant was instructed on the use of that grid before the reading session but was not aware that it was the same CXR from the first reading session. Images were arranged in a different order compared to the first reading session order. Interpretations were performed under the same conditions for observers without limitation of reading time. The day and reading time were chosen at the convenience of the observer.
2.5. Data Collection and Analysis
The sample size was calculated using the “Kappa Size” package of the R statistic software, version 2.13.0 [17] -[20] . Based on an expected Kappa of 0.47 ± 0.13 [9] and a type I error of 0.05, the minimum sample size was 46 radiographs for six observers. A total of 47 radiographs were selected for this study. The elementary lesions and the following diagnosis were retained for analysis: pulmonary tuberculosis (n = 23), micro nodules (n = 16), caverns (n = 12), lung cancer (n = 7), pleural effusion (n = 6) and hilar or mediastinal adenomegaly (n = 6). The analysis focused on the accuracy of the detection of elementary lesions, diagnosis of pulmonary tuberculosis and lung cancer, the intra-observer and inter-observers agreement between the first and second reading. The data were entered and analyzed using SPSS 17 software (SPSS Inc., Chicago, USA). Kappa coefficient (k) was used to assess the agreement between the reading without grid and the reading with standardized grid. The following Kappa intervals and thresholds [18] were used to characterize the level of agreement: discordance (<0.0), low (0.0 - 0.20), poor (0.21 - 0.40), moderate (0.41 - 0.60), good (0.61 - 0.80), excellent (>0.81).
3. Results
The performance of our observers at detecting elementary lesions and making CRX diagnosis during the first reading session without standardized scheme (R1) and during the second session with standardized grid (R2) are shown in Table 1 for elementary lesions and in Table 2 for radiological diagnostics. Figure 1 shows four examples of CRX of this study. The average score of accurate detection of elementary lesions for all observers

Table 1. Proportion of anomalies accurately detected by each observer at each reading session and intra-observer agreement between the two sessions.
R1: first reading session without scheme, R2: second session with scheme, NA: not applicable.
Table 2. Proportion of accurate diagnosis given by each observer at each reading session and intra-observer agreement between the two readings.
R1: first reading session without scheme, R2: second session with scheme, NA: not applicable.
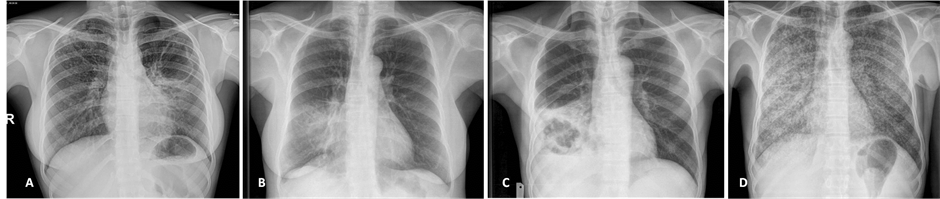
Figure 1. Examples of CXR included in this study. A: pulmonary TB with left apical cavity (cavern), mild consolidation of the lingula and ill-defined micronodules on the right upper lobe. B: bacterial pneumonia with middle lobe consolidation. C: excavated pulmonary carcinoma on the right lower lobe associated with mild pleural effusion. D: miliary tuberculosis with diffused micronodules on both lung fields.
was 40.4% (95% CI: 25% - 58.3%) in R1 and 52.1% (95% CI: 36.9% - 65.3%) in R2, indicating an improvement of 11.7% (95% CI: 7% - 11.9%). The average score of improvement in the detection of elementary lesions between R1 and R2 was 6.9% for cavitations, 8.3% for pleural effusions, 11.9% for adenomegaly and 19.8% for micronodules. Radiologist 1 had the highest overall score of accurate detection (63%). Cavitations had the highest proportion of accurate detection (58.3% in R1 and 65.3% in R2).
Based on the kappa statistics for the intra-observer’s agreement, the detection of micronodules significantly improved for all observers, with kappa statistics always lower than 1. Values ranged from 0.32 (95% confidence interval: 0.01 to 0.63) for radiologist 2 to 0.70 (0.42 to 0.97) for pulmonologist 1 (Table 1). With the exception of the two residents, the kappa statistics were also in favor of significant improvement in the detection of cavitations at R2, with values ranging from 0.06 (−0.24 to 0.36) for radiologist 1 to 0.45 (0.10 to 0.79) for pulmonologist 2. For adenomegaly and pleural effusion, significant improvement occurred for half and 2/3rd of observed respectively (Table 1).
The average score of accurate diagnosis for all observers was 46.1% in R1 and 57.4% in R2, indicating an improvement of 11.3% when using standardized grid. The overall improvement in the score of accurate diagnosis between R1 and R2 was 3.6% for tuberculosis and 19% for lung cancers. The pulmonologist 1 had the best overall score of accurate diagnosis (70.2%). With the exception of resident 2, significant improvement in the diagnosis of tuberculosis occurred in R2 with kappa statistics ranging from 0.21 (0.03 to 0.38) for resident 1 to 0.47 (0.28 to 0.65) for radiologist 1 (Table 2). Improved diagnosis of cancer based on the kappa statistic was significant only for radiologist 1 [kappa 0.22 (−0.22 to 0.63)], Table 2.
Variable inter-observers’ agreement in the detection of lesions and diagnosis of tuberculosis and cancer was observed at both reading time-points. Inter-observer’ agreement was poor-to-good for the detection of adenomegaly and micronodules, low-to-moderate for cavitations and diagnosis of tuberculosis, discordant-to-poor for pleural effusion, and poor-to-excellent for the diagnosis of lung cancer, with the exception of one pair for which discordance was noted (Table 3).
The direction of changes in the inter-observers’ agreement between R1 and R2 was also variable, favoring
Table 3. Kappa coefficient (95% confidence interval) for the inter-observer agreement in the detection lesions and diagnosis of tuberculosis and cancer at the first and second readings.
R1: first reading without scheme, R2: second reading with scheme.
both improvement, deterioration and no change. No consistent pattern of change was apparent across pairs of observers for any particular lesions, nor across all lesions and diagnosis within a given pair of observers (Table 3 ).
4. Discussion
An interpretation grid developed and used in our study had a broad positive impact on the detection of common lesions and the accuracy of diagnoses on chest X-rays in this setting. The observed improvement appeared to be more consistent across observers for micronodules, cavitations, diagnosis of tuberculosis and to a lesser extent the detection of adenomegaly.
The spectrum of the inter-observers’ agreement both before and after implementation of the interpretation grid was very broad, with inconsistent effects of the grid on the agreement both within pairs of observers for all possible lesions and diagnosis, and across pairs of observers for any specific lesion or diagnosis. Other studies that have used a standardized interpretation scheme have shown a significant improvement in the interpretation of CXR [5] [9] [10] [21] [22] . Indeed, the different sections of the grid are expected to impose to observers a more systematic approach to the analysis of each anomaly, thereby improving its detection. It’s the same when a list of diagnosis is suggested at the conclusion of an interpretation. The intra-observer’s agreement was excellent in over half of four observers for the detection of adenomegaly and diagnosis of cancers. This is consistent with poor-to-no impact of the grid on the performance of the observers. The kappa statistics for the inter-observer’s agreement in detection of elementary lesions was highly variable across observers, lesions/diagnosis and reading sessions. For accurate detection of pleural effusion and accurate diagnosis of TB, the kappa statistics for the inter-observer’s agreement were higher in R2 than in R1, indicating the positive impact of the grid in our study. This is in line to many studies where the standardized interpretation form significantly improved the concordance of reading; for example in South Africa with the CRRS [9] , the five categories reading system in Canada [10] , the three categories reading system in Switzerland [21] and the Russian classification [5] had. The lack of initial training prior the use of our interpretation grid could explain its limited impact on the interobserver’s agreement in accurate detection of some anomalies during R2 session. Den Boon and al submitted readers to three-days training on the use of CRRS with pre-tests prior to its application to the study [9] . The absence of clinical information would also have been a handicap for our observers. In fact, Schreiber et al. [23] have demonstrated that the clinical history improve interpretations of radiographs. Our readers were blinded to the clinical information to limit the influence on detection of radiographic lesions diagnosis. Understanding of clinical scenarios could take primacy over the ability of the observer to detect elementary lesions and set radiological diagnosis [24] .
The intra-reader’s agreement for accurate detection of cavitations ranged from poor to moderate for the pulmonologist, and from poor to mediocre for the radiologist. But cavitations had the best accurate detection in R1 and R2, a significant impact of the grid on intra-reader’s agreement and no significant impact of grid on inter-reader’s agreement. It is therefore possible that observers did not detect between the two reading sessions, the same caverns on the same picture. While the grid has improved the overall accuracy of detection, it did not significantly improve the concordance of the detection. Balabanova et al. [5] had found a moderate intra-reader’s agreement for both the pulmonologist and the radiologist. The intra-reader agreement for accurate detection of adenomegaly was poor to moderate for the radiologist and poor to excellent for the pulmonologist. Other authors such as Shinsaku et al. [6] and Graham et al. [10] obtained best matches in the same reader for the detection of adenomegaly.
Our study has some limitations such as the small number of some lesions, which precluded our ability to apply more advanced statistical method for assessing the improvement in diagnostic capability such as the net reclassification improvement. However, the distribution of anomalies and diagnosis, as well as readers, reflect the routine practice scenario in this setting. Unlike other studies where only a sample of readers and radiographs were selected to study the intra-reader’s variability, in our study all the six observers participated in two reading sessions and interpreted the same number of radiographs for each session. The interval between two reading sessions was long enough (2 months) to avoid image-memory effect on the second interpretation. After the text edit has been completed, the paper is ready for the template. Duplicate the template file by using the Save As command, and use the naming convention prescribed by your journal for the name of your paper. In this newly created file, highlight all of the contents and import your prepared text file. You are now ready to style your paper.
5. Conclusion
Standardized interpretation grid has a potential for improving the detection of common lesions and diagnosis of the most prevalent pulmonary diseases on chest X-ray in this setting. However, further validation by independent investigators is needed to confirm our finding. Furthermore, implementation studies are needed to confirm the acceptability of interpretation grids by healthcare practitioner in routine setting, and to identify the best strategies for promoting the uptake of the grids.
Acknowledgements
The authors thank all the “observers” who volunteered participate in this study.
Declaration of Interest
None for all authors.
References
- McAdams, H.P., Samei, E., Dobbins III, J. and Tourassi, D.G. (2006) Recent Advances in Chest Radiography. Radiology, 241, 663-683. http://dx.doi.org/10.1148/radiol.2413051535
- Remy, J., Remy-Jardin, M., Bonnel, F. and Masson, P. (2001) L’interprétation d’une Radiographie Thoracique Revue et Corrigée par la Tomodensitométrie. Journal de Radiologie, 82, 1067-1079.
- Moifo, B., Tambe, J., Pefura Yone, E.W. and Zeh, O.F. (2012) Assessing the Role of Routine Chest Radiography in Asymptomatic Students during Registration at a University in an Endemic Area of Tuberculosis. Annals of Tropical Medicine & Public Health, 5, 419-422. http://dx.doi.org/10.4103/1755-6783.105122
- Neossi Guena, M., Moifo, B., Pefura Yone, E.W. and Mankaa Wankie, M. (2011) Influence des Protocoles d’Examen sur la Qualité et les Performances Diagnostiques d’une TDM Thoracique: Expérience du Service d’Imagerie Thoracique du CHRU de Lille (France). Journal Africain d’Imagerie Médicale, 6, 277-289.
- Balabanova, Y., Cocker, R., Fedorin, I. and Zakharova, S. (2005) Variability in Interpretation of Chest Radiographs among Russian Clinicians and Implications for Screening Programmes: Observational Study. BMJ, 331, 1-4. http://dx.doi.org/10.1136/bmj.331.7513.379
- Sakurada, S., Nguyen Hang, T.L., Ishizuka, N. and Toyota, E. (2012) Inter-Rater Agreement in the Anormal Chest X-Ray Findings for Tuberculosis between Two Asian Countries. BMC Infectious Diseases, 12, 1-8. http://dx.doi.org/10.1186/1471-2334-12-31
- Van Cleeff, M.R., Kivihya-Ndugga, L.E., Meme, H. and Odhiambo, J.A. (2005) The Role of Performance of Chest X-Ray for the Diagnosis of Tuberculosis: A Cost Effectiveness Analysis in Nairobi, Kenya. BMC Infectious Diseases, 12, 111. http://www.biomedcentral.com/1471-2334/5/111
- Kumar, N., Bhargava, S.K., Agrawal, C.S. and George, K. (2005) Chest Radiographs and Their Reliability in the Diagnosis of Tuberculosis. Journal of the Nepal Medical Association, 44, 138-142.
- Boon, S.D., Bateman, E.D., Enarson, A.D. and Borgdorff, N.W. (2005) Development and Evaluation of a New Chest Radiograph Reading and Recording for Epidemiological Surveys of Tuberculosis and Lung Disease. The International Journal of Tuberculosis and Lung Disease, 9, 1088-1096.
- Graham, S., Gupta, K.D., Hidvegi, R.J. and Hanson, R. (2002) Chest Radiograph Abnormalities Associated with Tuberculosis: Reproductility and Yield of Active Cases. The International Journal of Tuberculosis and Lung Disease, 6, 137-142.
- OMS Global Tuberculosis Report 2012. http://apps.who.int/iris/bitstream/10665/75938/1/9789241564502_eng.pdf
- Boulhabal, F. and Chaulet, P. (2004) La Tuberculose en Afrique: Epidémiologie et Mesures de Lutte. Medecine Tropicale, 64, 224-228.
- Lorentz Quekel, G.B.A., Alphons Kessels, G.H., Goei, R. and Engelshoven, M.J.V. (2001) Detection of Lung Cancer on the Chest Radiograph: A Study on Observer Performance. European Journal of Radiology, 39, 111-116. http://dx.doi.org/10.1016/S0720-048X(01)00301-1
- Hopstaken, R.M., Witbraad, T., Van Engelshoven, J.M.A. and Dinant, G. (2004) Inter-Observer Variation in the Interpretation of Chest Radiographs for Pneumonia in Community-Acquired Lower Respiratory Tract Infections. Clinical Radiology, 58, 478-481. http://dx.doi.org/10.1016/j.crad.2004.01.011
- Viera, J.A. and Garrett, J.M. (2005) Understanding Interobserver Agreement: The Kappa Statistic. Family Medicine, 37, 360-363.
- Pefura Yone, E.W., Kengne, A.P., Moifo, B. and Kuaban, C. (2013) Prevalence and Determinants of Extrapulmonary Involvement in Patients with Pulmonary Tuberculosis in a Sub-Saharan African Country: A Cross-Sectional Study. Scandinavian Journal of Infectious Diseases, 45, 104-111. http://dx.doi.org/10.3109/00365548.2012.714905
- Blum, A., Feldmann, L., Brester, F. and Jouanny, P. (1995) Intérêt du Calcul du Coefficient Kappa dans l’Evaluation d'une Méthode d’Imagerie. Journal of Radiology, 76, 441-443.
- Fermanian, J. (1984) Mésure de l’Accord Entre Deux Juges. Cas Qualitatif. Revue d’Epidemiologie et de Santé Publique, 32, 140-147.
- Sim, J. and Wright, C.C. (2005) The Kappa Statistic in Reliability Studies: Interpretation, and Sample Size Requirements. Physical Therapy, 85, 257-268.
- Whitley, E. and Ball, J. (2002) Sample size Calculations. Critical Care, 6, 335-341. http://dx.doi.org/10.1186/cc1521
- Zellweger, J.P., Heinzer, R., Touray, M. and Vidondo, B. (2006) Intra-Observer and Overall Agreement in the Radiological Assessment of Tuberculosis. The International Journal of Tuberculosis and Lung Disease, 10, 1123-1126.
- Potchen, E.J., Cooper, T.G., Sierra, A.E. and Aben, G.R. (2000) Measuring Performance in Chest Radiography. Radiology, 217, 456-459. http://dx.doi.org/10.1148/radiology.217.2.r00nv14456
- Eisen, A.L., Berger, S.J., Hedge, A. and Schneider, F.R. (2006) Competency in Chest Radiograph: Comparism of Medical Students, Résidents, and Fellows. Journal of General Internal Medicine, 21, 460-465. http://dx.doi.org/10.1111/j.1525-1497.2006.00427.x
- Leslie, A., Jones, A.J. and Goddard, P. (2000) The Influence of Clinical Information on the Reporting of CT by Radiologists. The British Journal of Radiology, 73, 1052-1055.
Appendix
Interpretation grid for CXR in adults
Reader’ code: ….……… Qualification of reader………………Radiograph’ code: ………….
Interpretation


NOTES

*Corresponding author.