Journal of Power and Energy Engineering
Vol.04 No.08(2016), Article ID:69480,11 pages
10.4236/jpee.2016.48004
Subtle Influence of the Weibull Shape Parameter on Homer Optimization Space of a Wind Diesel Hybrid Gen Set for Use in Southern Brazil
Mariana G. Benevit, Jones S. Silva, André G. Gewehr, Alexandre Beluco
Instituto de Pesquisas Hidráulicas, Universidade Federal do Rio Grande do Sul Porto Alegre, Rio Grande do Sul, Brazil

Copyright © 2016 by authors and Scientific Research Publishing Inc.
This work is licensed under the Creative Commons Attribution International License (CC BY).
http://creativecommons.org/licenses/by/4.0/


Received 6 June 2016; accepted 1 August 2016; published 4 August 2016
ABSTRACT
Wind power is an increasingly important alternative for obtaining energy supplies, both in large interconnected power systems and in smaller hybrid systems and even in backup systems. The temporal and spatial variability of the winds represent an obstacle to be overcome so that wind energy can be increasingly used. The capacity factor of wind farms shows how this variability impacts the operation of the plants and its value is of the order of 30% to 35%. The variability of the wind speed is influenced if the point of interest is on land or on sea, the shape of the surface, the proximity of water bodies, among other factors. The availability of wind is best described by the Weibull probability distribution, which has as one of its defining parameters one which is termed as shape parameter. This parameter is much higher as higher is the variability of the wind speed. This paper studies the subtle influence of Weibull shape parameter on the optimal combination of components in a wind diesel hybrid system, by means of computer simulations with the well known software Homer. The results indicate a relatively small influence (as expected) in the studied system, which appears particularly when the cost of diesel is higher and the availability of wind is lower.
Keywords:
Wind Energy, Wind Diesel Hybrid Systems, Weibull Shape Parameter, Southern Brazil, Computational Simulation, Software Homer

1. Introduction
The concern for reducing emissions of greenhouse gases has led the world to develop of new energy sources. Wind power is recognized as a reliable and affordable source of electricity and has become an important component of the energy systems in many countries [1] .
The worldwide wind power capacity exceeded 280 GW in 2012, with an increase of 12% over the previous year. All wind turbines installed by the end of 2012 worldwide can provide 580 TWh a year, more than 3% of the global electricity demand [2] .
In several countries where no left energy resources are available in significant amounts, the wind energy has been widely explored. In several systems, it can represent up to 30% of the energy available, including exploration of the potential overseas.
While a completely renewable energy matrix may be hard to achieve in several nations, hybrid systems are another matter altogether. Wind diesel hybrid systems can be a good solution for remote communities (isles or regions isolated by the harsh weather conditions), diminishing the dependence of fossil fuels and the necessity of paying high costs for the purchase of annual supplies of diesel fuels [3] . However, not only that: it can reduce significantly the emission of greenhouse gases, helping different nations to accomplish protocols that determine the cut of GHG emissions [4] .
In the past, asynchronous electric machines seemed to be the best alternative for the conversion of wind energy. Over time, the technology of synchronous machines evolved considerably, enabling the provision of high quality electricity [5] .
In recent years, there is also an intense development in the techniques available for locating turbines in an area where the wind potential is harnessed [6] . Currently, there are several wind farms in the world with large dimensions, providing several hundred MW.
Brazil is experiencing a moment of intense excitement in the wind energy sector, with the auction of new areas for generation and free competition among stakeholders. In Brazil, the production of electricity from wind power exceeded 2700 GWh in 2011, which represented an increase of 24.3% over the previous year [2] . The total contribution to the Brazilian system has already reached about 1.69% of the total installed power [7] .
In Rio Grande do Sul, the southern state of Brazil, the estimated wind power potential onshore is 15.8 GW, 54.4 GW and 115.2 GW for areas with wind speed equal or greater than 7 m/s, at the heights of respectively 50 m, 75 m and 100 m. With an area of only 3.32% of the Brazilian territory, it has a wind potential equivalent to 15% of the estimated potential for Brazil for areas with speeds greater than 7 m/s or greater and heights of 50 m [8] .
The temporal and spatial variability of the winds represent an obstacle to be overcome so that wind energy can be increasingly used. The capacity factor of wind farms shows how this variability impacts the operation of the plants and its value is of the order of 30% to 35%. An increase in the capacity factor can be obtained with the joint operation with reversible hydro power plants [9] , but this option is not always possible.
In order to determine the feasibility of a wind farm in a specific area, it is necessary to measure the wind speeds, recording the arithmetic mean every 10 minutes for the period of at least one year. With the collected data it is possible to construct a relative frequency distribution. Then, a probability density function (pdf) can be fitted for the data obtained [10] .
The Weibull pdf is one of the main functions for modeling, being widely used worldwide. Nevertheless, this density function is not suited for all cases: a better fitting might be found with the Rayleigh, Burr, Gamma or Wakeby distributions, among an extensive list of other possibilities. It may be even possible, in a specific analysis, to use several distributions at the same time in order to obtain better results [11] .
The main reason for the choice of the Weibull function for this work is its ability to fit a wide collection of wind data [12] . The Weibull formula can be considered “user-friendly”, since the probability density function may be estimated by only two numerical parameters. These parameters are related to the mean wind speed of the area and the corresponding standard deviation, being k, the shape parameter and c, the scale parameter. There are seven methods for their estimation [13] : The graphical method, the maximum likelihood method, the energy pattern factor method, the moment method, the empirical method, the modified maximum likelihood method and the equivalent energy method. Each of them have different efficiency, depending on the collected data.
This article seeks to contribute showing results that reveal the influence of Weibull shape parameter on the performance of a wind diesel hybrid system in southern Brazil. The article specifically shows the influence of this parameter on the optimal combinations of the components of a wind diesel hybrid system designed to operate as a backup system. The conclusions were based on simulations with the software Homer.
2. The Weibull Shape Parameter
The best way to characterize the wind potential wind at a given site is the description of the winds by a probability distribution. The Weibull probability distribution is the distribution that best describes the variability of wind speeds.
The probability density function for Weibull is given by equation (1). The parameter k is called the shape parameter and indicates the form of the probability distribution. In this equation, x must be greater than zero, λ is the scale parameter and k is the shape parameter.
 (1)
(1)
Figure 1 shows the series of wind speeds data used in this study and Figure 2 shows the influence of different values of k for the probability density function derived from these data.
In practical terms, higher values of the parameter k are related to the wind speed distributions with smaller variability.
3. Wind Characteristics in the State of Rio Grande do Sul, in Southern Brazil
A good tool that shows characteristics of the winds of Rio Grande do Sul (RS)1 is the Wind Atlas of RS, which
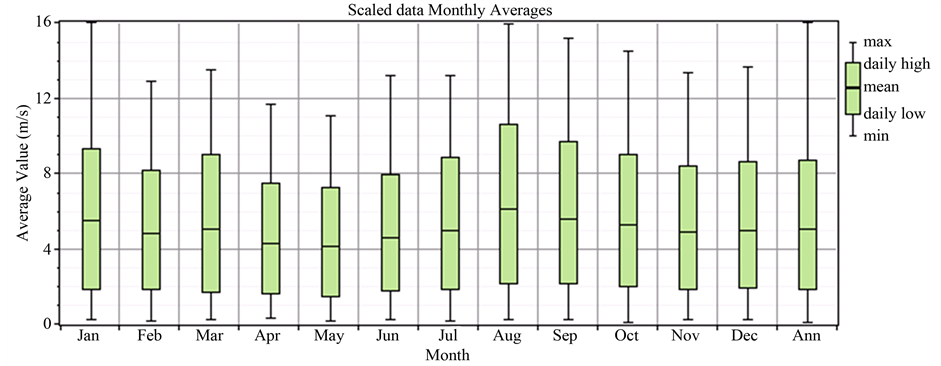

Figure 1. Synthetic series of wind speed with the Weibull shape parameter equal to 2.1.

Figure 2. Probability density function for the synthetic series used in the simulations, for the values of k equal to 1.8, 2.1, 2.4, 2.7 and 3.0.
has detailed information about the wind regime in southern Brazil. The wind data maps are found in the resolution of 1 km × 1 km that were generated by measurements performed in 21 towers between 2000 and 2002. The information allowed preliminary feasibility studies and the identification of suitable sites for measurements aiming implantation of wind farms. Reference [8] indicates the site where the atlas can be accessed.
The estimated potential onshore is about 15.8 GW, 54.4 GW and 115.2 GW for areas with winds greater than or equal to 7.0 m/s, respectively at heights of 50 m, 75 m and 100 m. With an area of only 3:32% of the Brazilian territory, the state has potential of wind generation, at heights of 50 m and speeds from 7.0 m/s, equivalent to 15% of the estimated potential for Brazil. Technically, annual averages from about 6.0 m/s already constitute favorable conditions for the operation of wind farms.
Atlas of RS also brings a study of wind potential on water (offshore), which covers the three largest lakes in the state: Patos Lagoon2, Mirim Lagoon3 and Mangueira Lagoon4. These three lakes have a considerable wind potential: 18.52 GW, 19.51 GW and 19.74 GW, respectively, for winds from 7 m/s at the heights of 50 m, 75 m and 100 m.
At the height of 50 m [14] , most of the region is near the annual average speeds of 6.0 m/s. On coastline appear larger speeds near 8.0 m/s. On the heights of 75 m [15] and 100 m [16] , higher speeds can be observed.
Regarding the Weibull shape parameter [17] , most of the state has values closer to 2.9, while the region near the Patos Lagoon has lower values, closer to 1.9.
These figures have not been reproduced here because it would be outside the scope of this article and it would not be possible to reproduce them with the necessary details.
4. The Wind Diesel Hybrid System Considered in This Study
The hybrid system considered in this study is a wind diesel system shown schematically in Figure 3. It is a gen set composed of wind turbines, one or two diesel generators, possibility of storage in batteries and AC load. It was designed for this study and consists of a system for backup service for industrial customers in locations throughout the State of Rio Grande do Sul, the southernmost State of Brazil. The electricity demand to be met has constant consumption of 62.5 kW, with daily consumption of 1500 kWh/d.
The wind turbine is a type AOC 15/50, produced by Sea Forth Energy [18] . It has a nominal capacity of 50 kW and is sold for US$ 176,000 per unit, effective cost for places of this study. The rotor has 15 m in diameter, with blades with a 7.2 m long, and is typically installed on towers with 30 to 40 meters. It is suitable for operation in wind diesel systems.
Figure 1 shows a series of wind data generated synthetically for use in simulations of this study. The number
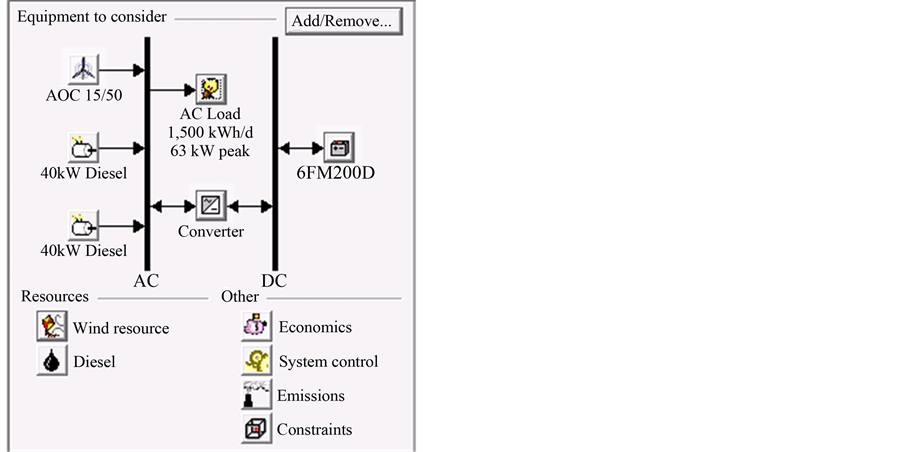
Figure 3. Wind diesel hybrid system considered in the study.
shown is the Weibull parameter to equal 2.1. Average speeds are typical of the northern part of the state. The series for the other values of k considered in the study were generated keeping the monthly average speeds. Figure 2 shows the probability density function for values of k considered in the study.
Batteries 6FM55D model were adopted in the simulation [19] . This model is part of the database software and has features very similar to the batteries available in the local market. Automotive batteries were adopted by their availability in the market and its low cost. The model operates with 12 V, with nominal capacity of 55 Ah, equivalent to 0.66 kWh, with lifetime throughput of 256 kWh. The acquisition cost is USD$ 100, with replacement cost of USD$ 90.
In this paper, converter was used, including in a single component the functions of inverter and rectifier. The device can operate as rectifier and inverter with 100% of total capacity, with 85% performance as a rectifier and 90% as inverter. The lifetime is estimated at 15 years.
The two diesel generators are identical and have a capacity of 40 kW. The acquisition cost is US$ 40,000, with an hourly cost estimated at $ 1.50 for operation and maintenance. The lifetime is estimated at 25,000 hours with drive from 30% of rated load.
5. Simulations with Homer
The software Homer [20] , The Micropower Optimization Model, was developed by National Renewable Energy Laboratory (NREL) and is available for universal access in its version 2.68 beta. HOMER simulates a system for power generation over the time period considered in the project at intervals of 60 minutes, presenting the results for a period of one year [1] - [22] .
The simulations were performed for an operation period of 25 years, with 12% annual interest and 6% internal rate of return. It was also established that the different generators could operate simultaneously and in parallel.
Five sets of simulations were performed, one for each value of the Weibull shape parameter. The values considered were 1.80, 2.10, 2.40, 2.70 and 3.00. Figure 1 shows two graphs relative to the wind resource. At first, the average wind speed for each month, the deviations around these averages and maximum and minimum values are shown. This graph shows the typical variability of the wind. The second graph, with strong variation in color, enhances the variability of the wind over days a year. Figure 2 shows the probability density function for different values of k.
Simulations were performed for the following values for the optimization variables: 0, 1, 2, 3, 4 and 5 wind turbines; 0 kW and 40 kW for the second diesel generation set; 0, 24, 48, 72, 96 and 120 batteries; 0 kW, 25 kW, 50 kW, 75 kW and 100 kW for the converter.
Simulations were performed for the following values for the sensitivity inputs: 5 m/s, 6 m/s, 7 m/s, 8 m/s, 9 m/s and 10 m/s for the scaled annual average velocity of the wind; US$ 0.40, US$ 0.60, US$ 0.80, US$ 1.00, US$ 1.20 and US$ 1.40 per liter of diesel; 0.0%, 5.0% and 10.0% for maximum annual capacity shortage.
Then, five sets of 360 simulations, with 108 different values for the variables of sensitivity, were performed. The operation was completed after a total time of about 66 minutes for each set of simulations. The results are presented and discussed in the next section.
6. Results and Discussion
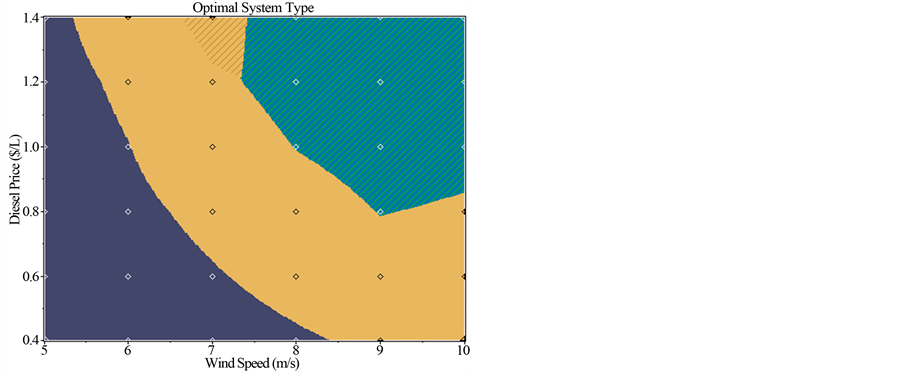
The effect of different values of k on the performance of the system of Figure 3 can be assessed by comparing the optimization spaces that appear in Figure 4(a), Figure 4(b), Figure 4(c), Figure 4(d) and Figure 4(e). In these figures, the optimization spaces indicate greater part of the solutions corresponding to a combination of wind turbines and two diesel generators 40 kW capacity. The solutions in the upper right, where there is higher average wind speed and higher cost of diesel, include battery banks to supply peak demand. The left side corresponds to solutions based only on the two diesel generators.
The number of turbines included in the solutions is higher in the upper right corner, where there are higher average wind speed. In these solutions, there is less fuel consumption, even though the number of generators is the same as in other solutions. The largest number of turbines justifies the use of batteries, because storing energy will be cheaper than diesel consuming.
The effect of parameter k appears at the top of the line dividing the areas in blue and yellow. Smaller values

 (a) (b)
 (c) (d)
 (e)
(e)
Figure 4. Results for the optimization space obtained for distribution of wind speeds with shape parameter equal to (a) 1.80, (b) 2.10, (c) 2.40, (d) 2.70 and (e) 3.00.
of k correspond to a higher number of solutions including wind turbines. The top of this line is located more to the extreme left of the space optimization, as can be seen in Figure 4(a), corresponding to k equal to 1.80.
Larger values of k correspond to less solutions including wind turbines, with the top of this dividing line moving to the right.
Figure 5 shows the displacement of the separating line between the areas corresponding to the diesel systems (in blue) and wind diesel hybrid systems (in yellow) in Figure 4(a), Figure 4(b), Figure 4(c), Figure 4(d) and Figure 4(e). This chart shows exactly the effect of Weibull shape parameter on the performance of the hybrid system, influencing the position of this line.
The area corresponding to solutions with batteries in these figures suffered growth with increasing k, occupying, with k equal to 3.00, almost double the original area, with k equal to 1.80. Probability distributions of wind speed with higher values of k have higher variability of speeds, with higher peaks availability offering energy to be accumulated in the batteries.
The changes in the cost of energy for the results shown in these figures appear respectively in Figure 6(a), Figure 6(b), Figure 6(c), Figure 6(d) and Figure 6(e). In fact, these figures indicate little change in the cost of energy made available. In these five graphs, the costs of the lower half virtually not changed, while the costs of the top half shows a small increase with increasing value of k.
The same simulations for a maximum annual capacity shortage of 10% show interesting results. Figure 7(a), Figure 7(b), Figure 7(c), Figure 7(d) and Figure 7(e) show these simulations. The lines of separation shown in Figure 5 are unchanged. The area corresponding to diesel systems with batteries got bigger and now have just one diesel gen set. Increasing the value of k makes this area get bigger. For higher values of k, appears surprisingly an area corresponding to diesel systems without batteries and with just one diesel gen set.
7. Conclusions
This paper aims to study the influence of the Weibull shape parameter on the optimal combinations between components of a wind diesel hybrid system, also providing information on the performance of these systems.
The results show that the Weibull shape parameter directly influences the optimization space provided by Homer at points where the wind speed is smaller and the cost of diesel is increased.
The main influence of the Weibull shape parameter appears in systems that include batteries, increasing the number of solutions including batteries according to the shape parameter assumes larger values.
Acknowledgements
This work was developed as a part of research activities on renewable energy developed at the Instituto de Pes-

Figure 5. Separation line between the areas corresponding to the diesel systems (in blue) and wind diesel systems (in yellow) in Figure 4(a), Figure 4(b), Figure 4(c), Figure 4(d) and Figure 4(e).

 (a) (b)
 (c) (d)
 (e)
(e)
Figure 6. Cost of energy for the system simulated with distribution of wind speeds with shape parameter equal to (a) 1.80; (b) 2.10; (c) 2.40; (d) 2.70 and (e) 3.00.
 (a) (b)
 (c) (d)
 (e)
(e)
Figure 7. Results for the optimization space obtained for distribution of wind speeds, with maximum annual capacity shortage equal to 10%, with shape parameter equal to (a) 1.80; (b) 2.10; (c) 2.40; (d) 2.70; (e) 3.00.
quisas Hidráulicas, Universidade Federal do Rio Grande do Sul. The authors acknowledge the support received by the institution. The last author acknowledges the financial support received from CNPq for his research work.
Cite this paper
Mariana G. Benevit,Jones S. Silva,André G. Gewehr,Alexandre Beluco, (2016) Subtle Influence of the Weibull Shape Parameter on Homer Optimization Space of a Wind Diesel Hybrid Gen Set for Use in Southern Brazil. Journal of Power and Energy Engineering,04,38-48. doi: 10.4236/jpee.2016.48004
References
- 1. The World Wind Energy Association. Annual Report. 2012. www.wwindea.org/home/index.php
- 2. Brazil, Department of Mines and Energy. Annual Energy Balance, Edition 2012, Base Year 2011. Brasília, DF, Brazil, 2012. https://ben.epe.gov.br/downloads/Relatorio_Final_BEN_2012.pdf
- 3. Weis, T.M. and Ilinca, A. (2010) Assessing the Potential for a Wind Power Incentive for Remote Villages in Canada. Energy Policy, 38, 5504-5511.
http://dx.doi.org/10.1016/j.enpol.2010.04.039 - 4. Antoine, B., Goran, K. and Neven, D. (2008) Energy Scenarios for Malta. International Journal of Hydrogen Energy, 33, 4235-4246.
http://dx.doi.org/10.1016/j.ijhydene.2008.06.010 - 5. Pandey, S.K., Mohanty, S.R. and Kishor, N. (2013) A Literature Survey on Load Frequency Control for Conventional and Distribution Generation Power Systems. Renewable and Sustainable Energy Reviews, 25, 318-334.
http://dx.doi.org/10.1016/j.rser.2013.04.029 - 6. Geem, Z.W. and Hong, J. (2013) Improved Formulation for the Optimization of Wind Turbine Placement in a Wind Farm. Mathematical Problems in Engineering, 2013, Article ID: 481364.
- 7. Brazilian Agency for Electrical Energy, ANEEL. Capacity of Power Generation in Brazil.
http://www.aneel.gov.br/aplicacoes/capacidadebrasil/capacidadebrasil.cfm - 8. State of Rio Grande do Sul (Brazil), Department of Mines, Energy and Communications. Wind Atlas of Rio Grande do Sul. Porto Alegre, RS, Brazil, 2002. (In Portuguese) www.cresesb.cepel.br/publicacoes/download/atlas_eolico/atlas_eolico_RGS.pdf
- 9. Anagnostopoulos, J.S. and Papantonis, D.E. (2008) Simulation and Size Optimization of a Pumped Storage Power Plant for the Recovery of Wind Farms Rejected Energy. Renewable Energy, 33, 1685-1694.
http://dx.doi.org/10.1016/j.renene.2007.08.001 - 10. Rodríguez, O., del Río, J.A., Jaramillo, O. and Martínez, M. (2015) Wind Power Error Estimation in Resource Assessments. PLoS ONE, 10, e0124830.
http://dx.doi.org/10.1371/journal.pone.0124830 - 11. Masseran, N. (2015) Evaluating Wind Power Density Models and Their Statistical Properties. Energy, Elsevier, 84, 533-541.
http://dx.doi.org/10.1016/j.energy.2015.03.018 - 12. Lun, I.Y.F. and Lam, J.C. (2000) A Study of Weibull Parameters Using Long-Term Wind Observations. Renewable Energy, 20, 145-153.
http://dx.doi.org/10.1016/S0960-1481(99)00103-2 - 13. Rocha, P.A.C., Sousa, R.C., Andrade, C.F. and Silva, M.E.V. (2012) Comparison of Seven Numerical Methods for Determining Weibull Parameters for Wind Energy Generation in the Northeast Region of Brazil. Applied Energy, 89, 395-400.
http://dx.doi.org/10.1016/j.apenergy.2011.08.003 - 14. State of Rio Grande do Sul (Brazil), Department of Mines, Energy and Communications (2002) Wind Atlas of Rio Grande do Sul. Porto Alegre, RS, Brazil, 38. (In Portuguese)
- 15. State of Rio Grande do Sul (Brazil), Department of Mines, Energy and Communications (2002) Wind Atlas of Rio Grande do Sul. Porto Alegre, RS, Brazil, 40. (In Portuguese)
- 16. State of Rio Grande do Sul (Brazil), Department of Mines, Energy and Communications (2002) Wind Atlas of Rio Grande do Sul. Porto Alegre, RS, Brazil, 42. (In Portuguese)
- 17. State of Rio Grande do Sul (Brazil), Department of Mines, Energy and Communications (2002) Wind Atlas of Rio Grande do Sul. Porto Alegre, RS, Brazil, 45. (In Portuguese)
- 18. Seaforth Energy. Wind Turbine Model AOC 15/50. seaforthenergy.com/aoc-1550/specifications/
- 19. Vision Group. Battery Model 6FM55D. www.vision-batt.com
- 20. Software HOMER, Version 2.68 Beta. The Micropower Opyimization Model, Homer Energy. www.homerenergy.com
- 21. Lambert, T.W., Gilman, P. and Lilienthal, P.D. (2005) Micropower System Modeling with Homer. In: Farret, F.A. and Simões, M.G., Eds., Integration of Alternative Sources of Energy, John Wiley & Sons, Boca Raton, 379-418.
http://dx.doi.org/10.1002/0471755621.ch15 - 22. Lilienthal, P.D., Lambert, T.W. and Gilman, P. (2004) Computer Modeling of Renewable Power Systems. In: Cleveland, C.J., Ed., Encyclopedia of Energy, Vol. 1, Elsevier, 633-647.
http://dx.doi.org/10.1016/b0-12-176480-x/00522-2
NOTES

