Paper Menu >>
Journal Menu >>
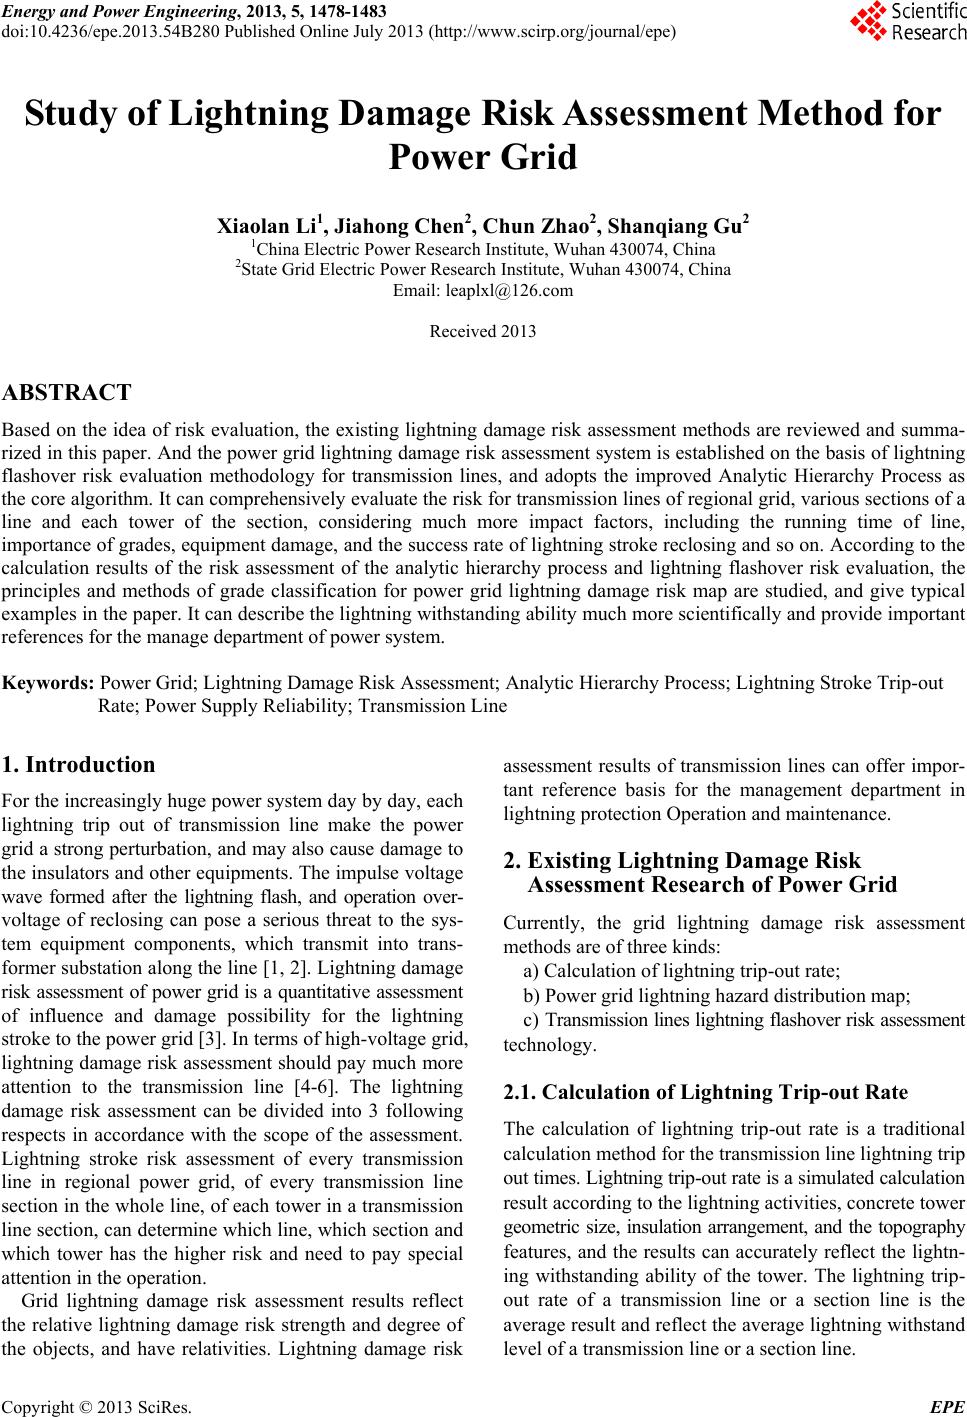 Energy and Power Engineering, 2013, 5, 1478-1483 doi:10.4236/epe.2013.54B280 Published Online July 2013 (http://www.scirp.org/journal/epe) Study of Lightning Damage Risk Assessment Method for Power Gr id Xiaolan Li1, Jiah on g Chen2, Chun Zhao2, Shanqiang Gu2 1China Electric Power Research Institute, Wuhan 430074, China 2State Grid Electric Power Research Institute, Wuhan 430074, China Email: leaplxl@126.com Received 2013 ABSTRACT Based on the idea of risk evaluation, the existing lightning damage risk assessment methods are reviewed and summa- rized in this paper. And the power grid lightning damage risk assessment system is established on the basis of lightning flashover risk evaluation methodology for transmission lines, and adopts the improved Analytic Hierarchy Process as the core algorithm. It can comprehensively evaluate the risk for transmission lines of regional grid, various sections of a line and each tower of the section, considering much more impact factors, including the running time of line, importance of grades, equipment damage, and the success rate of lightning stroke reclosing and so on. According to the calculation results of the risk assessment of the analytic hierarchy process and lightning flashover risk evaluation, the principles and methods of grade classification for power grid lightning damage risk map are studied, and give typical examples in the paper. It can describe the lightn ing withstand ing ability much more scientifically and prov ide important references for the manage department of power system. Keywords: Power Grid; Lightning Damage Risk Assessment; Analytic Hierarchy Process; Lightning Stroke Trip-out Rate; Power Supply Reliability; Transmission Line 1. Introduction For the increasingly huge power system day by day, each lightning trip out of transmission line make the power grid a strong perturbation, and may also cause damage to the insulators an d other equipments. The imp ulse voltage wave formed after the lightning flash, and operation over- voltage of reclosing can pose a serious threat to the sys- tem equipment components, which transmit into trans- former substation along the line [1, 2]. Lightning damage risk assessment of power grid is a quantitative assessment of influence and damage possibility for the lightning stroke to the power grid [3]. In terms of high-voltage grid, lightning damage risk assessment should pay much more attention to the transmission line [4-6]. The lightning damage risk assessment can be divided into 3 following respects in accordance with the scope of the assessment. Lightning stroke risk assessment of every transmission line in regional power grid, of every transmission line section in the whole line, of each tower in a transmission line section, can d etermine which line, which section and which tower has the higher risk and need to pay special attention in the operation. Grid lightning damage risk assessment results reflect the relative lightning damage risk strength and degree of the objects, and have relativities. Lightning damage risk assessment results of transmission lines can offer impor- tant reference basis for the management department in lightnin g protecti on Operation and m a i nt e nance. 2. Existing Lightning Damage Risk Assessment Research of Power Grid Currently, the grid lightning damage risk assessment methods are of three kinds: a) Calculation of lightning trip-out rate; b) Power grid lightning hazard distribution map; c) Tran smission lines lightning flashover risk assessment technology. 2.1. Calculation of Lightning Trip-out Rate The calculation of lightning trip-out rate is a traditional calculation method for the transmission lin e lightning trip out times. Ligh tning trip -out rate is a simula ted calcula tion result according to the ligh tning activities, co n crete tower geometric size, insulation arrangement, and the topography features, and the results can accurately reflect the lightn- ing withstanding ability of the tower. The lightning trip- out rate of a transmission line or a section line is the average result and reflect the average lightning withstand level of a transmission line or a section line. Copyright © 2013 SciRes. EPE 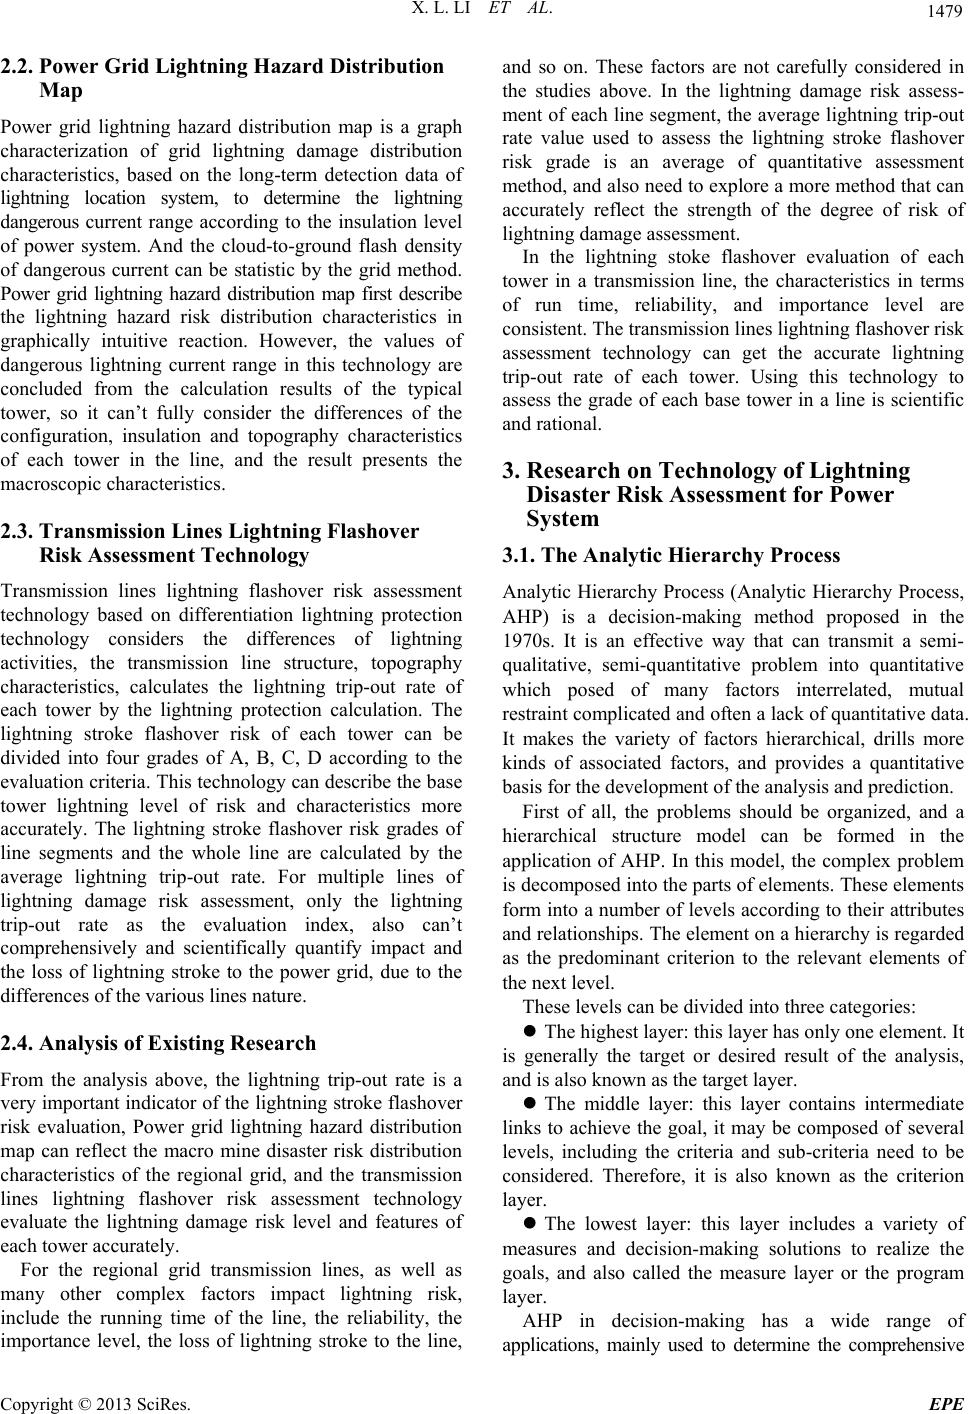 X. L. LI ET AL. 1479 2.2. Power Grid Lightning Hazard Distribution Map Power grid lightning hazard distribution map is a graph characterization of grid lightning damage distribution characteristics, based on the long-term detection data of lightning location system, to determine the lightning dangerous current range according to the insulation level of power system. And the cloud-to-ground flash density of dangerous current can be statistic by the grid method. Power grid lightning hazard distribution map first describe the lightning hazard risk distribution characteristics in graphically intuitive reaction. However, the values of dangerous lightning current range in this technology are concluded from the calculation results of the typical tower, so it can’t fully consider the differences of the configuration, insulation and topography characteristics of each tower in the line, and the result presents the macroscopic characteristics. 2.3. Transmission Lines Lightning Flashover Risk Assessment Technology Transmission lines lightning flashover risk assessment technology based on differentiation lightning protection technology considers the differences of lightning activities, the transmission line structure, topography characteristics, calculates the lightning trip-out rate of each tower by the lightning protection calculation. The lightning stroke flashover risk of each tower can be divided into four grades of A, B, C, D according to the evaluation criteria. This technology can describe the base tower lightning level of risk and characteristics more accurately. The lightning stroke flashover risk grades of line segments and the whole line are calculated by the average lightning trip-out rate. For multiple lines of lightning damage risk assessment, only the lightning trip-out rate as the evaluation index, also can’t comprehensively and scientifically quantify impact and the loss of lightning stroke to the power grid, due to the differences of the various lines nature. 2.4. Analysis of Existing Research From the analysis above, the lightning trip-out rate is a very important indicator of the lightning stroke flashover risk evaluation, Power grid lightning hazard distribution map can reflect the macro mine disaster risk distribution characteristics of the regional grid, and the transmission lines lightning flashover risk assessment technology evaluate the lightning damage risk level and features of each tower accurately. For the regional grid transmission lines, as well as many other complex factors impact lightning risk, include the running time of the line, the reliability, the importance level, the loss of lightning stroke to the line, and so on. These factors are not carefully considered in the studies above. In the lightning damage risk assess- ment of each line segment, the average lightning trip-out rate value used to assess the lightning stroke flashover risk grade is an average of quantitative assessment method, and also need to explore a more method that can accurately reflect the strength of the degree of risk of lightni ng damag e assessm en t . In the lightning stoke flashover evaluation of each tower in a transmission line, the characteristics in terms of run time, reliability, and importance level are consistent. The transmission lines lightning flashover risk assessment technology can get the accurate lightning trip-out rate of each tower. Using this technology to assess the grade of each base tower in a line is scientific and rational. 3. Research on Technology of Lightning Disaster Risk Assessment for Power System 3.1. The Analytic Hierarchy Process Analytic Hierarchy Process (Analytic Hierarchy Process, AHP) is a decision-making method proposed in the 1970s. It is an effective way that can transmit a semi- qualitative, semi-quantitative problem into quantitative which posed of many factors interrelated, mutual restraint complicated and often a lack of quantitative data. It makes the variety of factors hierarchical, drills more kinds of associated factors, and provides a quantitative basis for the development of the analysis and prediction. First of all, the problems should be organized, and a hierarchical structure model can be formed in the application of AHP. In this model, the complex problem is decomposed into the parts of elements. These elements form into a number of levels according to their attributes and relationships. The element on a hierarchy is regarded as the predominant criterion to the relevant elements of the next level. These levels can be divided into three categories: The highest layer: this layer has only one element. It is generally the target or desired result of the analysis, and is also known as the target layer. The middle layer: this layer contains intermediate links to achieve the goal, it may be composed of several levels, including the criteria and sub-criteria need to be considered. Therefore, it is also known as the criterion layer. The lowest layer: this layer includes a variety of measures and decision-making solutions to realize the goals, and also called the measure layer or the program layer. AHP in decision-making has a wide range of applications, mainly used to determine the comprehensive Copyright © 2013 SciRes. EPE 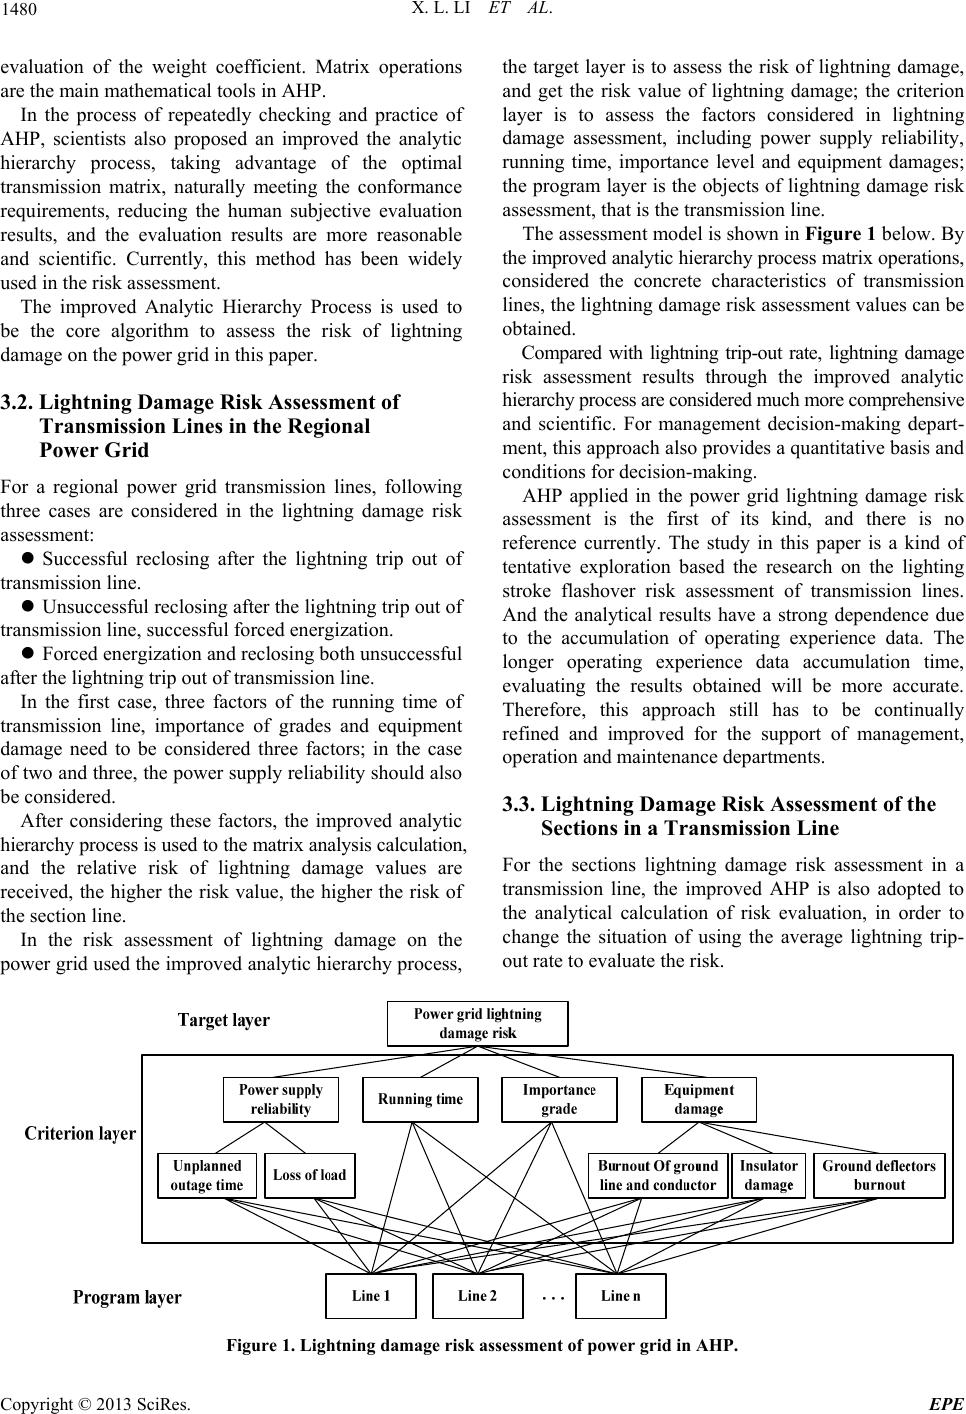 X. L. LI ET AL. Copyright © 2013 SciRes. EPE 1480 evaluation of the weight coefficient. Matrix operations are the main mathematical tools in AHP. In the process of repeatedly checking and practice of AHP, scientists also proposed an improved the analytic hierarchy process, taking advantage of the optimal transmission matrix, naturally meeting the conformance requirements, reducing the human subjective evaluation results, and the evaluation results are more reasonable and scientific. Currently, this method has been widely used in the risk assessment. The improved Analytic Hierarchy Process is used to be the core algorithm to assess the risk of lightning damage on the power grid in this paper. 3.2. Lightning Damage Risk Assessment of Transmission Lines in the Regional Power Grid For a regional power grid transmission lines, following three cases are considered in the lightning damage risk assessment: Successful reclosing after the lightning trip out of transmission line. Unsuccessful reclosing after the lightning trip out of transmission line, successful forced energization. Forced en er g i zatio n and reclosing bo th unsuccessfu l after the lightning trip out of transmission line. In the first case, three factors of the running time of transmission line, importance of grades and equipment damage need to be considered three factors; in the case of two and three, the power su pply reliability should also be cons idered. After considering these factors, the improved analytic hierarchy process is used to the matrix analysis calculation, and the relative risk of lightning damage values are received, the higher the risk value, the higher the risk of the section line. In the risk assessment of lightning damage on the power grid used the improved analytic hierarchy process, the target layer is to assess the risk of lightning damage, and get the risk value of lightning damage; the criterion layer is to assess the factors considered in lightning damage assessment, including power supply reliability, running time, importance level and equipment damages; the program layer is the objects of lightning damage risk assessment, that is the transmission line. The assessment model is shown in Figure 1 below. By the improved analytic hierarchy process matrix operations, considered the concrete characteristics of transmission lines, the lightning damage risk assessment values can be obtained. Compared with lightning trip-out rate, lightning damage risk assessment results through the improved analytic hierarchy process are considered much more comprehensive and scientific. For management decision-making depart- ment, this appro ach also provides a quantitati ve b asis and conditions for decision-making. AHP applied in the power grid lightning damage risk assessment is the first of its kind, and there is no reference currently. The study in this paper is a kind of tentative exploration based the research on the lighting stroke flashover risk assessment of transmission lines. And the analytical results have a strong dependence due to the accumulation of operating experience data. The longer operating experience data accumulation time, evaluating the results obtained will be more accurate. Therefore, this approach still has to be continually refined and improved for the support of management, operation and maintenance depart ments. 3.3. Lightning Damage Risk Assessment of the Sections in a Transmission Line For the sections lightning damage risk assessment in a transmission line, the improved AHP is also adopted to the analytical calculation of risk evaluation, in order to change the situation of using the average lightning trip- out rate to evaluate the risk. Figure 1. Lightning damage risk assessment of power grid in AHP.  X. L. LI ET AL. 1481 In the section assessment, the calculation is based on the results of lightning stroke risk level of lightning flashover risk evaluation method for transmission line, such as the level of A, B, C, D. To statistic the percentage of tower numbers of each level in a section occupied the section tower numbers. Then the proportion of A, B, C, and D will be obtained. Considering the different coefficient of various grades to the lightning damage risk assessment, the improved AHP will be used to get the lightning damage risk assessment values of each section, as shown in the Figure 2. 3.4. Lightning Damage Risk Assessment of Each Tower in a Transmission Line For the relative lightning flashover risk of each tower in transmission line, the impact factors mainly include the existing differences of lightning activities, topography, structures and so on. Figure 3 describes the process of lightning flashover risk Evaluation method of transmission lines. And the lightning risk grade results by the lightning flashover evaluation method of transmission lines can represent the relative lightning disaster risk of each tower. 4. Establishment of Grid Lightning Damage Risk Assessment System Based on the lightning flashover risk assessment of transmission lines, the improved AHP is taken as the core algorithm method, and the relative lightning damage risk assessment of the lines in regional grid, the sections of a line, and the towers of a section is researched in-depth in this pap er, as shown in the Figure 4. The gr id lightning damage risk assessment system from the grid to the transmission line to the line segment to specific base tower is established. And this establishment provides more intuitive, convenient decisions for the management decision-making department. According to the assess- ment results, they can decide which line; segment and tower should be paid more attention in the lightning pro- tection operation and mainten a nce. Figure 2. Lightning damage risk assessment method of line sections in AHP. Lightning detection data of lightning location sy s t em Geographical information of the line Statistics of lightning parameters for the line Appointing the statistical time period Comput ati o n of lightning flashover rate of each tower and the whole line Detailed data of each tower inc l u d i n g configuration, insulation, terrain, etc. Evaluation Risk grade reference Lightning flashove r risk grade of each tower and the whole line Figure 3. Process of lightning flashover risk Evaluation method of transmission lines. Copyright © 2013 SciRes. EPE 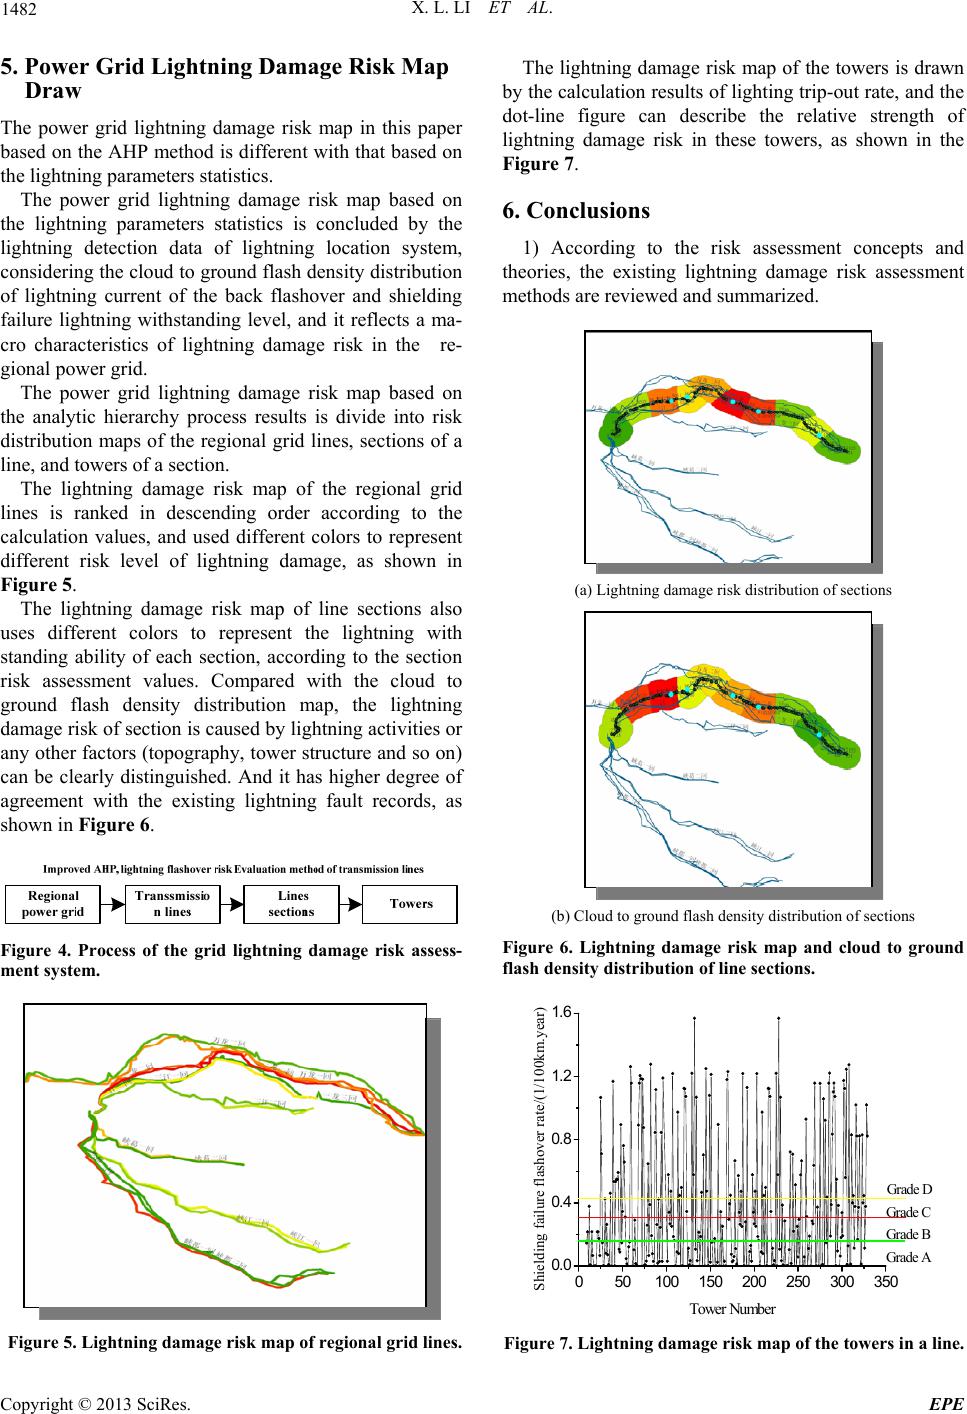 X. L. LI ET AL. 1482 5. Power Grid Lightning Damage Risk Map Draw The power grid lightning damage risk map in this paper based on the AHP method is different with that based on the lightning parameters statistics. The power grid lightning damage risk map based on the lightning parameters statistics is concluded by the lightning detection data of lightning location system, considering the cloud to ground flash density distribution of lightning current of the back flashover and shielding failure lightning withstanding level, and it reflects a ma- cro characteristics of lightning damage risk in the re- gional power grid. The power grid lightning damage risk map based on the analytic hierarchy process results is divide into risk distribution maps of the regional grid lines, sections of a line, and towers of a section. The lightning damage risk map of the regional grid lines is ranked in descending order according to the calculation values, and used different colors to represent different risk level of lightning damage, as shown in Figure 5. The lightning damage risk map of line sections also uses different colors to represent the lightning with standing ability of each section, according to the section risk assessment values. Compared with the cloud to ground flash density distribution map, the lightning damage risk of section is caused b y lightning activ ities or any other factors (topogr aphy, tower structure and so on) can be clearly distinguished. And it has higher degree of agreement with the existing lightning fault records, as shown in Figure 6. Figure 4. Process of the grid lightning damage risk assess- ment system. Figure 5. Lightning damage risk map of regional grid lines. The lightning damage risk map of the towers is drawn by the calculation results of lighting trip-out rate, and the dot-line figure can describe the relative strength of lightning damage risk in these towers, as shown in the Figure 7. 6. Conclusions 1) According to the risk assessment concepts and theories, the existing lightning damage risk assessment methods are reviewed and summarized. (a) Lightning damage risk distribution of s e c tions (b) Cloud to ground flash density distr ibution of sections Figure 6. Lightning damage risk map and cloud to ground flash density distribution of line sections. 050100 150 200 250300 350 0.0 0.4 0.8 1.2 1.6 Shielding failure flashover rate/(1/100km.year) Tower Number Grade D Grade C Grade B Grade A Figure 7. Lightning damage risk map of the towers in a line. Copyright © 2013 SciRes. EPE 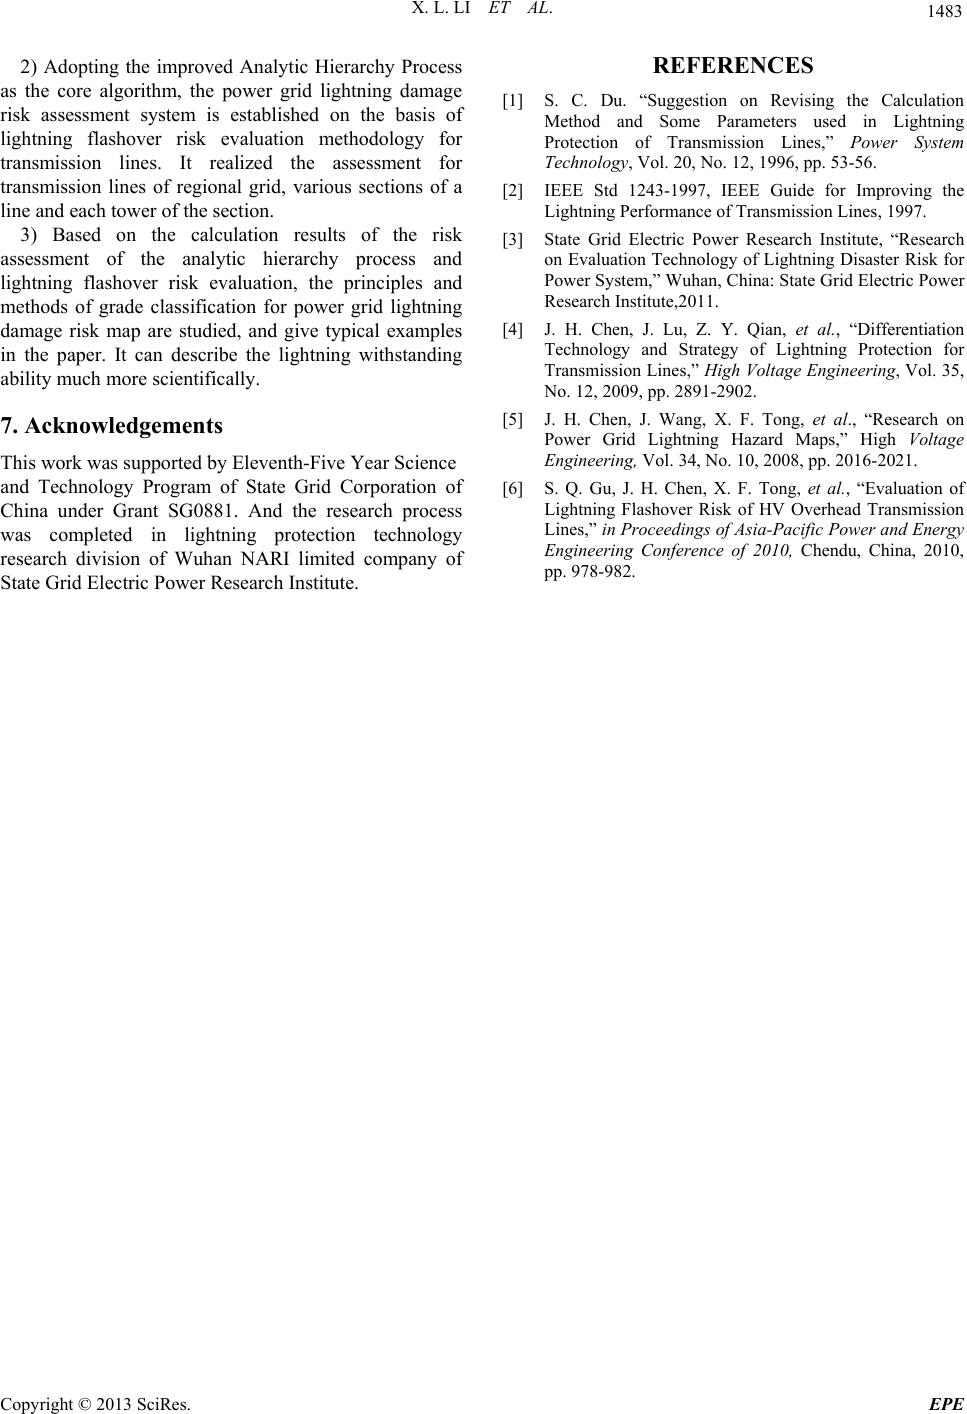 X. L. LI ET AL. 1483 2) Adopting the improved Analytic Hierarchy Process as the core algorithm, the power grid lightning damage risk assessment system is established on the basis of lightning flashover risk evaluation methodology for transmission lines. It realized the assessment for transmission lines of regional grid, various sections of a line and each tower of the section. 3) Based on the calculation results of the risk assessment of the analytic hierarchy process and lightning flashover risk evaluation, the principles and methods of grade classification for power grid lightning damage risk map are studied, and give typical examples in the paper. It can describe the lightning withstanding ability much more scientifically. 7. Acknowledgements This work w as su pported by Eleventh-Five Year Science and Technology Program of State Grid Corporation of China under Grant SG0881. And the research process was completed in lightning protection technology research division of Wuhan NARI limited company of State Grid Electric Power Research Institute. REFERENCES [1] S. C. Du. “Suggestion on Revising the Calculation Method and Some Parameters used in Lightning Protection of Transmission Lines,” Power System Technology, Vol. 20, No. 12, 1996, pp. 53-56. [2] IEEE Std 1243-1997, IEEE Guide for Improving the Lightning Performance of Transmission Lines, 1997. [3] State Grid Electric Power Research Institute, “Research on Evaluation Technology of Lightning Disaster Risk for Power System,” Wuhan, China: State Grid Electric Power Research Institute,2011. [4] J. H. Chen, J. Lu, Z. Y. Qian, et al., “Differentiation Technology and Strategy of Lightning Protection for Transmission Lines,” High Voltage Engineering, Vol. 35, No. 12, 2009, pp. 2891-2902. [5] J. H. Chen, J. Wang, X. F. Tong, et al., “Research on Power Grid Lightning Hazard Maps,” High Voltage Engineering, Vol. 34, No. 10, 2008, pp. 2016-2021. [6] S. Q. Gu, J. H. Chen, X. F. Tong, et al., “Evaluation of Lightning Flashover Risk of HV Overhead Transmission Lines,” in Proceedings of Asia-Pacific Power and Energy Engineering Conference of 2010, Chendu, China, 2010, pp. 978-982. Copyright © 2013 SciRes. EPE |