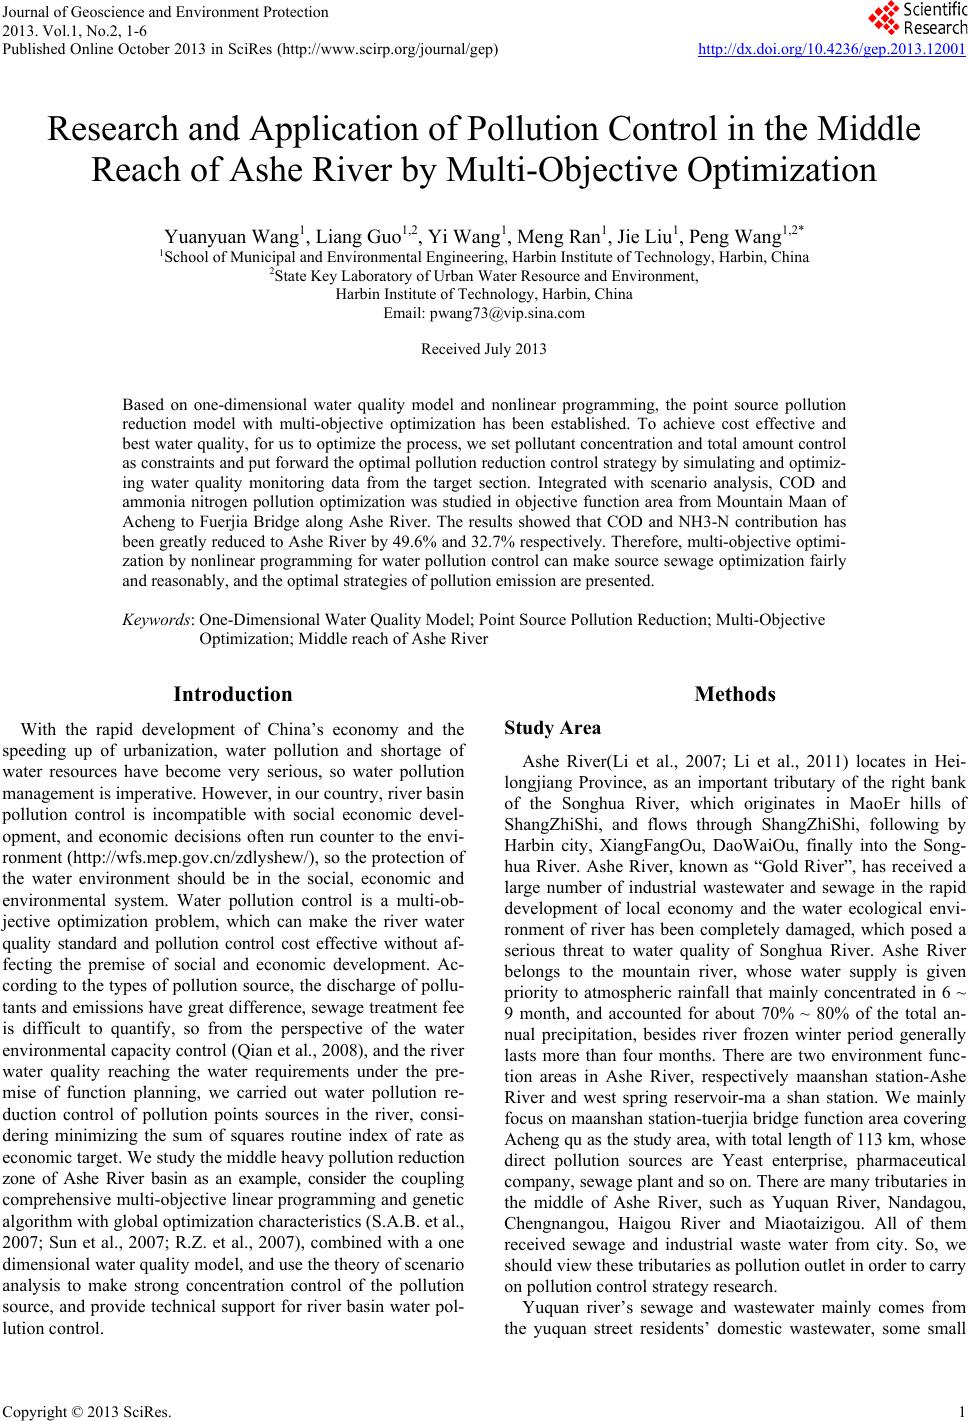
Y. Y. WANG ET AL.
Copyright © 2013 SciRes.
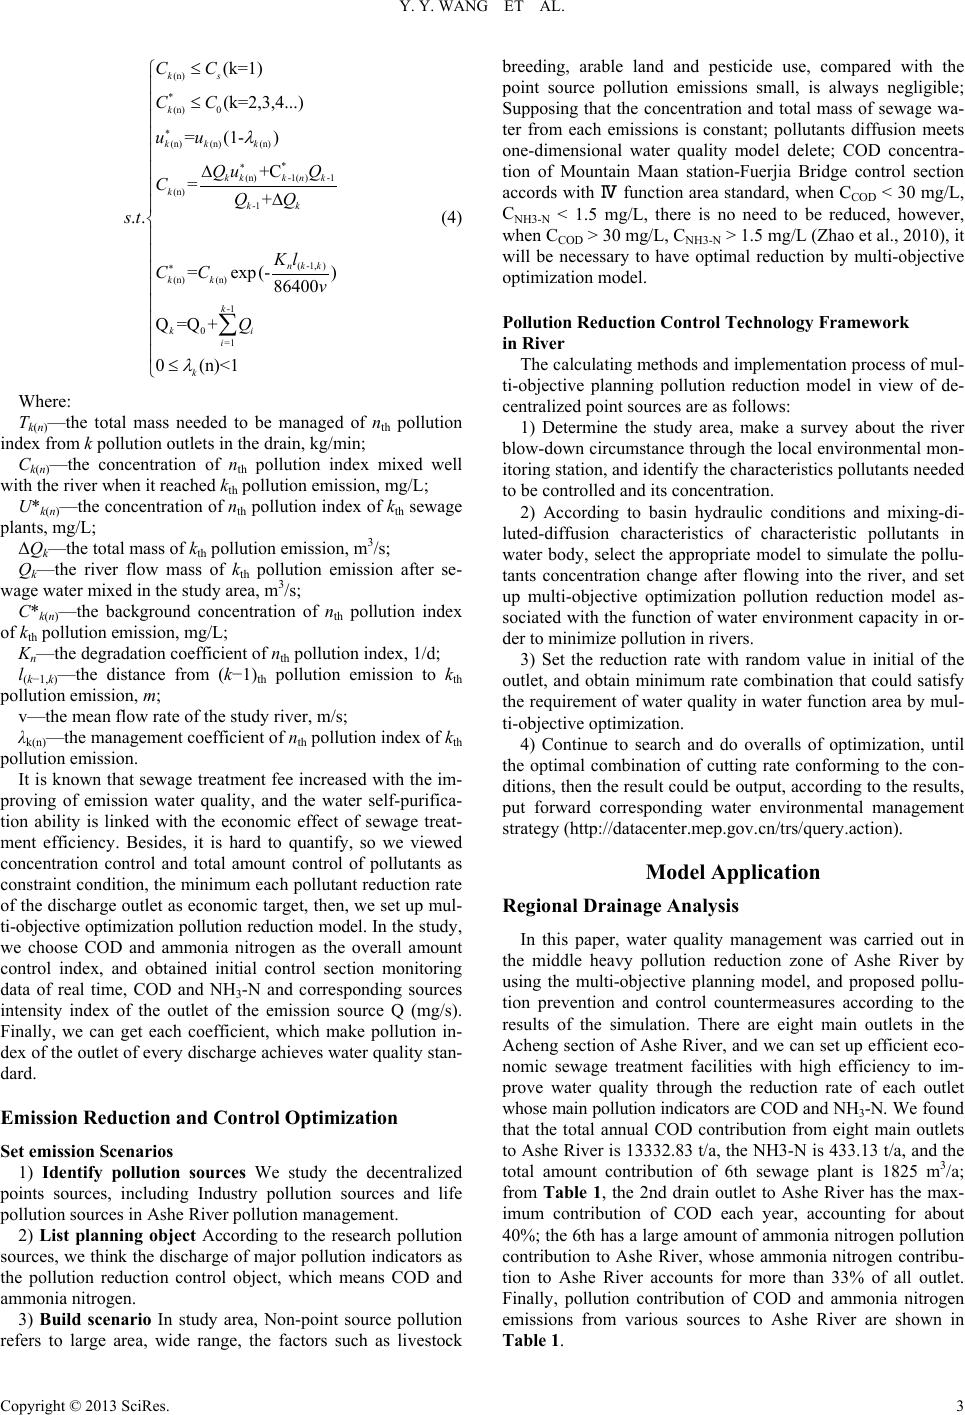
(n)
*(n) 0
(n) (n)(n)
*
(n)-1( )-1
(n)
-1
( -1, )
(n) (n)
-1
0=1
(k=1)
(k=2,3,4...)
= (1- )
+C
=+
..
= exp(-)
86400
Q=Q +
0 (n)<1
ks
k
kk k
kkk nk
k
kk
nk k
kk
k
ki
i
k
CC
CC
uu
Qu Q
CQQ
st
Kl
CC v
Q
λ
λ
∗
∗
∗
≤
≤
∆
∆
≤
∑
(4)
Where:
Tk(n)—the total mass needed to be managed of nth pollution
index from k pollution outlets in the drain, kg/min;
Ck(n)—the concentration of nth pollution index mixed well
with the river when it reached kth pollution emission, mg/L;
U*k(n)—the concentration of nth pollution index of kth sewage
plants, mg/L;
ΔQk—the total mass of kth pollution emission, m3/s;
Qk—the river flow mass of kth pollution emission after se-
wage water mixed in the study area, m3/s;
C*k(n)—the background concentration of nth pollution index
of kth pollution emission, mg/L;
Kn—the degradation coefficient of nth pollution index, 1/d;
l(k−1,k)—the distance from (k−1)th pollution emission to kth
pollution emission, m;
v—the mean flow rate of the study river, m/s;
λk(n)—the management coefficient of nth pollution index of kth
pollution emission.
It is known that sewage treatment fee increased with the im-
proving of emission water quality, and the water self-purifica-
tion ability is linked with the economic effect of sewage treat-
ment efficiency. Besides, it is hard to quantify, so we viewed
concentration control and total amount control of pollutants as
constraint condition, the minimum each pollutant reduction rate
of the discharge outlet as economic target, then, we set up mul-
ti-objective optimization poll ution reduction model. In the study,
we choose COD and ammonia nitrogen as the overall amount
control index, and obtained initial control section monitoring
data of real time, COD and NH3-N and corresponding sources
intensity index of the outlet of the emission source Q (mg/s).
Finally, we can get each coefficient, which make pollution in-
dex of the outlet of every discharge achieves water quality stan-
dard.
Emission Reduction and Control Optimization
Set emission Scenarios
1) Identify pollution sources We study the decentralized
points sources, including Industry pollution sources and life
pollution sources in Ashe River pollution management.
2) List planning object According to the research pollution
sources, we think the discharge of major pollution indicators as
the pollution reduction control object, which means COD and
ammonia nitrogen.
3) Build scenario In study area, Non-point source pollution
refers to large area, wide range, the factors such as livestock
breeding, arable land and pesticide use, compared with the
point source pollution emissions small, is always negligible;
Supposing that the concentration and total mass of sewage wa-
ter from each emissions is constant; pollutants diffusion meets
one-dimensional water quality model delete; COD concentra-
tion of Mountain Maan station-Fuerjia Bridge control section
accords with Ⅳ function area standard, when CCOD < 30 mg/L,
CNH3-N < 1.5 mg/L, there is no need to be reduced, however,
when CCOD > 30 mg/L, CNH3-N > 1.5 mg/L (Zhao et al., 2010), it
will be necessary to have optimal reduction by multi-objective
optimization model.
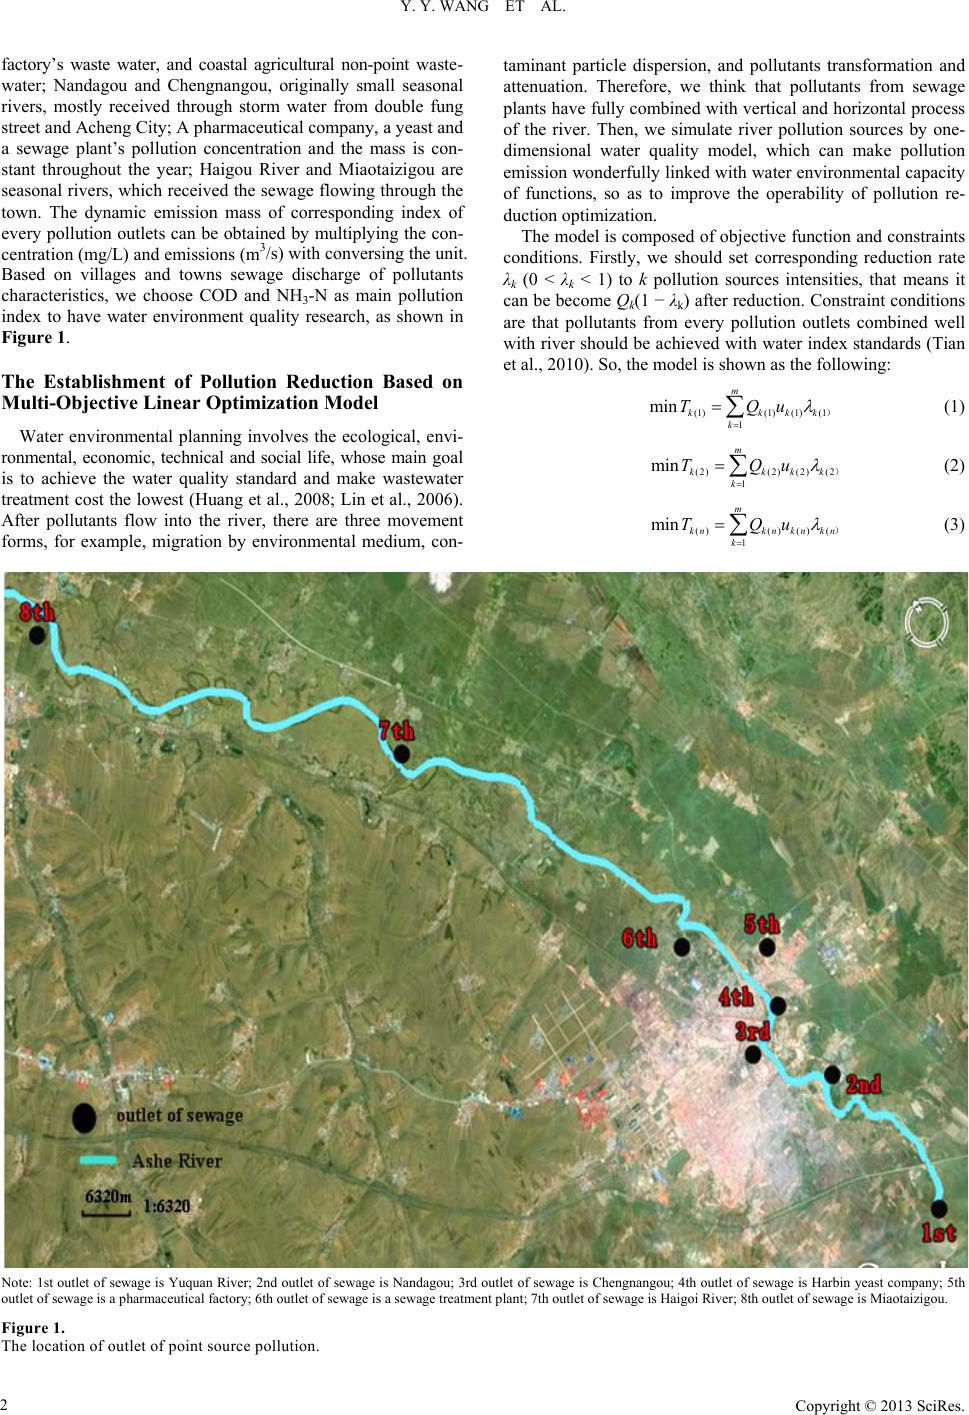
Pollution Reduction Control Technology Framework
in River
The calculating methods and implementation process of mul-
ti-objective planning pollution reduction model in view of de-
centralized point sources are as follows:
1) Determine the study area, make a survey about the river
blow-down circumstance through the local environmental mon-
itoring station, and identify the characteristics pollutants needed
to be controlled and its concentration.
2) According to basin hydraulic conditions and mixing-di-
luted-diffusion characteristics of characteristic pollutants in
water body, select the appropriate model to simulate the pollu-
tants concentration change after flowing into the river, and set
up multi-objective optimization pollution reduction model as-
sociated with the function of water environment capacity in or-
der to minimize pollution in rivers.
3) Set the reduction rate with random value in initial of the
outlet, and obtain minimum rate combination that could satisfy
the requirement of water quality in water function area by mul-
ti-objective optimization.
4) Continue to search and do overalls of optimization, until
the optimal combination of cutting rate conforming to the con-
ditions, then the result could be output, according to the results,
put forward corresponding water environmental management
strategy (http://datacenter.mep.gov.cn/trs/query.action).
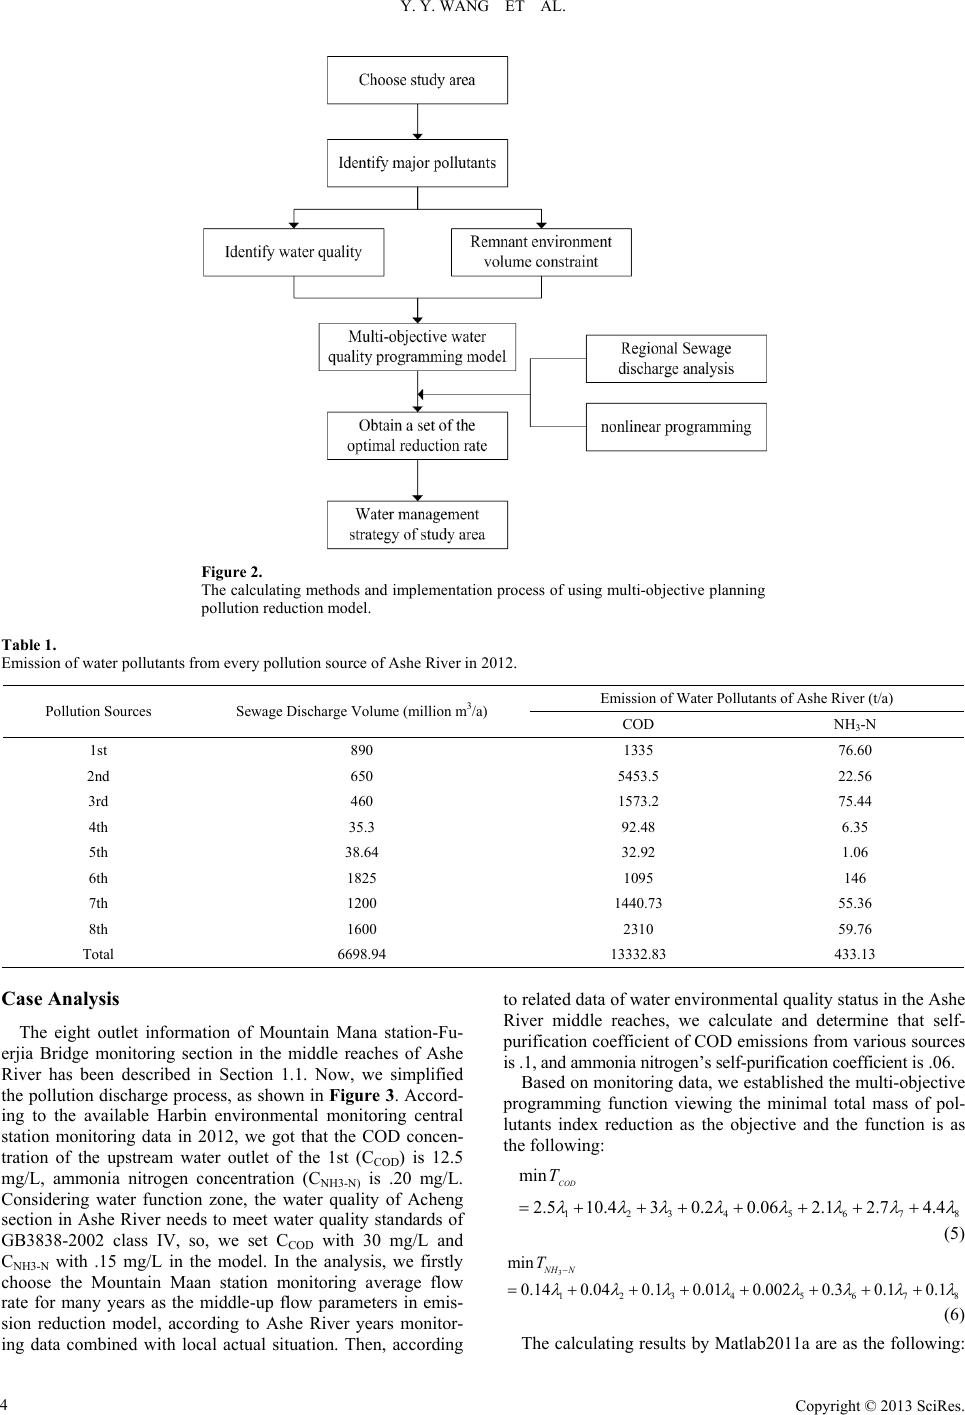
Model Application
Regional Drain a ge Analysis
In this paper, water quality management was carried out in
the middle heavy pollution reduction zone of Ashe River by
using the multi-objective planning model, and proposed pollu-
tion prevention and control countermeasures according to the
results of the simulation. There are eight main outlets in the
Acheng section of Ashe River, and we can set up efficient eco-
nomic sewage treatment facilities with high efficiency to im-
prove water quality through the reduction rate of each outlet
whose main pollut ion indicator s are COD and N H3-N. We found
that the total annual COD contribution from eight main outlets
to Ashe River is 13332.83 t/a, the NH3-N is 433.13 t/a, a nd the
total amount contribution of 6th sewage plant is 1825 m3/a;
from Table 1, the 2nd drain outlet to Ashe River has the max-
imum contribution of COD each year, accounting for about
40%; the 6th has a large amount of ammonia nitrogen pollution
contribution to Ashe River, whose ammonia nitrogen contribu-
tion to Ashe River accounts for more than 33% of all outlet.
Finally, pollution contribution of COD and ammonia nitrogen
emissions from various sources to Ashe River are shown in
Table 1.