Paper Menu >>
Journal Menu >>
 J. Biomedical Science and Engineering, 2009, 2, 96-101 Published Online April 2009 in SciRes. http://www.scirp.org/journal/jbise JBiSE The effect of different number of diffusion gradients on SNR of diffusion tensor-derived measurement maps Na Zhang1, Zhen-Sheng Deng1*, Fang Wang1, Xiao-Yi Wang2 1Institute of Biomedical Engineering, School of Info-physics and Geomatics Engineering, Central South University, Changsha, Hunan, P.R. China (410083) ; 2Department of Radiology, XiangYa Hospital of School of Medicine, Central South University, Changsha, Hunan, P.R. China (410008);*Corresponding author: Zhensheng Deng (bmedzs@csu.edu.cn or dengzhensheng@hotmail.com) Received Dec. 12th, 2008; revised Feb. 12th, 2009; accepted Feb. 16th, 2009 ABSTRACT Diffusion tensor imaging (DTI) is mainly applied to white matter fiber tracking in human brain, but there is still a debate on how many diffusion gradient directions should be used to get the best results. In this paper, the performance of 7 protocols corresponding to 6, 9, 12, 15, 20, 25, and 30 noncollinear number of diffusion gradi- ent directions (NDGD) were discussed by com- paring signal-noise ratio (SNR) of tensor- de- rived measurement maps and fractional ani- sotropy (FA) values. All DTI data (eight healthy volunteers) were downloaded from the website of Johns Hopkins Medical Institute Laboratory of Brain Anatomi- cal MRI with permission. FA, apparent diffusion constant mean (ADC-mean), the largest eigen- value (LEV), and eigenvector orientation (EVO) maps associated with LEV of all subjects were calculated derived from tensor in the 7 proto- cols via DTI Studio. A method to estimate the variance was presented to calculate SNR of these tensor-derived maps. Mean ± standard deviation of the SNR and FA values within re- gion of interest (ROI) selected in the white mat- ter were compared among the 7 protocols. The SNR were improved significantly with NDGD increasing from 6 to 20 (P<0.05). From 20 to 30, SNR were improved significantly for LEV and EVO maps (P<0.05), but no significant dif- ferences for FA and ADC-mean maps (P>0.05). There were no significant variances in FA val- ues within ROI between any two protocols (P> 0.05). The SNR could be improved with NDGD in- creasing, but an optimum protocol is needed because of clinical limitations. Keywords: Diffusion Tensor Imaging, Diffusion Gradient, Signal Noise Ratio, Estimating Vari- ance 1. INTRODUCTION Diffusion tensor imaging (DTI) has emerged as a nonin- vasive magnetic resonance imaging (MRI) modality ca- pable of providing in vivo fundamental information of the white matter structure, which is required for viewing structural connectivity in the human brain [1,2]. It is commonly used to demonstrate subtle abnormalities in a variety of diseases (including stroke, multiple sclerosis, dyslexia, and schizophrenia) and is currently becoming part of many routine clinical protocols [3]. The principle of DTI is based on diffusion anisotropy of water mo- lecular. By acquiring diffusion weighted (DW) images with diffusion gradients oriented in at least six noncol- linear directions (The tensor has 6 independent parame- ters, that is why the minimal number of diffusion gradi- ent directions (NDGD) for DTI measurement is 6), it is possible to measure the diffusion tensor modeled by a 3 dimension (3D) ellipsoid in each voxel [4,5]. The ten- sor-derived matrices, like diffusion anisotropy maps and color-coded orientation maps, which could characterize specific features of the diffusion process, can be calcu- lated from tensor via DTI Studio [6]. DTI always oper- ates under the assumption of a single ellipsoid. For esti- mation of more complex geometries, high angular reso- lution diffusion imaging (HARDI) or Q-Ball Imaging needs to be used [7]. NDGD is one of the most important factors for DW images acquisition. As NDGD increasing, more DW images are used to calculate the diffusion tensor, result- ing in more accurate tensor estimation but much longer imaging time. Considering signal-noise ratio (SNR), if the same amount of time is used to acquire DW images, one 6-diffusion gradients is used, and the other 12-diffusion gradients, in the former, more images are acquired in each direction, which results in more aver- ages, but in the latter, less averages. So which is better for single 3D ellipsoid estimation is still open to debate. Some researchers [8,9] claimed that more than 6 dif- fusion gradients can provide better measurements of the tensor than the conventional 6-diffusion gradients. A SciRes Copyright © 2009  N. Zhang et al. / J. Biomedical Science and Engineering 2 (2009) 96-101 97 SciRes Copyright © 2009 JBiSE recent study with Monte Carlo simulations[10] con- cluded that at least 20 NDGD were necessary for a ro- bust estimation of diffusion anisotropy, whereas at least 30 NDGD were required for a robust estimation of tensor orientation and mean diffusivity. Ni et al [11] found that NDGD = 6 and number of excitations (NEX) = 10 were sufficient for estimation of FA values from region of interest (ROI) calculations. All these researchers men- tioned above did their studies with the constraint of con- stant imaging time. Previous work by Poonawalla [12] concluded that when the acquisition time was held con- stant, the sum of the diffusion tensor variances decreased as NDGD increased, and signal averaging may not be as effective as increasing NDGD, especially when NDGD is small (e.g., NDGD < 13). In this paper, the SNR of fractional anisotropy (FA) maps, apparent diffusion constant mean (ADC-mean) maps, the largest eigenvalue λ1 (LEV) maps, and eigen- vector orientation (EVO) maps associated with λ1 de- rived from diffusion tensor and the FA values calculated from ROI were compared in 7 protocols corresponding to different NDGD ( 6, 9, 12, 15, 20, 25, and 30 noncol- linear). Unlike in previous work where the NEX varied to keep imaging time constant, the number of images averaged (NEX = 3) is fixed in this work so as to all the 7 protocols have the same original SNR. So the imaging time for the 7 protocols was not held constant and the higher NDGD protocols would be expected to perform better given that the imaging time was greater. The purpose of this work is to independently deter- mine the effect of NDGD on SNR of these ten- sor-derived measurement maps mentioned above with the fixed NEX. 2. MATERIALS AND METHODS All DTI data used in this paper were downloaded from the website of Johns Hopkins Medical Institute Labora- tory of Brain Anatomical MRI with permission. 2.1. Subjects All images were acquired in eight healthy volunteers (three females, five males; range, 21–29 years). The sub- jects did not have any history of neurological diseases. Institutional review board approval was obtained for the study, and informed consent was obtained from all sub- jects. 2.2. Data Acquisition A 1.5T MR scanner (Gyroscan NT; Philips Medical Systems, Best, the Netherlands) was used. DTI data were acquired by using a single-shot echo-planar imag- ing sequence with 7 protocols corresponding to different NDGD (6, 9, 12, 15, 20, 25, and 30 noncollinear), and the b value was 700 smm-2. The image matrix was 256 × 256 pixels, with a field of view of 246 × 220 mm (nominal resolution, 2.2 mm). Transverse sections of 2.2 mm thickness were acquired parallel to the anterior commissure–posterior commissure line. A total of 55 sections covered the entire hemisphere and brainstem without gaps. The acquisition time per dataset was ap- proximately 6 minutes. All DW imaging were repeated 3 times, so they have the same original SNR. Five addi- tional images for each slice with minimal DW (b_0=33 smm-2) were also acquired, and all 7 DTI acquisitions have the same b_0 images. 2.3. Definitions of DTI Measurements The ADC, which is used to characterize the water diffusion, can be calculated from the following Equation (1) [6]. b SS ADC k k )/ln( 0 =, (k = 1, 2… K; K ≥ 6) (1) where, the constant b is the diffusion-weighting factor, S0 is the signal obtained without diffusion gradient, and Sk is the signals corresponding to the different gradient directions (k=1, 2…K; K ≥ 6). ADC-mean can be calcu- lated by averaging the set of ADCk. From the diffusion tensor, three eigenvalues, λ1>λ2>λ3, which define the diffusion magnitude, can be determined by diagonalizing the tensor for each voxel. Three eigen- vectors (associated with three eigenvalues), which de- scribe the diffusivity in the three directions, can be calcu- lated. Based on these three diffusivities, the FA commonly used for anisotropy definitions is calculated to yield val- ues between 0 and 1 by the following Equation (2) [6]. ( )()() 2 3 2 2 2 1 2 3 2 2 2 1 2 3 λλλ λλλ ++ −+−+− = DDD FA (2) where, 3 321 λλλ ++ =D 2.4. SNR Calculation SNR measures the roughness or granularity of diffusion tensor-derived measurement maps, it should be equal to the ratio of power spectrum of signal to that of noise. But in general, spectrum analyze is not recommended to estimate the SNR of magnetic resonance (MR) images because it is actually re-created from frequency-signal or k-space. In addition, spectrum analyze is good for ran- dom signal (include random noise) analyze, this is not the case for the measurements derived from tensor cal- culation because the only resource of the random error during this tensor calculation comes from the finite bit length of the computers. The method presented by Mouyan Zou [13] can be used to estimate approximately SNR of an image, which is the variance of signal divided by that of noise. Ac- cording to the theory, local variance of all pixels of an image should be calculated, the maximum of the local variance which stands for the signal variance is divided by the minimum which stands for the noise variance, and the result (see Equation (3)) as the approximate SNR should be amended by empirical formula. 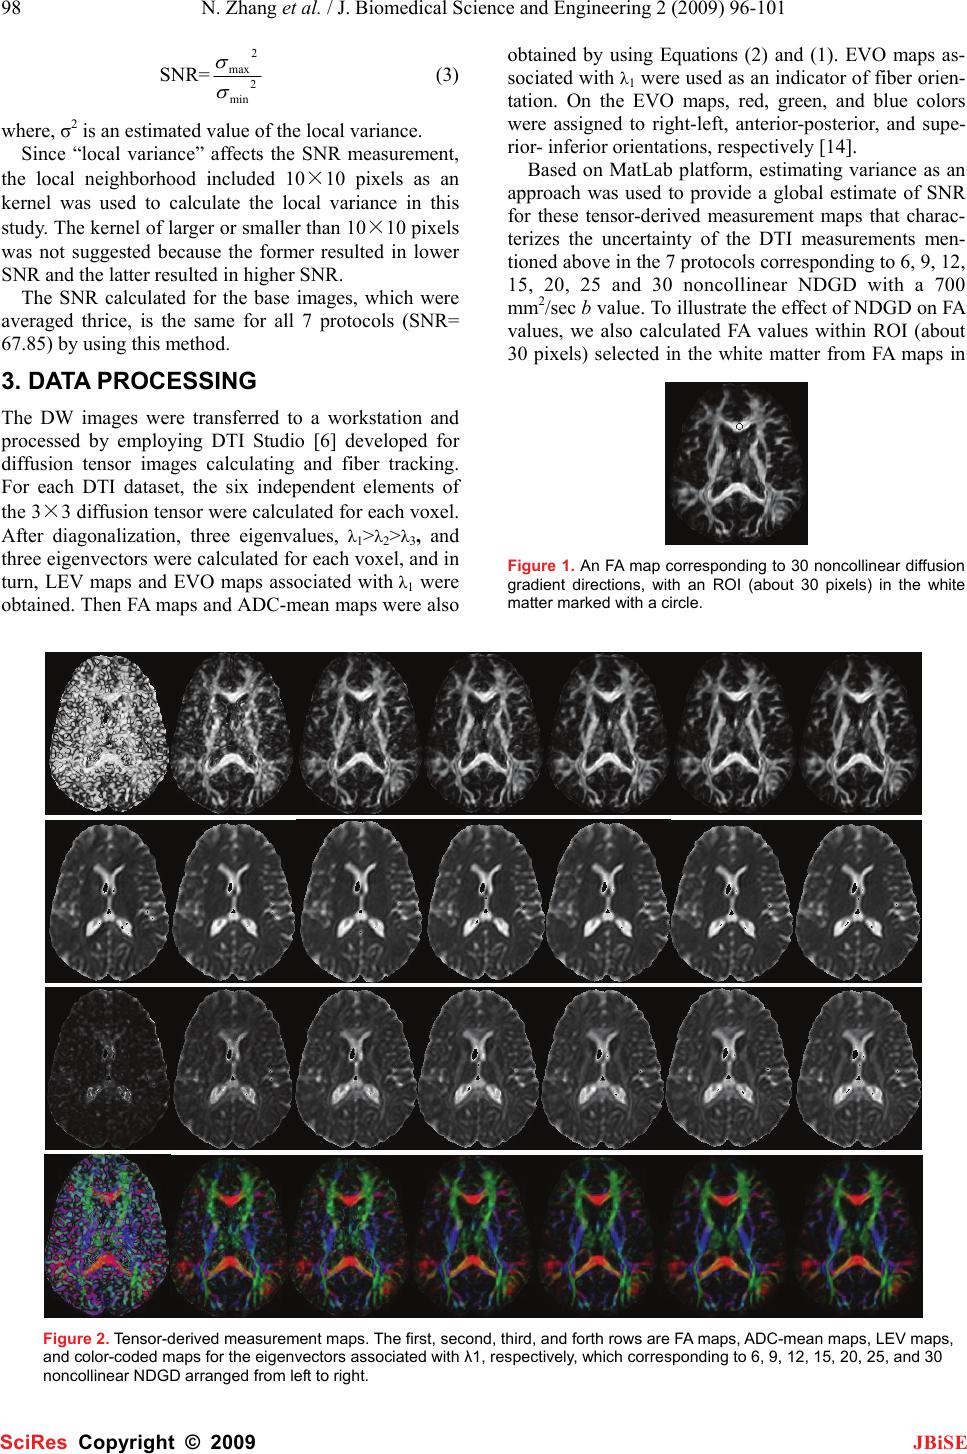 98 N. Zhang et al. / J. Biomedical Science and Engineering 2 (2009) 96-101 SciRes Copyright © 2009 JBiSE SNR= 2 min 2 max σ σ (3) where, σ2 is an estimated value of the local variance. Since “local variance” affects the SNR measurement, the local neighborhood included 10×10 pixels as an kernel was used to calculate the local variance in this study. The kernel of larger or smaller than 10×10 pixels was not suggested because the former resulted in lower SNR and the latter resulted in higher SNR. The SNR calculated for the base images, which were averaged thrice, is the same for all 7 protocols (SNR= 67.85) by using this method. 3. DATA PROCESSING The DW images were transferred to a workstation and processed by employing DTI Studio [6] developed for diffusion tensor images calculating and fiber tracking. For each DTI dataset, the six independent elements of the 3×3 diffusion tensor were calculated for each voxel. After diagonalization, three eigenvalues, λ1>λ2>λ3, and three eigenvectors were calculated for each voxel, and in turn, LEV maps and EVO maps associated with λ1 were obtained. Then FA maps and ADC-mean maps were also obtained by using Equations (2) and (1). EVO maps as- sociated with λ1 were used as an indicator of fiber orien- tation. On the EVO maps, red, green, and blue colors were assigned to right-left, anterior-posterior, and supe- rior- inferior orientations, respectively [14]. Based on MatLab platform, estimating variance as an approach was used to provide a global estimate of SNR for these tensor-derived measurement maps that charac- terizes the uncertainty of the DTI measurements men- tioned above in the 7 protocols corresponding to 6, 9, 12, 15, 20, 25 and 30 noncollinear NDGD with a 700 mm2/sec b value. To illustrate the effect of NDGD on FA values, we also calculated FA values within ROI (about 30 pixels) selected in the white matter from FA maps in Figure 1. An FA map corresponding to 30 noncollinear diffusion gradient directions, with an ROI (about 30 pixels) in the white matter marked with a circle. Figure 2. Tensor-derived measurement maps. The first, second, third, and forth rows are FA maps, ADC-mean maps, LEV maps, and color-coded maps for the eigenvectors associated with λ1, respectively, which corresponding to 6, 9, 12, 15, 20, 25, and 30 noncollinear NDGD arranged from left to right. 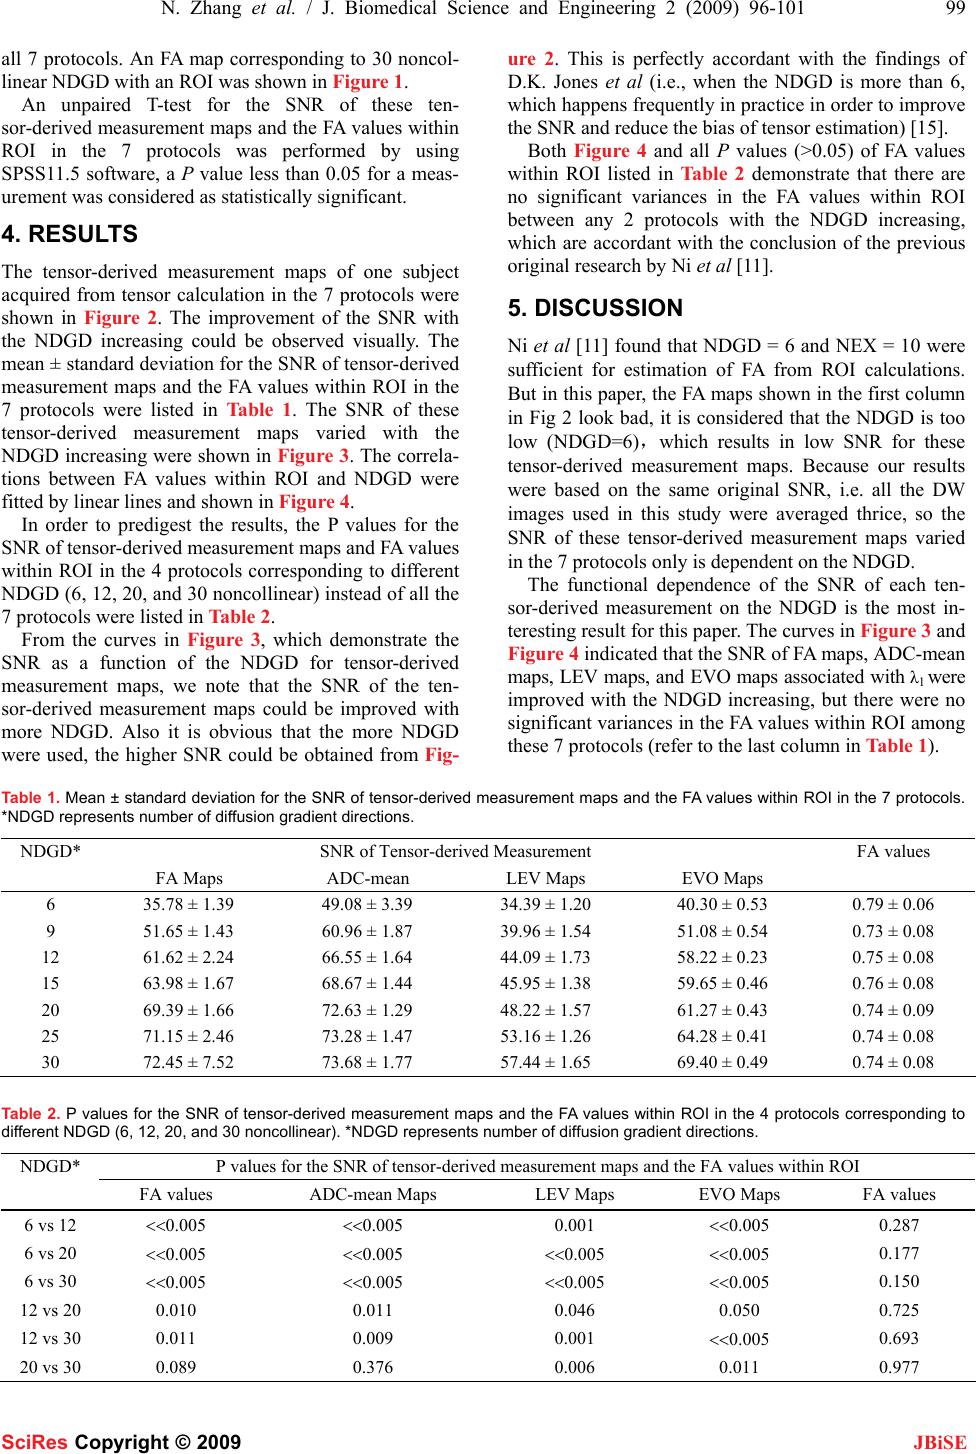 N. Zhang et al. / J. Biomedical Science and Engineering 2 (2009) 96-101 99 SciRes Copyright © 2009 JBiSE all 7 protocols. An FA map corresponding to 30 noncol- linear NDGD with an ROI was shown in Figure 1. An unpaired T-test for the SNR of these ten- sor-derived measurement maps and the FA values within ROI in the 7 protocols was performed by using SPSS11.5 software, a P value less than 0.05 for a meas- urement was considered as statistically significant. 4. RESULTS The tensor-derived measurement maps of one subject acquired from tensor calculation in the 7 protocols were shown in Figure 2. The improvement of the SNR with the NDGD increasing could be observed visually. The mean ± standard deviation for the SNR of tensor-derived measurement maps and the FA values within ROI in the 7 protocols were listed in Table 1. The SNR of these tensor-derived measurement maps varied with the NDGD increasing were shown in Figure 3. The correla- tions between FA values within ROI and NDGD were fitted by linear lines and shown in Figure 4. In order to predigest the results, the P values for the SNR of tensor-derived measurement maps and FA values within ROI in the 4 protocols corresponding to different NDGD (6, 12, 20, and 30 noncollinear) instead of all the 7 protocols were listed in Table 2. From the curves in Figure 3, which demonstrate the SNR as a function of the NDGD for tensor-derived measurement maps, we note that the SNR of the ten- sor-derived measurement maps could be improved with more NDGD. Also it is obvious that the more NDGD were used, the higher SNR could be obtained from Fig- ure 2. This is perfectly accordant with the findings of D.K. Jones et al (i.e., when the NDGD is more than 6, which happens frequently in practice in order to improve the SNR and reduce the bias of tensor estimation) [15]. Both Figure 4 and all P values (>0.05) of FA values within ROI listed in Table 2 demonstrate that there are no significant variances in the FA values within ROI between any 2 protocols with the NDGD increasing, which are accordant with the conclusion of the previous original research by Ni et al [11]. 5. DISCUSSION Ni et al [11] found that NDGD = 6 and NEX = 10 were sufficient for estimation of FA from ROI calculations. But in this paper, the FA maps shown in the first column in Fig 2 look bad, it is considered that the NDGD is too low (NDGD=6),which results in low SNR for these tensor-derived measurement maps. Because our results were based on the same original SNR, i.e. all the DW images used in this study were averaged thrice, so the SNR of these tensor-derived measurement maps varied in the 7 protocols only is dependent on the NDGD. The functional dependence of the SNR of each ten- sor-derived measurement on the NDGD is the most in- teresting result for this paper. The curves in Figure 3 and Figure 4 indicated that the SNR of FA maps, ADC-mean maps, LEV maps, and EVO maps associated with λ1 were improved with the NDGD increasing, but there were no significant variances in the FA values within ROI among these 7 protocols (refer to the last column in Table 1). Table 1. Mean ± standard deviation for the SNR of tensor-derived measurement maps and the FA values within ROI in the 7 protocols. *NDGD represents number of diffusion gradient directions. NDGD* SNR of Tensor-derived Measurement FA values FA Maps ADC-mean LEV Maps EVO Maps 6 35.78 ± 1.39 49.08 ± 3.39 34.39 ± 1.20 40.30 ± 0.53 0.79 ± 0.06 9 51.65 ± 1.43 60.96 ± 1.87 39.96 ± 1.54 51.08 ± 0.54 0.73 ± 0.08 12 61.62 ± 2.24 66.55 ± 1.64 44.09 ± 1.73 58.22 ± 0.23 0.75 ± 0.08 15 63.98 ± 1.67 68.67 ± 1.44 45.95 ± 1.38 59.65 ± 0.46 0.76 ± 0.08 20 69.39 ± 1.66 72.63 ± 1.29 48.22 ± 1.57 61.27 ± 0.43 0.74 ± 0.09 25 71.15 ± 2.46 73.28 ± 1.47 53.16 ± 1.26 64.28 ± 0.41 0.74 ± 0.08 30 72.45 ± 7.52 73.68 ± 1.77 57.44 ± 1.65 69.40 ± 0.49 0.74 ± 0.08 Table 2. P values for the SNR of tensor-derived measurement maps and the FA values within ROI in the 4 protocols corresponding to different NDGD (6, 12, 20, and 30 noncollinear). *NDGD represents number of diffusion gradient directions. NDGD* P values for the SNR of tensor-derived measurement maps and the FA values within ROI FA values ADC-mean Maps LEV Maps EVO Maps FA values 6 vs 12 <<0.005 <<0.005 0.001 <<0.005 0.287 6 vs 20 <<0.005 <<0.005 <<0.005 <<0.005 0.177 6 vs 30 <<0.005 <<0.005 <<0.005 <<0.005 0.150 12 vs 20 0.010 0.011 0.046 0.050 0.725 12 vs 30 0.011 0.009 0.001 <<0.005 0.693 20 vs 30 0.089 0.376 0.006 0.011 0.977 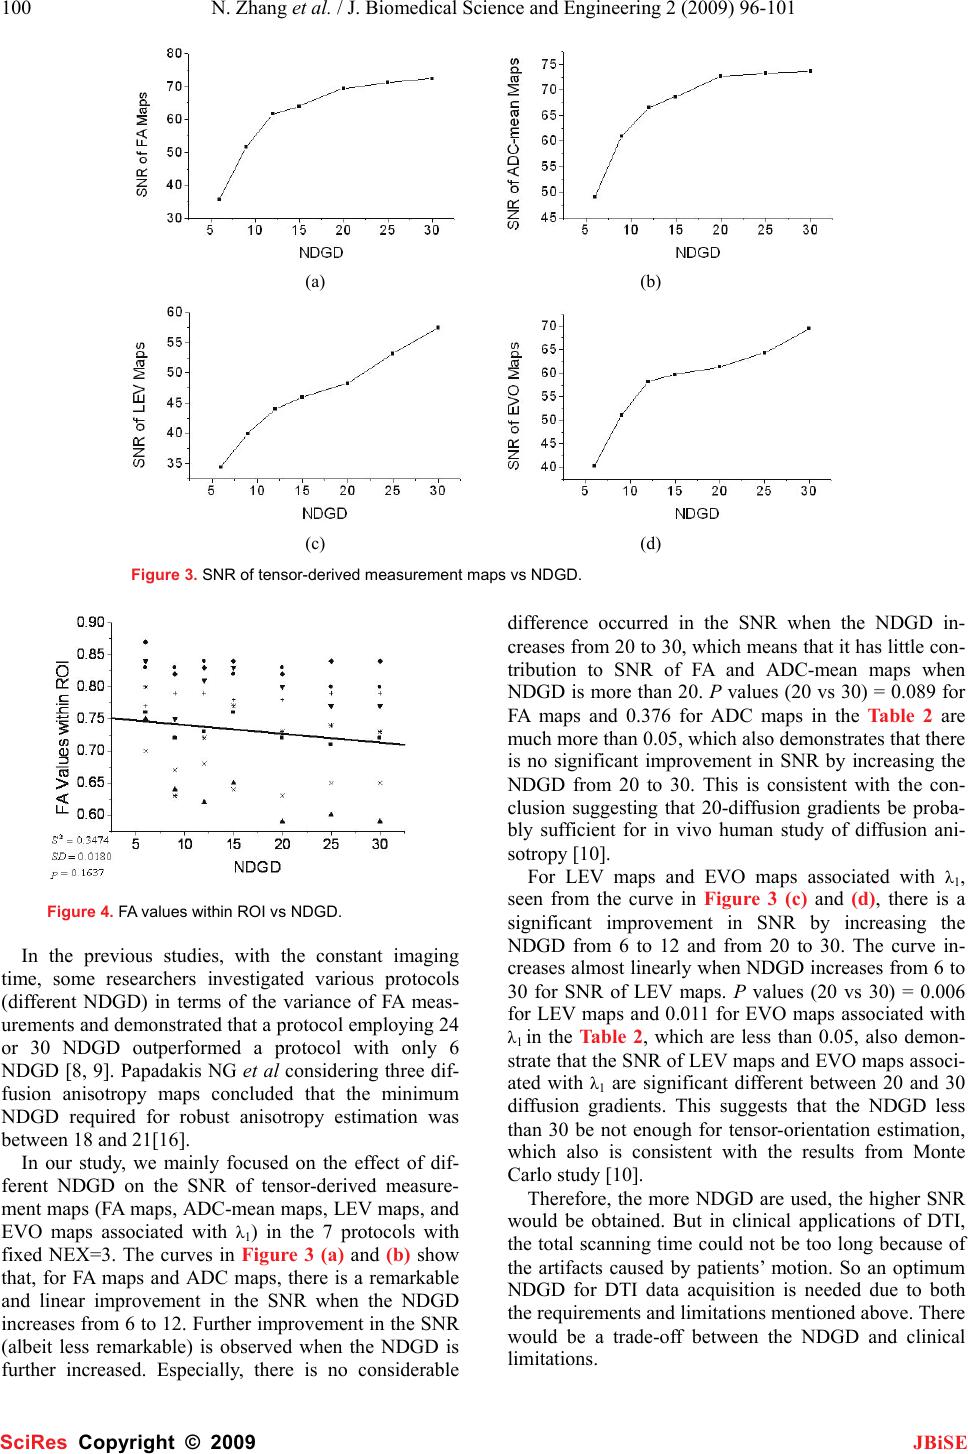 100 N. Zhang et al. / J. Biomedical Science and Engineering 2 (2009) 96-101 SciRes Copyright © 2009 JBiSE (a) (b) (c) (d) Figure 3. SNR of tensor-derived measurement maps vs NDGD. Figure 4. FA values within ROI vs NDGD. In the previous studies, with the constant imaging time, some researchers investigated various protocols (different NDGD) in terms of the variance of FA meas- urements and demonstrated that a protocol employing 24 or 30 NDGD outperformed a protocol with only 6 NDGD [8, 9]. Papadakis NG et al considering three dif- fusion anisotropy maps concluded that the minimum NDGD required for robust anisotropy estimation was between 18 and 21[16]. In our study, we mainly focused on the effect of dif- ferent NDGD on the SNR of tensor-derived measure- ment maps (FA maps, ADC-mean maps, LEV maps, and EVO maps associated with λ1) in the 7 protocols with fixed NEX=3. The curves in Figure 3 (a) and (b) show that, for FA maps and ADC maps, there is a remarkable and linear improvement in the SNR when the NDGD increases from 6 to 12. Further improvement in the SNR (albeit less remarkable) is observed when the NDGD is further increased. Especially, there is no considerable difference occurred in the SNR when the NDGD in- creases from 20 to 30, which means that it has little con- tribution to SNR of FA and ADC-mean maps when NDGD is more than 20. P values (20 vs 30) = 0.089 for FA maps and 0.376 for ADC maps in the Table 2 are much more than 0.05, which also demonstrates that there is no significant improvement in SNR by increasing the NDGD from 20 to 30. This is consistent with the con- clusion suggesting that 20-diffusion gradients be proba- bly sufficient for in vivo human study of diffusion ani- sotropy [10]. For LEV maps and EVO maps associated with λ1, seen from the curve in Figure 3 (c) and (d), there is a significant improvement in SNR by increasing the NDGD from 6 to 12 and from 20 to 30. The curve in- creases almost linearly when NDGD increases from 6 to 30 for SNR of LEV maps. P values (20 vs 30) = 0.006 for LEV maps and 0.011 for EVO maps associated with λ1 in the Table 2, which are less than 0.05, also demon- strate that the SNR of LEV maps and EVO maps associ- ated with λ1 are significant different between 20 and 30 diffusion gradients. This suggests that the NDGD less than 30 be not enough for tensor-orientation estimation, which also is consistent with the results from Monte Carlo study [10]. Therefore, the more NDGD are used, the higher SNR would be obtained. But in clinical applications of DTI, the total scanning time could not be too long because of the artifacts caused by patients’ motion. So an optimum NDGD for DTI data acquisition is needed due to both the requirements and limitations mentioned above. There would be a trade-off between the NDGD and clinical limitations. 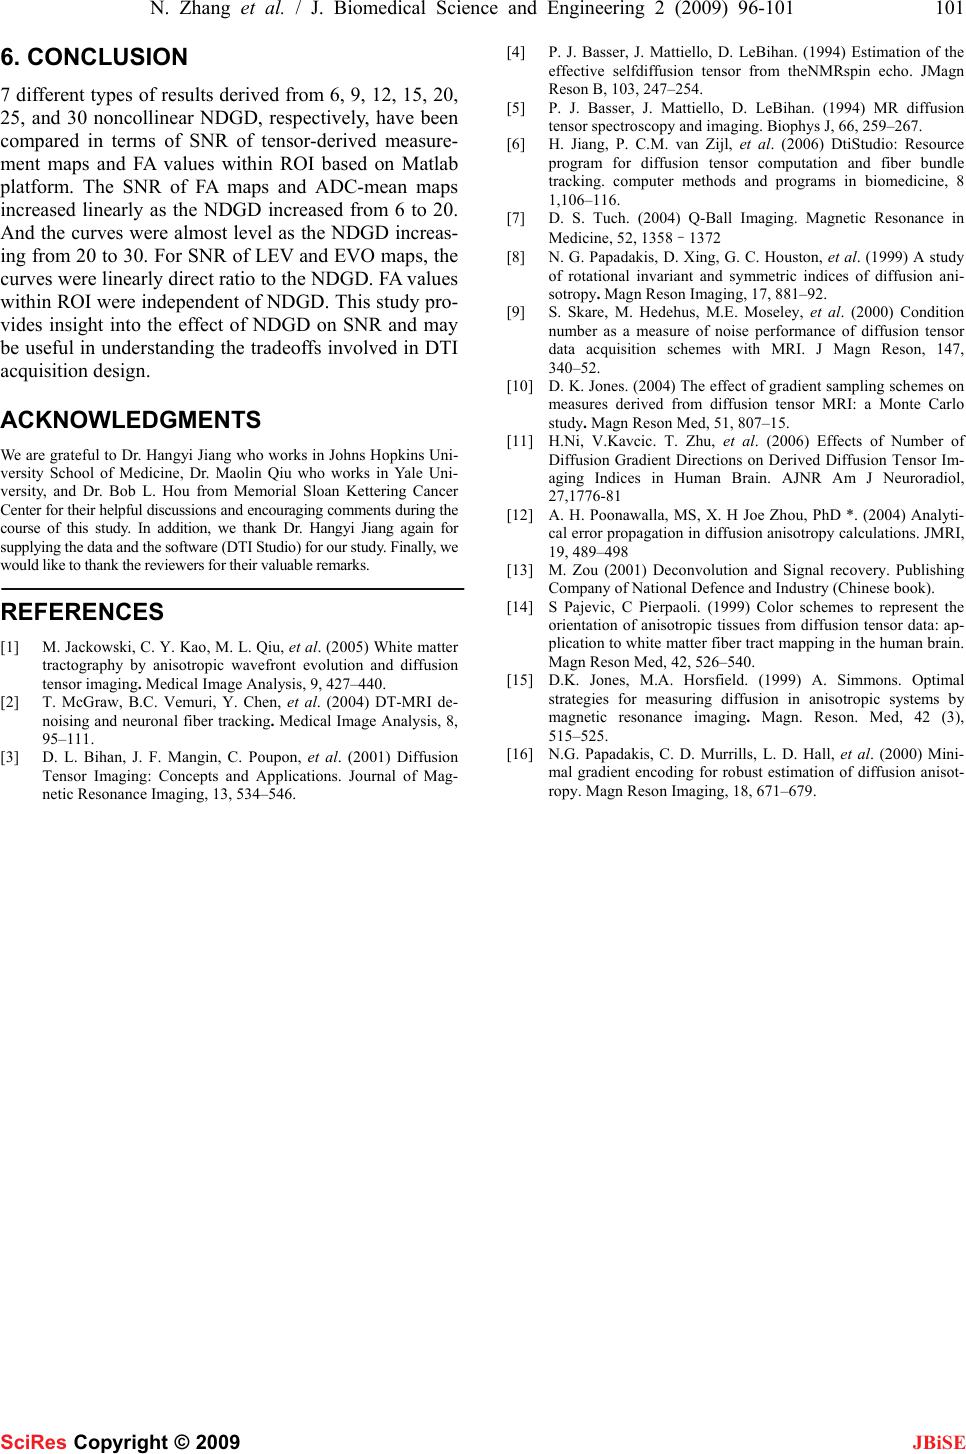 N. Zhang et al. / J. Biomedical Science and Engineering 2 (2009) 96-101 101 SciRes Copyright © 2009 JBiSE 6. CONCLUSION 7 different types of results derived from 6, 9, 12, 15, 20, 25, and 30 noncollinear NDGD, respectively, have been compared in terms of SNR of tensor-derived measure- ment maps and FA values within ROI based on Matlab platform. The SNR of FA maps and ADC-mean maps increased linearly as the NDGD increased from 6 to 20. And the curves were almost level as the NDGD increas- ing from 20 to 30. For SNR of LEV and EVO maps, the curves were linearly direct ratio to the NDGD. FA values within ROI were independent of NDGD. This study pro- vides insight into the effect of NDGD on SNR and may be useful in understanding the tradeoffs involved in DTI acquisition design. ACKNOWLEDGMENTS We are grateful to Dr. Hangyi Jiang who works in Johns Hopkins Uni- versity School of Medicine, Dr. Maolin Qiu who works in Yale Uni- versity, and Dr. Bob L. Hou from Memorial Sloan Kettering Cancer Center for their helpful discussions and encouraging comments during the course of this study. In addition, we thank Dr. Hangyi Jiang again for supplying the data and the software (DTI Studio) for our study. Finally, we would like to thank the reviewers for their valuable remarks. REFERENCES [1] M. Jackowski, C. Y. Kao, M. L. Qiu, et al. (2005) White matter tractography by anisotropic wavefront evolution and diffusion tensor imaging. Medical Image Analysis, 9, 427–440. [2] T. McGraw, B.C. Vemuri, Y. Chen, et al. (2004) DT-MRI de- noising and neuronal fiber tracking. Medical Image Analysis, 8, 95–111. [3] D. L. Bihan, J. F. Mangin, C. Poupon, et al. (2001) Diffusion Tensor Imaging: Concepts and Applications. Journal of Mag- netic Resonance Imaging, 13, 534–546. [4] P. J. Basser, J. Mattiello, D. LeBihan. (1994) Estimation of the effective selfdiffusion tensor from theNMRspin echo. JMagn Reson B, 103, 247–254. [5] P. J. Basser, J. Mattiello, D. LeBihan. (1994) MR diffusion tensor spectroscopy and imaging. Biophys J, 66, 259–267. [6] H. Jiang, P. C.M. van Zijl, et al. (2006) DtiStudio: Resource program for diffusion tensor computation and fiber bundle tracking. computer methods and programs in biomedicine, 8 1,106–116. [7] D. S. Tuch. (2004) Q-Ball Imaging. Magnetic Resonance in Medicine, 52, 1358–1372 [8] N. G. Papadakis, D. Xing, G. C. Houston, et al. (1999) A study of rotational invariant and symmetric indices of diffusion ani- sotropy. Magn Reson Imaging, 17, 881–92. [9] S. Skare, M. Hedehus, M.E. Moseley, et al. (2000) Condition number as a measure of noise performance of diffusion tensor data acquisition schemes with MRI. J Magn Reson, 147, 340–52. [10] D. K. Jones. (2004) The effect of gradient sampling schemes on measures derived from diffusion tensor MRI: a Monte Carlo study. Magn Reson Med, 51, 807–15. [11] H.Ni, V.Kavcic. T. Zhu, et al. (2006) Effects of Number of Diffusion Gradient Directions on Derived Diffusion Tensor Im- aging Indices in Human Brain. AJNR Am J Neuroradiol, 27,1776-81 [12] A. H. Poonawalla, MS, X. H Joe Zhou, PhD *. (2004) Analyti- cal error propagation in diffusion anisotropy calculations. JMRI, 19, 489–498 [13] M. Zou (2001) Deconvolution and Signal recovery. Publishing Company of National Defence and Industry (Chinese book). [14] S Pajevic, C Pierpaoli. (1999) Color schemes to represent the orientation of anisotropic tissues from diffusion tensor data: ap- plication to white matter fiber tract mapping in the human brain. Magn Reson Med, 42, 526–540. [15] D.K. Jones, M.A. Horsfield. (1999) A. Simmons. Optimal strategies for measuring diffusion in anisotropic systems by magnetic resonance imaging. Magn. Reson. Med, 42 (3), 515–525. [16] N.G. Papadakis, C. D. Murrills, L. D. Hall, et al. (2000) Mini- mal gradient encoding for robust estimation of diffusion anisot- ropy. Magn Reson Imaging, 18, 671–679. |