 Journal of Sustainable Bioenergy Systems, 2013, 3, 186-193 http://dx.doi.org/10.4236/jsbs.2013.33026 Published Online September 2013 (http://www.scirp.org/journal/jsbs) Controlled Batch Leaching Conditions for Optimal Upgrading of Agricultural Biomass Prabahar Ravichandran1, Duncan Gibb2, Kenneth Corscadden1 1Department of Engineering, Faculty of Agriculture, Dalhousie University, Truro, Canada 2Centre for Renewable Energy, University of Freiburg, Freiburg, Germany Email: Prabahar.Ravichandran@dal.ca Received June 10, 2013; revised July 15, 2013; accepted July 28, 2013 Copyright © 2013 Prabahar Ravichandran et al. This is an open access article distributed under the Creative Commons Attribution License, which permits unrestricted use, distribution, and reproduction in any medium, provided the original work is properly cited. ABSTRACT Agricultural biomass presents a promising feedstock, which may contribute to a transition to low carbon fuels. A sig- nificant amount of research has identified a number of challenges when combusting agricultural feedstock, related pri- marily to energy value, ash, emissions, corrosion and combustion characteristics. The mitigation of such challenges can be addressed more cost effectively when dealing with large or utility scale combustion. The costs associated with har- vesting, conversion, transportation and ultimately, market development all create additional roadblocks for the creation of an agricultural biomass industry. Nova Scotia, an Eastern Canadian province, has significant land resources, however it is prone to wet spring and as yet does not have a supply chain established for such an industry. The main components of supply, processing and conversion and demand simply do not yet exist. This research addresses one aspect of this supply chain by attempting to develop a fuel suitable for a) existing markets (local residential wood and wood pellet stoves and b) a scale that will support industry engagement. The outcomes of this research have determined that such a venture is possible and presents empirical preprocessing conditions to achieve a competitive agricultural fuel. Keywords: Optimal Leaching; Agricultural Biomass; Fuel Design; Ash Reduction 1. Introduction The drive to reduce Green House Gas (GHG) emissions and increase renewable energy has created an opportu- nity for alternative sources of biomass fuel or bioenergy, particularly for residual applications [1,2]. The term bio- mass has historically been used to describe wood based fuel, in either raw or densified form. One common ex- ample is the wood pellet, compacted biomass, which results in a homogeneous fuel with better handling and transportation characteristics than wood logs. Most pel- lets are made from by-products, such as sawdust and ground wood chips, inherent in many primary wood processing operations which help reduce the costs asso- ciated with waste disposal. The global pellet industry had an estimated 6 million tons production capacity in 2006, 50% of which originated from Sweden and North Amer- ica with an additional 1.2 million tons from Canada [3]. This industry has seen steady growth in recent years reaching 28 million tons [4] by 2010. Agricultural crops and crop residue are relatively un- tapped energy sources which present an attractive low cost local fuel with potential to augment wood based biomass and to some degree replace a portion of fossil fuels for the production of heat and power [5,6]. In addi- tion, the combustion of agricultural biomass is generally regarded as carbon neutral [7,8] with annual growing cycles. The presence of alkali metals and other inorganic elements inherent in agricultural biomass when com- busted creates elevated ash content, 10 to 20 times that of wood pellets, corrosion, slag formation and emissions, all of which may have significant economic or environ- mental impact and ultimately limit the combustion po- tential of agricultural biomass [9]. These limitations arise primarily from inorganic elements such as potassium (K) and chlorine (Cl) present in the raw material. K is the largest contributor to ash and slag formation, however alkali metals such as sodium (Na) can also lower the melting temperature of the ash, which causes a greater formation of fused ash known as clinkers [10]. Research conducted by the National Renewable Energy Laboratory (NREL) reports that essentially all biologically occurring alkali material has high mobility, where mobility is de- fined as the ability of a material to come in contact with other material [11]. This applies especially to K, whose mobility is facilitated by Cl, which acts as a shuttle C opyright © 2013 SciRes. JSBS  P. RAVICHANDRAN ET AL. 187 transporting K to the surface of the material where the ash compounds are formed. The presence of K and Cl also increases its potential for corrosion [12]. When K is transported to the surface by Cl it tends to form chlorides, hydroxides and sulfates, all of which are significant in the corrosion mechanism [13]. Ca is also commonly found in biomass which forms oxides, and to a lesser extent carbonates, but is less volatile than K and lacks similar corrosion potential [14]. Paulrud et al. also sug- gested a link between high Si concentrations and ash for- mation [15]. Combustion of the material comprised of metal oxides and silicon dioxide at temperatures typically in excess of 800˚C causes K to react with the silicon-rich substance and form alkali-silicate compounds known as slag [16,17], the composition and strength of which is dependent on the fuel ash composition [18]. Fuels rich in, Si and K also contribute to higher levels of deposits on furnace heat exchanger tubes [19], resulting in an in- crease requirement for boiler maintenance. Fuels with little alkali/silica are reported to produce fewer and more manageable deposits [20,21], however Ogden et al. de- termined that K will form oxides, hydroxides, chlorides and sulfates which also contribute to slagging and foul- ing of furnaces [22]. Increasing environmental restrictions means that combustion analysis of fuels should also consider flue gas and particulate emissions. Biomass combustion re- leases CO, NO, NO2 and SO2. The presence of N and S create NOx and SOx oxides released through the flue which are classified as harmful emissions [23]. NOx (NO, NO2 and other oxides of nitrogen) and SOx (SO2 and other oxides of Sulfur) primarily depend on the nitrogen and sulfur content of the fuel [6]. While wheat straw fuel has relatively low emissions during combustion, wood fuel is typically lower [24]. The vapors from incomplete combustion and fly ash inorganic materials resulting from potassium, sulfur, chlorine and oxygen [25] parti- cles condense to form particulate matter [21], which has been associated with various respiratory and cardiovas- cular issues [11,26]. It is therefore necessary to reduce the presence of K and Cl in biomass prior to combustion before agricultural biomass can be used as a fuel for residential combustion appliances. While concentrations of carbon, hydrogen and oxygen remain relatively con- stant in grass biomass, the grasses vary with respect to their ash forming constituents [27]. Biomass composition can be influenced by the management of fertilizers, har- vesting techniques, time of harvest and climate, all of which affect the end-composition of the raw material and thus its combustion suitability. Literature suggests that the main mitigation option relates to the solubility of the alkali metals and the potential to avoid the use of Industrial chemicals or complicated processes and simply remove the inorganic materials by in-field leaching. Leaching periods can range from as little as one week up to a few months, depending on the grass species [22]. Switchgrass performs considerably well if cut in early fall and left over winter to leach, resulting in low ash content and a similar concentration of potassium to that found in wood pellets. Allowing the crop to stand over winter can have similar results, and has proved promising for reed canary grass [27], however in both cases a re- duction in biomass yield is experienced, especially in geographical locations that experience wet springs. Had- ders and Olsson [19] reported an average loss of 25% in yield due to delayed harvesting. To avoid yield loss, the biomass could be harvested in fall and the inorganic elements leached in a controlled manner by submerging biomass in water [23,28]. Jenkins et al. [17] showed that soaking or flushing in water has similar effects of in-field leaching, but requires addi- tional drying before it could be milled and further densi- fied. This technique should have less contamination and higher yields than that experienced with in-field leaching. The results of research on leaching of various types of grass biomass strongly support the removal of K and Cl. Si was typically found to increase or decrease slightly, but with high removal of K the slagging tendency will fall accordingly. Tonn et al. [29] investigated the effi- cacy of leaching of two types of biomass: dry calcareous grass (Mesobromium) and hay meadow (Arrhenatherion). Their work reported an average 63% reduction for K and 82% for Cl after 120 min of leaching, while Si was found to increase by 10% over the same period. Skoulou et al. [30] performed leaching on raw olive kernel biomass and found that alkali and chlorine were “significantly” re- duced. Turn et al. [31] leached banagrass for only three (3) minutes, and reported a 90% and approximately 100% reduction of K and Cl respectively. This study also found Si to be the most persistent, with reductions of less than 15%. Jenkins et al. [32] reduced K and Cl concen- trations in wheat straw by 81% and 92% respectively, with only 65 mm of natural precipitation. There are po- tential applications for regions like Nova Scotia to im- plement controlled leaching. Nova Scotia has sufficient land which could be utilized for energy crop production. The region however typically experiences mild and wet springs which cause significant damage to crops that have not been harvested in the fall or winter. Producers have reported wide variability in crop quality and in some cases lost the harvest completely by delaying har- vest until spring. This region would benefit from a proc- ess whereby the biomass material is harvested in late fall early winter and a controlled preprocessing leaching method developed that can be implemented over the winter. This paper presents the results of a study to de- velop such a process. The study investigates the impact of several variables on the modification of four feed- Copyright © 2013 SciRes. JSBS  P. RAVICHANDRAN ET AL. 188 stocks native to Nova Scotia, which include reed canary grass, barley straw, switchgrass and wheat straw. The input variables include water temperature and residence time with the objective of identifying the optimal condi- tions for creating an upgraded agricultural biomass feed- stock suitable for combustion in residential wood burning appliances. 2. Materials and Methods 2.1. Feedstock for the Experiments The following experiments were carried out using four feedstock (reed canary and switch grass that represent energy crops, and barley and wheat straw that represent commonly available crop residue). Reed canary grass (Phalaris arundinacea) was collected form a dairy farm near Truro, NS (+45˚22'46.3", −63˚27'38.6"). Switch grass (Panicum varigatum) was boughtfrom a commer- cial energy crop grower located in Antigonish, NS (+45˚33'40.6", −61˚51'9.6"). Wheat (Triticum spp.) and Barley (Hordeum vulgare) were collected from the ex- perimental farm plot of Dalhousie University, Faculty of Agriculture in Truro, NS (+45˚22'23.2", −63˚15'17.2"). 2.2. Experimental Design A 2 × 3 full factorial design was used for the design of experiments. Leaching experiments were designed to investigate the potential impact of water temperature and residence time in controlled batch leaching or washing of agricultural biomass. Two (2) different residence times and three (3) different water temperatures were selected as experimental variables, to yield six (6) experiments per feedstock for a total of 24 experiments and the ex- periments have been replicated three times. In order to obtain a homogeneous sample, for each of the four raw feedstocks, the following process was used. Each feedstock was milled separately using a New Hol- land 358 hammer mill fitted with a 1/8-inch screen. Afew hundred grams of each feedstock was dried in a Fisher Scientific - isotemp programmable muffle furnace at 105˚C for 24 hours. Fifteen (15) grams of each oven-dried feedstock sam- ple was then added toone (1) liter of millipore water in a hot water bath, which was heated to the three experi- mental temperatures of 20˚C, 50˚C and 80˚C. The tem- perature was maintained using a Julabo refrigerated and heating circulator. The feedstocksamples were manually agitated for five (5) minutes and a circular steel mesh pushed through the top of the beaker to submerge the sample thoroughly in the water. Samples of each feed- stock were taken after the two experimental residence times of 6 hours and 24 hours and filtered through whatmann 2 filter paper. The filter samples were oven- dried again at 105˚C for 24 hours. 2.3. Analytical Methods The leached and unleached feedstock once oven-dried, were then ground in a mini-wily mill with a 40 mesh. These ground samples were analyzed for ash, alkali met- als (K, Na, Ca, Mg), nitrogen and sulfur. The ash content of each feedstock was analyzed using ASTM E1755-01 (Standard Test Method for Ash in Biomass). Ash content is represented as the mass percentage of residue remain- ing after dry oxidation at 575˚C ± 25˚C of the oven-dried sample. Atomic Absorption Spectroscopy was performed using a Varian SpectrAA 200FS to analyze Potassium (K), Calcium (Ca), Sodium (Na) and Magnesium (Mg). One (1) gram of each feedstock was placed in a porcelain dish and preheated in an electric furnace for approximately 20 minutes. After which the samples were ignited in a muf- fle furnace at 550˚C for atleast 6 hours. The ash sam- pleswere allowed to cool in a dessicator for at least one (1) hour and 10 ml of 5% HCl added to the dishes. Ten (10) minutes later the dishes were rinsed into a 50 ml volumetric flask through a whatmann 1 filter in a conical funnel. The extracted feedstock samples were then ana- lyzed for alkali metals with the concentration represented in mg/g. ASTM D4208-13 (Standard Test Method for Total Chlorine in Coal by the Oxygen Bomb Combustion/Ion Selective Electrode Method) was used to analyze total chlorine for each feedstock sample. Total chlorine con- tent in the sample was presented in ppm. LECO-3000 CNS was used to analyze total nitrogen and sulfur, aap- proximately 0.2 grams of each feedstock sample was placed in tin foil, wrapped and loaded in the auto-sam- pler. The sampler was loaded initially with three blanks and three standards. Additionally, a standard was loaded with a blank every tenth sample. 2.4. Statistical Analysis The results of the leached feedstock representing each of the experimental variables (time and temperature) were compared to the unleached control feedstock samples presented as % x-reduction, which can be defined as, leached unleached unleached % reduction100 xx xx % reduction in ash and other elemental concentration was analyzed using central composite full factorial de- sign. The influence of residence time and water tempera- ture was assessed separately for each feedstock using ANOVA in a full factorial design. Since the analysis contains two factors and one of those factors is time, re- peated statement in MIXED procedure of SAS 9.3 (SAS Institute Inc.) was implemented. The following model was used for analysis, Copyright © 2013 SciRes. JSBS  P. RAVICHANDRAN ET AL. 189 ijkijij ijk Y where, μ = overall mean; αi = effect of temperature factor; βj = effect of time factor; αβij = interaction effect of tem- perature and time factor; εijk = overall experimental error. The statistical assumptions are checked to validate the ANOVA results. When the ANOVA results are signifi- cant (if P-value is less than 0.05(α)) for the interaction effect, Tukey’s test (α = 0.05) were used to compare the means for different resident time and water temperature combinations. If and only if, the interaction is not sig- nificant the significance of the main effect is considered for means comparison. 3. Results Ash, nitrogen, sulfurs, chlorine and other alkali metals such as potassium, sodium, magnesium and calcium are some of the potential elements that contribute to higher emissions (NOx, SO2, and particulate) and other boiler issues (slagging, clinkering and corrosion of boiler heat- ing surfaces). Ultimate analysis and ash analysis on a per oxide basis were carried out on the four unmodified feedstock used for the experiment, the results of which are reported in Tables 1 and 2. These results provide a benchmark from which to determine the relative changes due to the leaching experiment. The results reported in Tables 1 and 2 show that the overall ash content was lower in switchgrass than the other three feedstock and the potassium (K) and chlorine (Cl) were significantly higher in wheat, barley and reed canary grass than found in switch grass. 3.1. Energy Crop Switch grass and reed canary grass are purpose-grown Table 1. Ultimate analysis for the samples used, expressed as percentage of initial dry mass and chlorine expressed in parts per million (ppm). C % H % O % S % N % Cl, ppm Barley 46.50 6.15 45.79 0.24 1.32 2446.2 Switch Grass 46.00 6.1 46.41 0.28 1.21 888.1 Wheat 45.53 6.07 47.38 0.3 0.72 5528.5 Reed Canary 45.00 5.9 47.15 0.31 1.64 2295.5 Table 2. Ash analysis and alkali metal composition for the samples, expressed in milligram per gr am of dry sample. Ash Mg Ca K Na mg/g mg/g mg/g mg/g mg/g Barley 56.63 0.93 3.38 12.14 0.595 Switch Grass 30.5 1.22 2.6 2.03 0.248 Wheat 68.73 0.98 2.47 9.76 0.994 Reed Canary 73.17 1.07 2.47 8.5 0.081 crops used for the production of bio renewable energy. Improving the quality of biomass produced by these en- ergy crops is a key for these to be predominantly used in the energy sector. Leached switch grass and reed canary grass were tested for ash, nitrogen, sulphur and other alkali metals and the data is presented in Table 3. 3.1.1. Switch Grass Potassium, chlorine, sodium and sulfur had a reduction of 90%, 93%, 75% and 27% respectively, when sub- jected to a water temperature of 80˚C for 24 hours. Whereas, in the case of magnesium and calcium the av- erage reduction of 57% occured at each of the following three conditions of 80˚C for 6hours, 50˚C for 24hours and 80˚C for 24hours residence time. Nitrogen content in switch grass was reduced by an average 30% with no significant difference between 50˚C and 80˚C at both 6 and 24 hours resident time. Whereas, the overall ash content reduced by an average 49% at 80˚C at both 6hours and 24 hours residence time. 3.1.2. Reed Canary Grass Reed canary grass had a maximum chlorine reduction of 97% and there was no significant difference between the time and temperature combination. Similarly, the interac- tion between the two factors was not significantly dif- ferent for sodium and potassium, which indicates that there was a consistent decrease to a maximum of 92% and 48% respectively in potassium and sodium with in- crease in temperature and time. When magnesium, cal- cium, nitrogen and overall ash are considered, reduction was inconsistent. For example, nitrogen decreases with an increase in temperature at 6 hours, whereas nitrogen increased with increase in temperature at 24 hours resi- dence time. However, in the case of sulfur there was a consistent percentage reduction up to a maximum of 28% with time and temperature. 3.2. Agricultural Residue Abundantly available agricultural residue such as wheat and barley straw could substantially servebioenergy market demands. Unlike energy crops, wheat and barley are primarily grown for their grain yield. This demands the use of fertilizers, which could potentially increase the inorganic element accumulation in these agricultural residues. The fuel properties of leached wheat and barley straw are reported in Table 4. 3.2.1. Barley Barley had a maximum ash reduction of 75% at 80˚C for 24 hour residence time. A consistent reduction of 93% and 92% was observed for potassium and chlorine at 80˚C and 24 hours residence time. Whereas, magnesium and calcium had a maximum reduction of 65% and 57% Copyright © 2013 SciRes. JSBS  P. RAVICHANDRAN ET AL. Copyright © 2013 SciRes. JSBS 190 Table 3. Energy crops (switch grass and reed canary grass)—mean and standard deviation for Ash, K, Na, Mg, Ca, S and N presented for different temperature and resident time combinations. Ash, mg/g K, mg/g Na, mg/g Mg, mg/gCa, mg/g Cl, ppm S, % N, % Time h Temp ˚C μ σ μ σ μ σ μ σ μ σ μ σ μ σ μ σ SG 6 20 23.9 0.82 0.32 0.01 0.08 0.002 0.83 0.032.12 0.0681.11.510.26 0.003 0.990.06 SG 6 50 23.9 1.44 0.25 0.01 0.08 0.001 0.77 0.052.21 0.1175.20.90.24 0.001 0.90.02 SG 6 80 19.4 0.61 0.21 0.02 0.07 0.001 0.53 0.051.74 0.07 73.83 0.590.22 0.003 0.90.07 SG 24 20 24.2 0.82 0.26 0.03 0.07 0.001 0.63 0.021.96 0.0169.20.620.25 0.004 0.920.03 SG 24 50 20.8 0.81 0.25 0.04 0.07 0.001 0.49 0.011.81 0.0668.10.20.22 0.009 0.860.02 SG 24 80 17.6 0.12 0.21 0.01 0.06 0.001 0.52 0.011.78 0.0263 0.530.2 0.004 0.790.01 RC 6 20 54.6 2.08 1.07 0.07 0.06 0 0.68 0.011.89 0.25 56.33 0.670.29 0.005 1.470.06 RC 6 50 52.1 1.92 0.84 0.04 0.05 0 0.60.02 1.630.09 48.430.780.26 0.004 1.450.06 RC 6 80 42.4 2.38 0.72 0.05 0.04 0 0.56 0.031.41 0.05 42.03 1.690.25 0.003 1.290.04 RC 24 20 53.8 0.35 0.96 0.08 0.06 0.001 0.47 0.011.52 0.0656.31.050.24 0.004 1.360.08 RC 24 50 46.6 1.69 0.8 0.04 0.05 0.0010.36 0.031.20.0647.50.70.23 0.001 1.410.03 RC 24 80 46.8 5.32 0.71 0.07 0.04 0.0010.50.01 1.590.0442.61.080.23 0.002 1.440.04 Table 4. Agricultural residue (barley and wheat)—Mean and standard deviation for Ash, K, Na, Mg, Ca, S and N presented for different temperature and resident time combinations. Ash, mg/gK, mg/g Na, mg/g Mg, mg/gCa, mg/g Cl, ppm S, % N, % Time h Temp ˚C μ σ μ σ μ σ μ σ μ σ μ σ μ σ μ σ B 6 20 31.5 2.882.33 0.09 0.18 0.001 0.840.022.720.05 326.46.72 0.24 0.002 0.980.05 B 6 50 26.0 2.231.79 0.08 0.150 0.67 0.012.340.07 288.33.27 0.22 0.004 0.920.08 B 6 80 18.2 2.371.61 0.13 0.14 0.0010.60.022.25 0.05 268.50.7 0.21 0.008 0.890.08 B 24 20 28.1 2.591.59 0.14 0.17 0.004 0.630.032.36 0.13 229.6 3.41 0.23 0.006 1.010.04 B 24 50 15.1 2.111.17 0.1 0.140.0030.330.041.450.04221.7 0.8 0.21 0.001 0.790.05 B 24 80 14.3 2.110.8 0.04 0.130.001 0.440.021.73 0.06 200.4 0.89 0.19 0.005 0.830.05 W 6 20 38.8 1.851.39 0.07 0.29 0.003 0.820.031.79 0.07 569.0 1.46 0.27 0.005 0.530.04 W 6 50 35.0 0.671.21 0.14 0.27 0.001 0.650.011.67 0.02 495.7 3.68 0.24 0.002 0.490.05 W 6 80 26.3 1.4 1.12 0.16 0.210.0010.6 0.031.590.13389.2 5.4 0.22 0.002 0.570.04 W 24 20 39.2 1.760.91 0.08 0.24 0.002 0.550.031.52 0.07 485.2 5.16 0.25 0.002 0.590.06 W 24 50 25.0 3.940.88 0.03 0.22 0.002 0.380.031.13 0.07 484.9 5.79 0.22 0.002 0.530.02 W 24 80 24.0 1.7 0.67 0.09 0.190.0010.580.041.490.11440.42.55 0.2 0.003 0.530.02 at 50˚C with 24 hours residence time. Sodium and sulfur had a maximum reduction of 77% and 17% at 80˚C with both 6 hours and 24 hours residence time. Furthermore, nitrogen reduced by an average 35% at 50˚C and 80˚C with both 6 hours and 24 hours residence time. 3.2.2. Wheat Similar to barley, the overall ash content reduced to an average of 63% with no significant difference between 80˚C at 24 hours, 50˚C at 24 hours and 80˚C at 6 hours. There was an inconsistent reduction in nitrogen with in- crease in time and temperature. Whereas, with magne- sium and calcium a reduction of 40% was observed for a temperature of 50˚C and 24 hours residence time. Unlike other feedstocks, chlorine reduced by up to 93% at 80˚C with 6 hours residence time. A reduction of 35% was observed when wheat was subjected to 80˚C and 24 hours residence time. 3.3. Statistical Interpretation of the Results Analysis of Variance (ANOVA) was performed on each response (% reduction in Ash, K, Na, Ca, Mg, Cl, N and S) separately for each of the four feedstocks. If the re- sults were significant at 5% (P-value < 0.05), multiple means comparison was performed on the significant in- teraction else on the main factors. Multiple means com- parison is a technique widely used to determine the dif- ferences and similarities between the means. A range of means comparison are available, few methods that are predominantly used for are LSD, Tukey-Kramer, Dun- can, Scheffe’s method, etc. Tukey-Kramer method at 5% level of significance was used for analyzing the results. Letter groups (a, b, c, d and so on) at the top of each column in Figure 1 will be used to represent all possible imilarities and differences between means. Letter “a” s  P. RAVICHANDRAN ET AL. 191 Figure 1. % reduction in Ash and other inorganic elements with respect to resident time and temperature factor. Treatments ithin a feedstock with same letters are not significantly different. w Copyright © 2013 SciRes. JSBS  P. RAVICHANDRAN ET AL. 192 may represent a treatment combination or a group of ted in this paper has proven the velop a biomass fuel that, once processed and pelletized d and combusted in residential IA), “World Oil Markets, Official Energy Statistics US Government,” 2006. http://wemissions.pdf treatment combination with largest mean. Likewise, let- ter “b” may represent a treatment combination or a group of treatment combination with the second largest mean. The treatment combination with letter group “a” is dif- ferent for the combination that received a letter group “b”. However, if there is a group of treatment combinations that received the same letter, there is no significant dif- ference between those combinations. If the treatment combination can be further grouped, those means would be grouped with the letters “c”, “d” and so on. A treat- ment combination may sometime be represented by more that one letter (say “ab”). In such cases, “ab” treatment combination is not significantly different form the treat- ment combination or a group of treatment combination that received a letter group “a”or “b”. For example, Figure 1(a) presents a graph—% ash re- duction vs. feedstock—resident time with letters group- ing for each feedstock. Let us consider reed canary, which is represented as RC 6 for 6 hours and RC 24 for 24 hours with three columns indicating temperatures. The letters for each treatment combination is given at the top if each column. Treatment combination of 80˚C at 6 hours gets letter “a” indicating that it has the largest % reductions in ash. Further, 50˚C and 80˚C at 24 hours group receives a let- ter “ab”. Since, all of these treatment combinations has letter “a” there is no significant difference between them (all three treatments combinations reduces ash to the maximum). If the best treatment that offers maximum ash reduction for reed canary was to be chosen among these three treatment combinations mentioned above, other factors such as energy used to subject the feedstock to each treatment combination and the cost associated with it may be considered (i.e. treatment combination that reduces ash to a maximum with low energy use or cost). 4. Conclusions The research presen most efficient method for batch leaching of inorganic material, particularly K and Cl, in switchgrass and wheat straw to be at 50˚C for 24 hours. This temperature and time are the most effective, however more moderate conditions may be used depending on the ash content of the unleached material. Previous literature has identified the leaching potential for reduction of these properties, but has not yet determined the effective conditions for performing this leaching. Using the method established in this research, switchgrass and wheat straw can be prepared for com- bustion with the assurance that inorganic material content has been reduced sufficiently to safeguard against ash production, corrosion, slagging and harmful emissions in residential pellet stoves. The implications of this knowledge can be used to de- or briquetted, can be sol appliances. This will give farmers an opportunity to as- sess the value in their natural grasses by either autono- mous energy generation (oil and gas independence) or the commercial application of their natural resource. The simplicity of the leaching process lends itself to the pos- sibility of creating a natural grass biomass value chain, with farmers investing in the harvesting, leaching and pelletizing/briquetting of their materials. REFERENCES [1] Energy Information Administration (E ww.eia.doc.gov/oiaf/pdf/ [2] USDA, “Biomass and Feedstocks for a BioEnergy and Bioproducts Industry: The Technical Feasibility of a Bil- lion-Ton Annual Supply,” 2005. [3] IEA BioEnergy, “Global Wood Pellet Markets and Indus- try: Policy, Drivers, Market Status and Raw Material Po- tential,” 2007. [4] L. Nikolaisen, M. Junginger, S. C. Goh, J. Heinimo, D. Bradley and R. Hess, “Global Wood Pellet Industry Mar- ket and Trade Study,” 2011. [5] X. Li, E. Mupondwa, S. Panigrahi, L. Tabil, S. Sokhan- sanj and M. Stumborg, “A Review of Agricultural Crop Residue Supply in Canada for Cellulosic Ethanol Produc- tion,” Renewable & Sustainable Energy Reviews, Vol. 16, No. 5, 2012, pp. 2954-2965. doi:10.1016/j.rser.2012.02.013 [6] R. Samson, S. Mani, R. Boddey, S. Sokhansanj, D. Que- sada and S. Urquiaga, “The Potential of C4 Perennial Grasses for Developing a Glob Critical Review in Plant Sciences al BIOHEAT Industry,” , Vol. 24, No. 5-6, 2005, pp. 461-495. doi:10.1080/07352680500316508 [7] C. Schmidl, M. Luisser, E. Padouvas, L. Lasselsberger, M. Rzaca and C. Ramirez-Santa Cruz, “Particulate and Gase- ous Emissions from Manually and Automatically Fired Small Scale Combustion Systems,” Atmosphere Envi- ronment, Vol. 45, No. 39, 2011, pp. 7443-7454. doi:10.1016/j.atmosenv.2011.05.006 [8] J. H. Cherney, “Benefits of Grass Biomass,” Cornell Uni- versity Department of Crop and Soil Sciences, 2006. [9] C. L’Orange, J. Volckens and M. DeFoort, “Influence of Stove Type and Cooking Pot Temperature on Particulate Matter Emissions from Biomass Cook Stoves,” Energy for Sustainable Development, Vol. 16, No. 4, 2012, pp. 448-455. doi:10.1016/j.esd.2012.08.008 [10] J. H. Cherney, Combustion Technology Issues, 2002. [11] National Renewable Energy Laboratory (NREL), “Alkali Deposits Found in Biomass Boilers,” US Department of Energy, Washington DC, 1996. [12] R. Sampson, M. Drisdelle, L. Mulkins, C. Lapointe and P. Duxbury, “The Use of Switchgrass Biofuel Pellets as a Greenhouse Gas Offset Strategy,” 2000. Copyright © 2013 SciRes. JSBS  P. RAVICHANDRAN ET AL. 193 [13] R. Sampson, C. Ho Lem, S. Bailey-Stamler and J. Dooper. “Developing Energy Crops for Thermal Applications,” Resource Efficient Agricultural Production Canada, Ste- Anne-de-Bellevue. [14] S. Q. Turn, C. M. Kinoshita and D. M. Ishimura, “Re- moval of Inorganic Constituents of Biomass Feedstocks by Mechanical Dewatering and Leaching,” Biomass and Bioenergy, Vol. 12, No. 4, 1997, pp. 241-252. doi:10.1016/S0961-9534(97)00005-6 [15] S. Paulrud and C. Nilsson, “Briquetting and Combustion of Spring-Harvested Reed Canary-Grass: Effect of Fuel Composition,” Biomass and Bioenergy, Vol. 20, No. 1, 2000, pp. 25-35. doi:10.1016/S0961-9534(00)00061-1 [16] H. P. Michelsen, F. Frandsen, K. Dam-Johansen and O. H. Larsen, “Deposition and High Temperature Corrosion in a 10 MW Straw Fired Boiler,” Fuel Processing Technology, Vol. 54, No. 1-3, 1998, pp. 95-108. doi:10.1016/S0378-3820(97)00062-3 [17] B. M. Jenkins,R. R. Bakker and J. B. Wei, “On the Prop- erties of Washed Straw,” Biomass and Bioenergy, Vol. 10, No. 4, 1995, pp. 177-200. doi:10.1016/0961-9534(95)00058-5 [18] C. Gilbe, “Slagging Characteristics during Residential Combustion of Biomass Pellets,” Energy and Fuels, Vol. 22, No. 5, pp. 3536-3543. doi:10.1021/ef800087x [19] G. Hadders and R. Olsson, “Harvest of Grass for Com- bustion in Late Summer and in Spring,” Biomass and Bioenergy, Vol. 12, No. 3, 1997, pp. 171-175. doi:10.1016/S0961-9534(96)00047-5 [20] P. Teixeira, H. Lopes, I. Gulyurtlu, N. Lapa and P. Abelha, “Evaluation of Slagging and Fouling Tendency during Biomass Co-Firing with Coal in a Fluidized Bed,” Bio- mass and Bioenergy, Vol. 39, 2012, pp. 192-203 doi:10.1016/j.biombioe.2012.01.010 . [21] E. Gustafsson, L. Lin and M. Strand, “Characterization of Particulate Matter in the Hot Product Gas from Atmos- pheric Fluidized Bed Biomass Gasifiers,” Biomass and Bioenergy Vol. 35, Suppl. 1, 2011, pp. 71-78. doi:10.1016/j.biombioe.2011.02.053 [22] C. A. Ogden, K. E. Ileleji, K. D. Johnson and Q. Wang, “In-Field Direct Combustion Fuel Property Changes of Switchgrass Harvested from Summer to Fall,” Fuel Proc- essing Technology, Vol. 91, No. 3, 2009, pp. 266-271. doi:10.1016/j.fuproc.2009.10.007 [23] A. Demirbas, “Demineralization of Agricultural Residu by Water Leaching,” Energy Sou es rces, Vol. 25, No. 7, 2003, p. 679. doi:10.1080/00908310390212390 [24] M. Olsson, “Wheat Straw and Peat for Fuel Pellets— Organic Compounds from Combustion,” Biomass and Bioenergy, Vol. 30, No. 6, 2006, pp. 555-564. doi:10.1016/j.biombioe.2006.01.005 [25] L. S. Johansson, C. Tullin, B. Leckner and “Particle Emissions from Biomass C P. Sjovall, ombustion in Small Combustors,” Biomass and Bioenergy, Vol. 25, No. 4, 2003, pp. 435-446. doi:10.1016/S0961-9534(03)00036-9 [26] C. Davidson, R. Phalen and P. Solomon, “Airborne Par- ticulate Matter and Human Health: A Review,” Aerosol Science and Technology, Vol. 39, No. 8, 2005, pp. 737- 749. doi:10.1080/02786820500191348 [27] A. Obernberger, F. Biedermann, W. Widmann and R. Riedl, “Concentrations of Inorganic Elements in Biomass Fuels and Recovery in Different Ash Fractions,” Biomass and Bioenergy, Vol. 12, No. 3, 1996, pp. 211-224. doi:10.1016/S0961-9534(96)00051-7 [28] J. Burvall, “Influence of Harvest Time and Soil T Fuel Quality in Reed Canary Grass,” ype of Biomass and Bio- energy, Vol. 12, No. 3, 1996, pp. 149-154. doi:10.1016/S0961-9534(96)00064-5 [29] B. Tonn, U. Thumm, I. Lewandowski and “Leaching of Biomass from Semi-Na W. Claupein, tural Grasslands— Effects on Chemical Composition and as High-Tem- perature Behavior,” Biomass and Bioenergy, Vol. 36, 2011, pp. 390-403. doi:10.1016/j.biombioe.2011.11.014 [30] V. Skoulou,E. Kantarelis, S. Arvelakis,W. Yang and A. Zabaniotou, “Effect of Biomass Leaching on H2 Produc- tion, Ash and Tar Behavior during High Temperature Steam Gasification (HTSG) Process,” International Jour- nal of Hydrogen Energy, Vol. 34, No. 14, 2009, pp. 5666- 5673. doi:10.1016/j.ijhydene.2009.05.117 [31] B. Tonn, V. Dengler, U. Thumm, H. Piepho and W. Clau- pein, “Influence of Leaching on the Chemical Composi- tion of Grassland Biomass for Combustion,” Grass and Forage Science, Vol. 66, No. 4, 2011, pp. 464-467. doi:10.1111/j.1365-2494.2011.00804.x [32] B. M. Jenkins, R. R. Bakker and J. B. Wei, “On the erties of Washed Straw,” Biomass and B Prop- ioenergy, Vol. 10, No. 4, 1996, pp. 177-200. doi:10.1016/0961-9534(95)00058-5 Copyright © 2013 SciRes. JSBS
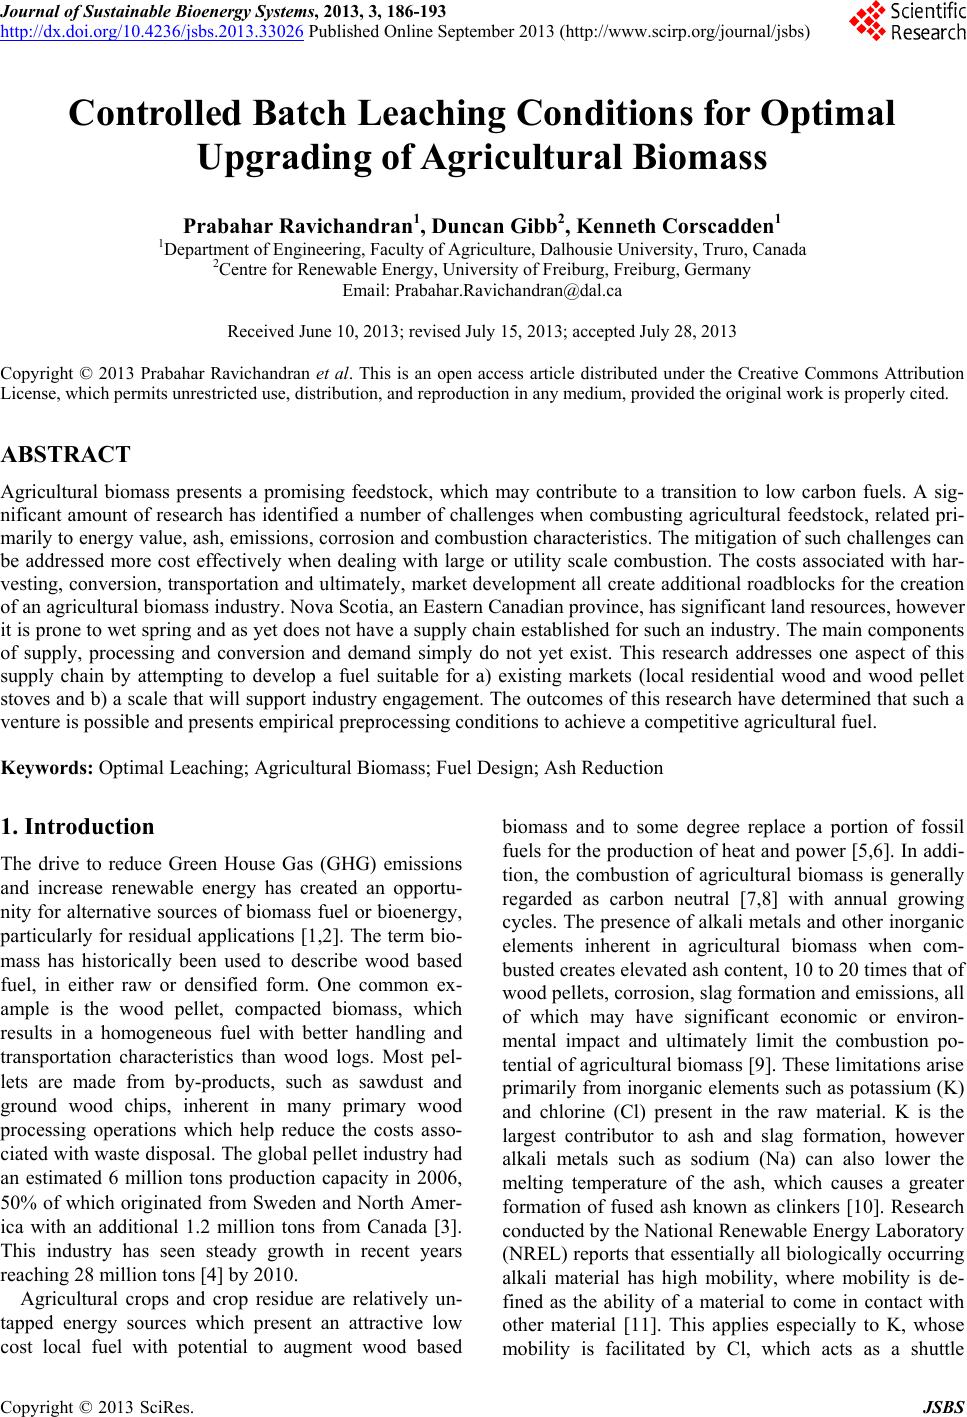
|