 American Journal of Plant Sciences, 2013, 4, 1750-1757 http://dx.doi.org/10.4236/ajps.2013.49215 Published Online September 2013 (http://www.scirp.org/journal/ajps) Optimum Dark Adaptation Period for Evaluating the Maximum Quantum Efficiency of Photosystem II in Ozone-Exposed Rice Leaves Hiroki Kobayakawa, Katsu Imai* School of Agriculture, Meiji University, Kawasaki, Japan. Email: *imai@isc.meiji.ac.jp Received June 9th, 2013; revised July 9th, 2013; accepted August 10th, 2013 Copyright © 2013 Hiroki Kobayakawa, Katsu Imai. This is an open access article distributed under the Creative Commons Attribu- tion License, which permits unrestricted use, distribution, and reproduction in any medium, provided the original work is properly cited. ABSTRACT Because the transient O3 injury of leaves is lost with time, the evaluation of O3 effect on the maximum quantum effi- ciency of PSII (Fv/Fm) is difficult. Thus, the authors examined Fv/Fm in rice leaves exposed to different O3 concentra- tions (0, 0.1, and 0.3 cm3·m−3, expressed as O0, O0.1, and O0.3) under different dark adaptation periods (0, 1, 5, 10, 20, and 30 min, expressed as D0, D1, D5, D10, D20, and D30) to ascertain its optimum time span. Fv/Fm was inhibited by O3; however in the O0 and O0.1 plants, it recovered during dark adaptation. In the O0.3 plants, Fv/Fm decreased gradually with time. F0 was found to be increased by O3, and it increased further in the O0.3 plants during dark adaptation. Under a high light intensity, Fm was decreased by O3, and the O3-induced damage to Fv/Fm was therefore more pronounced. However, the sensitivity of Fm was lower than that of F0. Consequently, the damage to PSII was mainly attributed to the inhibition of electron transport from QA to QB. The Fv/Fm ratio in the O0 plants was fully recovered at D10, and in the O0.1 plants, Fv/Fm increased from D10 to D20. The effects of O3 on the xanthophyll cycle-dependent quenching (fast re- laxation phase) of qI disappeared when the dark adaptation period was greater than 20 min. However, it was difficult to distinguish the effects of O3 and other factors (e.g., light) before D5. The current results demonstrate that the optimum dark adaptation period in rice leaves is 10 min because the effect of O3 remains maximal, while the effects of other fac- tors on Fv/Fm disappear during this period. By accurate measurement of Fv/Fm, the physiology of O3 effect on PSII in rice leaves is precisely evaluated. Keywords: Dark-Adapted State; Oryza sativa; Ozone Stress; Photosystem II; Quantum Efficiency 1. Introduction In the Kanto region of Japan, where rice is cultivated as a staple summer crop, 10 - 20 warnings regarding high photochemical oxidants (≧0.12 cm3·m−3) are received every growing season, and the hourly peak values of these substances are sometimes close to 0.2 cm3·m−3 [1]. Overall, ozone (O3) accounts for 90% or more of the total photochemical oxidants [2,3]. When exposed to O3, rice plants suffer damage caused by the inhibition of net pho- tosynthetic rate (PN) and photosystem II (PSII) [4,5] as well as decreases in the contents of ribulose 1,5-bisphos- phate carboxylase/oxygenase [6], the contents of chloro- phyll and carotenoids [7], and nitrite reductase activity [8], in addition to visible leaf-related symptoms [4] and breakdown of the cellular ultrastructure [9]. Moreover, O3 suppresses growth [10], alters photoassimilate parti- tioning [11], and decreases grain yield [10,12,13]. Detri- mental effects of O3 have also been reported in many other crops and trees [14,15]. Because PSII of plants is deteriorated immediately af- ter O3 exposure [5], the monitoring of PSII is useful as a tool to evaluate O3 damage and recovery from it. Re- cently, the examination of chlorophyll fluorescence meas- urements has become established practice for the diagno- sis of changes in PSII caused by environmental stresses such as excessive light and water stress. Many studies as- sessing the effects of environmental stress on PSII have been conducted [16,17]. By analyzing chlorophyll fluore- scence measurements, Kobayakawa and Imai [5] showed that the maximum (Fv/Fm) and operating (Fq’/Fm’) quan- *Corresponding author. Copyright © 2013 SciRes. AJPS 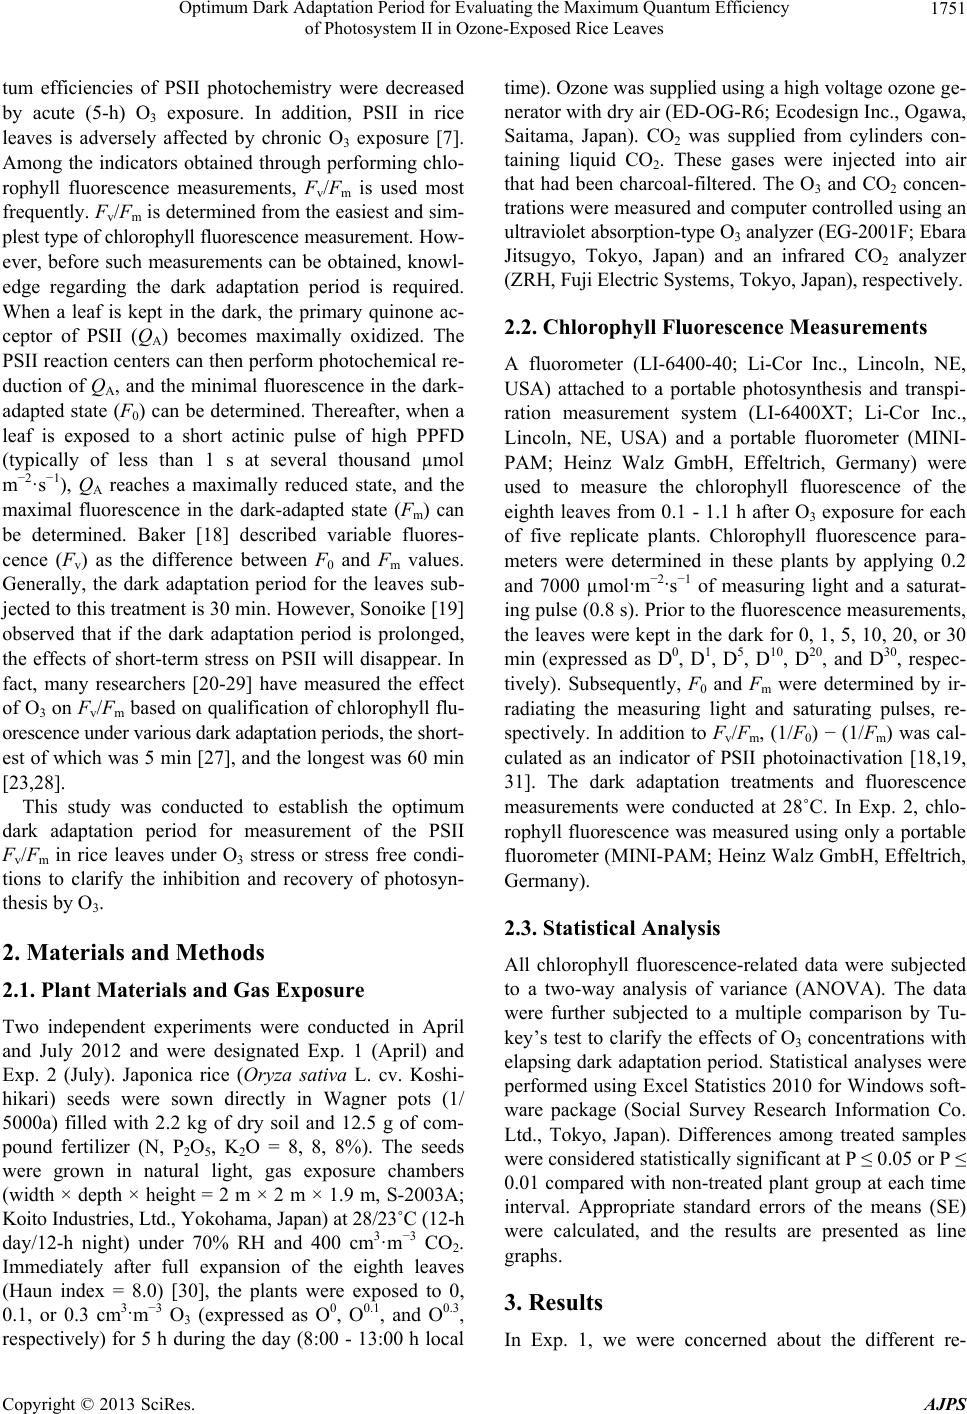 Optimum Dark Adaptation Period for Evaluating the Maximum Quantum Efficiency of Photosystem II in Ozone-Exposed Rice Leaves 1751 tum efficiencies of PSII photochemistry were decreased by acute (5-h) O3 exposure. In addition, PSII in rice leaves is adversely affected by chronic O3 exposure [7]. Among the indicators obtained through performing chlo- rophyll fluorescence measurements, Fv/Fm is used most frequently. Fv/Fm is determined from the easiest and sim- plest type of chlorophyll fluorescence measurement. How- ever, before such measurements can be obtained, knowl- edge regarding the dark adaptation period is required. When a leaf is kept in the dark, the primary quinone ac- ceptor of PSII (QA) becomes maximally oxidized. The PSII reaction centers can then perform photochemical re- duction of QA, and the minimal fluorescence in the dark- adapted state (F0) can be determined. Thereafter, when a leaf is exposed to a short actinic pulse of high PPFD (typically of less than 1 s at several thousand µmol m−2·s−1), QA reaches a maximally reduced state, and the maximal fluorescence in the dark-adapted state (Fm) can be determined. Baker [18] described variable fluores- cence (Fv) as the difference between F0 and Fm values. Generally, the dark adaptation period for the leaves sub- jected to this treatment is 30 min. However, Sonoike [19] observed that if the dark adaptation period is prolonged, the effects of short-term stress on PSII will disappear. In fact, many researchers [20-29] have measured the effect of O3 on Fv/Fm based on qualification of chlorophyll flu- orescence under various dark adaptation periods, the short- est of which was 5 min [27], and the longest was 60 min [23,28]. This study was conducted to establish the optimum dark adaptation period for measurement of the PSII Fv/Fm in rice leaves under O3 stress or stress free condi- tions to clarify the inhibition and recovery of photosyn- thesis by O3. 2. Materials and Methods 2.1. Plant Materials and Gas Exposure Two independent experiments were conducted in April and July 2012 and were designated Exp. 1 (April) and Exp. 2 (July). Japonica rice (Oryza sativa L. cv. Koshi- hikari) seeds were sown directly in Wagner pots (1/ 5000a) filled with 2.2 kg of dry soil and 12.5 g of com- pound fertilizer (N, P2O5, K2O = 8, 8, 8%). The seeds were grown in natural light, gas exposure chambers (width × depth × height = 2 m × 2 m × 1.9 m, S-2003A; Koito Industries, Ltd., Yokohama, Japan) at 28/23˚C (12-h day/12-h night) under 70% RH and 400 cm3·m−3 CO2. Immediately after full expansion of the eighth leaves (Haun index = 8.0) [30], the plants were exposed to 0, 0.1, or 0.3 cm3·m−3 O 3 (expressed as O0, O0.1, and O0.3, respectively) for 5 h during the day (8:00 - 13:00 h local time). Ozone was supplied using a high voltage ozone ge- nerator with dry air (ED-OG-R6; Ecodesign Inc., Ogawa, Saitama, Japan). CO2 was supplied from cylinders con- taining liquid CO2. These gases were injected into air that had been charcoal-filtered. The O3 and CO2 concen- trations were measured and computer controlled using an ultraviolet absorption-type O3 analyzer (EG-2001F; Ebara Jitsugyo, Tokyo, Japan) and an infrared CO2 analyzer (ZRH, Fuji Electric Systems, Tokyo, Japan), respectively. 2.2. Chlorophyll Fluorescence Measurements A fluorometer (LI-6400-40; Li-Cor Inc., Lincoln, NE, USA) attached to a portable photosynthesis and transpi- ration measurement system (LI-6400XT; Li-Cor Inc., Lincoln, NE, USA) and a portable fluorometer (MINI- PAM; Heinz Walz GmbH, Effeltrich, Germany) were used to measure the chlorophyll fluorescence of the eighth leaves from 0.1 - 1.1 h after O3 exposure for each of five replicate plants. Chlorophyll fluorescence para- meters were determined in these plants by applying 0.2 and 7000 µmol·m−2·s−1 of measuring light and a saturat- ing pulse (0.8 s). Prior to the fluorescence measurements, the leaves were kept in the dark for 0, 1, 5, 10, 20, or 30 min (expressed as D0, D1, D5, D10, D20, and D30, respec- tively). Subsequently, F0 and Fm were determined by ir- radiating the measuring light and saturating pulses, re- spectively. In addition to Fv/Fm, (1/F0) − (1/Fm) was cal- culated as an indicator of PSII photoinactivation [18,19, 31]. The dark adaptation treatments and fluorescence measurements were conducted at 28˚C. In Exp. 2, chlo- rophyll fluorescence was measured using only a portable fluorometer (MINI-PAM; Heinz Walz GmbH, Effeltrich, Germany). 2.3. Statistical Analysis All chlorophyll fluorescence-related data were subjected to a two-way analysis of variance (ANOVA). The data were further subjected to a multiple comparison by Tu- key’s test to clarify the effects of O3 concentrations with elapsing dark adaptation period. Statistical analyses were performed using Excel Statistics 2010 for Windows soft- ware package (Social Survey Research Information Co. Ltd., Tokyo, Japan). Differences among treated samples were considered statistically significant at P ≤ 0.05 or P ≤ 0.01 compared with non-treated plant group at each time interval. Appropriate standard errors of the means (SE) were calculated, and the results are presented as line graphs. 3. Results In Exp. 1, we were concerned about the different re- Copyright © 2013 SciRes. AJPS 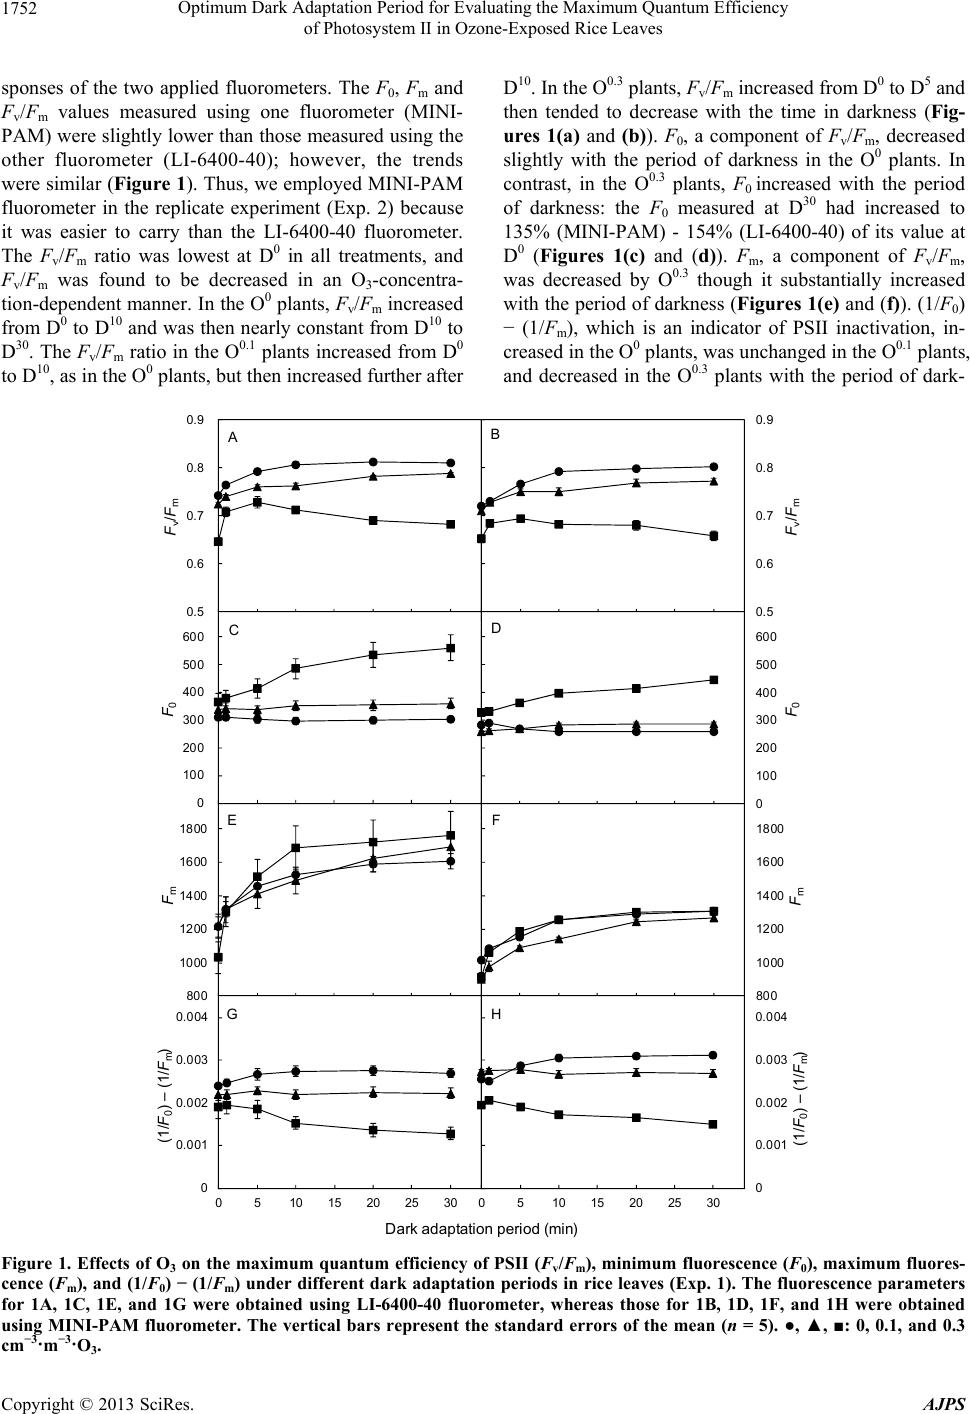 Optimum Dark Adaptation Period for Evaluating the Maximum Quantum Efficiency of Photosystem II in Ozone-Exposed Rice Leaves Copyright © 2013 SciRes. AJPS 1752 sponses of the two applied fluorometers. The F0, Fm and Fv/Fm values measured using one fluorometer (MINI- PAM) were slightly lower than those measured using the other fluorometer (LI-6400-40); however, the trends were similar (Figure 1). Thus, we employed MINI-PAM fluorometer in the replicate experiment (Exp. 2) because it was easier to carry than the LI-6400-40 fluorometer. The Fv/Fm ratio was lowest at D0 in all treatments, and Fv/Fm was found to be decreased in an O3-concentra- tion-dependent manner. In the O0 plants, Fv/Fm increased from D0 to D10 and was then nearly constant from D10 to D30. The Fv/Fm ratio in the O0.1 plants increased from D0 to D10, as in the O0 plants, but then increased further after D10. In the O0.3 plants, Fv/Fm increased from D0 to D5 and then tended to decrease with the time in darkness (Fig- ures 1(a) and (b)). F0, a component of Fv/Fm, decreased slightly with the period of darkness in the O0 plants. In contrast, in the O0.3 plants, F0 increased with the period of darkness: the F0 measured at D30 had increased to 135% (MINI-PAM) - 154% (LI-6400-40) of its value at D0 (Figures 1(c) and (d)). Fm, a component of Fv/Fm, was decreased by O0.3 though it substantially increased with the period of darkness (Figures 1(e) and (f)). (1/F0) − (1/Fm), which is an indicator of PSII inactivation, in- creased in the O0 plants, was unchanged in the O0.1 plants, and decreased in the O0.3 plants with the period of dark- 0.5 0.6 0.7 0.8 0.9 0510 15 20 25 30 F v /F m A 0 100 200 300 400 500 600 0510 15 20 25 30 F 0 C 800 1000 1200 1400 1600 1800 0510 15 20 25 30 F m E 0.5 0.6 0.7 0.8 0.9 0510 15 20 25 30 F v /F m B 0 100 200 300 400 500 600 0510 15 2025 30 F 0 D 800 1000 1200 1400 1600 1800 0510 15 20 2530 F m F 0 0.001 0.002 0.003 0.004 0510 15 20 25 30 (1/F 0 ) –(1 /F m ) G 0 0.001 0.002 0.003 0.004 0510 15 20 25 30 (1/F 0 ) –(1 /F m ) H Darkada tation eriod min Figure 1. Effects of O3 on the maximum quantum efficiency of PSII (Fv/Fm), minimum fluorescence (F0), maximum fluores- cence (Fm), and (1/F0) − (1/Fm) under different dark adaptation periods in rice leaves (Exp. 1). The fluorescence parameters for 1A, 1C, 1E, and 1G were obtained using LI-6400-40 fluorometer, whereas those for 1B, 1D, 1F, and 1H were obtained using MINI-PAM fluorometer. The vertical bars represent the standard errors of the mean (n = 5). ●, ▲, ■: 0, 0.1, and 0.3 cm−3·m−3·O3.  Optimum Dark Adaptation Period for Evaluating the Maximum Quantum Efficiency of Photosystem II in Ozone-Exposed Rice Leaves 1753 Table 1. Statistical analyses of the effects of O3 and dark adaptation period on chlorophyll fluoresence parameters in rice leaves. *p < 0.05, **p < 0.01, ***p < 0.001. n.s., not significant by two-way ANOVA. F0, minimal fluorescence in the dark-adapted state; Fm, maximal fluorescence in the dark adapted state; Fv/Fm, maximal quantum efficiency of PSII. Experiment Factor Fv/Fm F0 Fm (1/F0) – (1/Fm) Exp. 1 (LI-6400XT) O3 *** *** n.s. *** dark adaptation period *** * *** n.s. O3 × dark adaptation period *** ** n.s. n.s. Exp. 1 (MINI-PAM) O3 *** *** *** *** dark adaptation period *** *** *** n.s. O3 × dark adaptation period *** *** n.s. *** Exp. 2 (MINI-PAM) O3 *** *** *** *** dark adaptation period *** ** *** *** O3 × dark adaptation period * *** n.s. *** Table 2. Statistical analyses of the chlorophyll fluoresence parameters in rice leaves between control plants (O0) and O3-treated plants (O0.1 or O0.3) under different dark adaptation periods. *p < 0.05, **p < 0.01, ***p < 0.001. n.s., not signifi- cant by Turkey’s test. F0, minimal fluorescence in the dark-adapted state; Fm, maximal fluorescence in the dark adapted state; Fv/Fm, maximal quantum efficiency of PSII. Experiment Parameter O3 (cm3·m–3) Dark adaptation period (min) 0 1 5 10 20 30 Exp. 1 (LI-6400XT) Fv/Fm O0.1 n.s. n.s. n.s. *** ** * O0.3 *** ** *** *** *** *** F0 O0.1 n.s. n.s. n.s. n.s. n.s. n.s. O0.3 n.s. n.s. * ** *** *** Fm O0.1 n.s. n.s. n.s. n.s. n.s. n.s. O0.3 n.s. n.s. n.s. n.s. n.s. n.s. (1/F0) − (1/Fm) O0.1 n.s. n.s. n.s. * n.s. n.s. O0.3 n.s. n.s. * *** *** *** Exp. 1 (MINI-PAM) Fv/Fm O0.1 n.s. n.s. n.s. ** * * O0.3 *** *** *** *** *** *** F0 O0.1 ** ** n.s. n.s. n.s. n.s. O0.3 *** *** *** *** *** *** Fm O0.1 * * * ** n.s. n.s. O0.3 * n.s. n.s. n.s. n.s. n.s. (1/F0) − (1/Fm) O0.1 ** ** n.s. ** * ** O0.3 *** *** *** *** *** *** Exp. 2 (MINI-PAM) Fv/Fm O0.1 n.s. n.s. * *** ** ** O0.3 *** ** *** *** *** *** F0 O0.1 n.s. n.s. ** ** ** * O0.3 ** * * *** *** *** Fm O0.1 n.s. n.s. * *** ** ** O0.3 *** *** *** *** *** *** (1/F0) − (1/Fm) O0.1 n.s. n.s. ** *** *** *** O0.3 n.s. n.s. *** *** *** *** Copyright © 2013 SciRes. AJPS 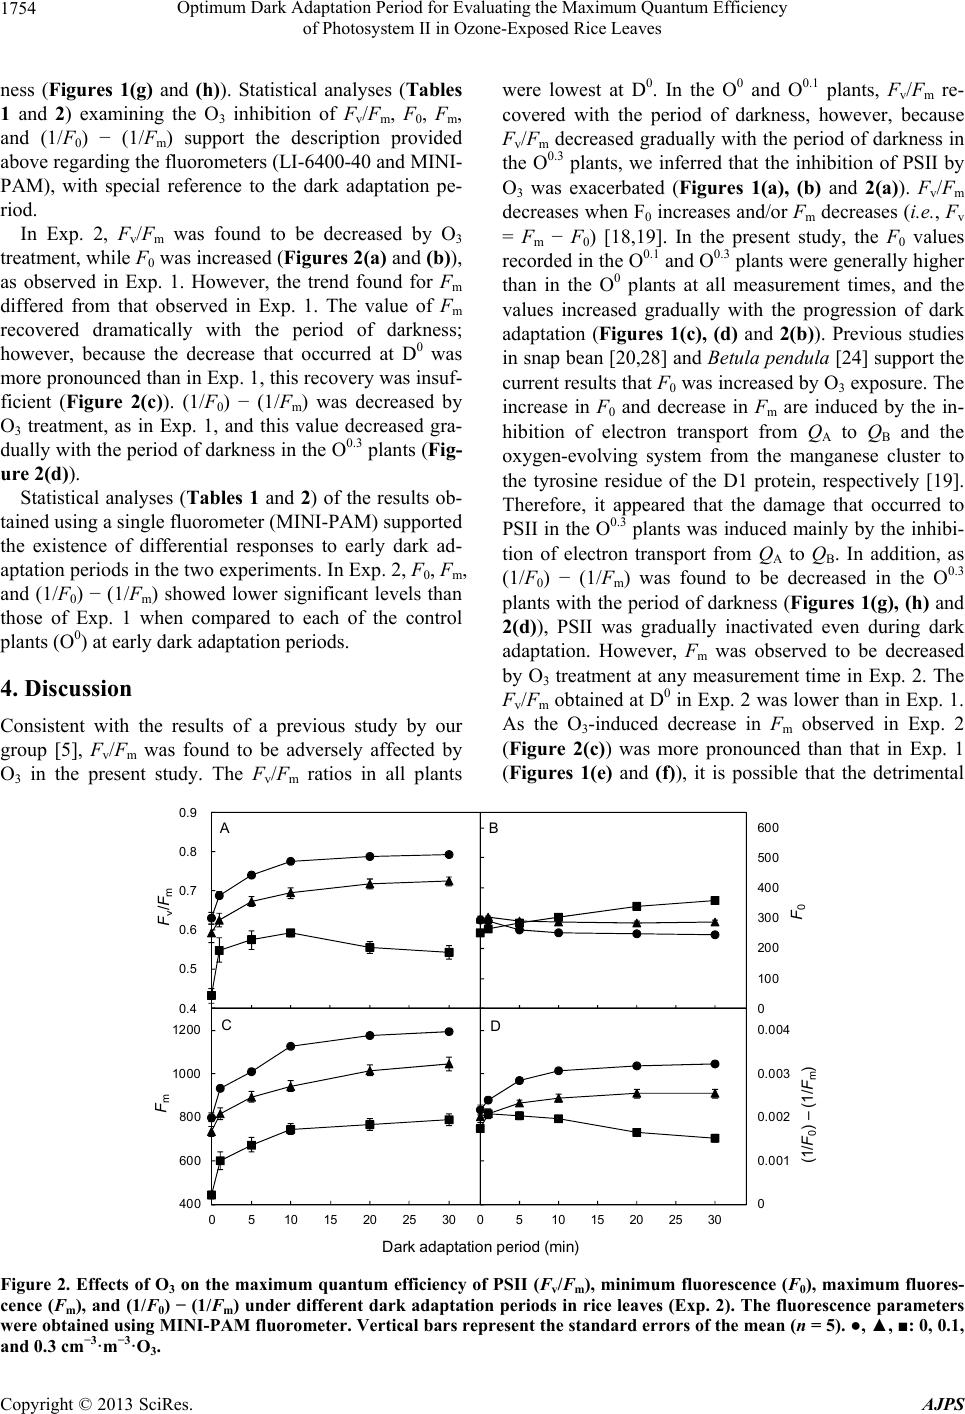 Optimum Dark Adaptation Period for Evaluating the Maximum Quantum Efficiency of Photosystem II in Ozone-Exposed Rice Leaves Copyright © 2013 SciRes. AJPS 1754 were lowest at D0. In the O0 and O0.1 plants, Fv/Fm re- covered with the period of darkness, however, because Fv/Fm decreased gradually with the period of darkness in the O0.3 plants, we inferred that the inhibition of PSII by O3 was exacerbated (Figures 1(a), (b) and 2(a)). Fv/Fm decreases when F0 increases and/or Fm decreases (i.e., Fv = Fm − F0) [18,19]. In the present study, the F0 values recorded in the O0.1 and O0.3 plants were generally higher than in the O0 plants at all measurement times, and the values increased gradually with the progression of dark adaptation (Figures 1(c), (d) and 2(b)). Previous studies in snap bean [20,28] and Betula pendula [24] support the current results that F0 was increased by O3 exposure. The increase in F0 and decrease in Fm are induced by the in- hibition of electron transport from QA to QB and the oxygen-evolving system from the manganese cluster to the tyrosine residue of the D1 protein, respectively [19]. Therefore, it appeared that the damage that occurred to PSII in the O0.3 plants was induced mainly by the inhibi- tion of electron transport from QA to QB. In addition, as (1/F0) − (1/Fm) was found to be decreased in the O0.3 plants with the period of darkness (Figures 1(g), (h) and 2(d)), PSII was gradually inactivated even during dark adaptation. However, Fm was observed to be decreased by O3 treatment at any measurement time in Exp. 2. The Fv/Fm obtained at D0 in Exp. 2 was lower than in Exp. 1. As the O3-induced decrease in Fm observed in Exp. 2 (Figure 2(c)) was more pronounced than that in Exp. 1 (Figures 1(e) and (f)), it is possible that the detrimental ness (Figures 1(g) and (h)). Statistical analyses (Tables 1 and 2) examining the O3 inhibition of Fv/Fm, F0, Fm, and (1/F0) − (1/Fm) support the description provided above regarding the fluorometers (LI-6400-40 and MINI- PAM), with special reference to the dark adaptation pe- riod. In Exp. 2, Fv/Fm was found to be decreased by O3 treatment, while F0 was increased (Figures 2(a) and (b)), as observed in Exp. 1. However, the trend found for Fm differed from that observed in Exp. 1. The value of Fm recovered dramatically with the period of darkness; however, because the decrease that occurred at D0 was more pronounced than in Exp. 1, this recovery was insuf- ficient (Figure 2(c)). (1/F0) − (1/Fm) was decreased by O3 treatment, as in Exp. 1, and this value decreased gra- dually with the period of darkness in the O0.3 plants (Fig- ure 2(d)). Statistical analyses (Tables 1 and 2) of the results ob- tained using a single fluorometer (MINI-PAM) supported the existence of differential responses to early dark ad- aptation periods in the two experiments. In Exp. 2, F0, Fm, and (1/F0) − (1/Fm) showed lower significant levels than those of Exp. 1 when compared to each of the control plants (O0) at early dark adaptation periods. 4. Discussion Consistent with the results of a previous study by our group [5], Fv/Fm was found to be adversely affected by O3 in the present study. The Fv/Fm ratios in all plants 0.4 0.5 0.6 0.7 0.8 0.9 0510 15 20 25 30 F v /F m A 0 100 200 300 400 500 600 0510 15 20 25 30 F 0 B 400 600 800 1000 1200 0510 15 20 25 30 F m C 0 0. 001 0. 002 0. 003 0. 004 0510 1520 25 30 (1/F 0 ) –(1 /F m ) D Darkadaptation period mi n Figure 2. Effects of O3 on the maximum quantum efficiency of PSII (Fv/Fm), minimum fluorescence (F0), maximum fluores- cence (Fm), and (1/F0) − (1/Fm) under different dark adaptation periods in rice leaves (Exp. 2). The fluorescence parameters were obtained using MINI-PAM fluorometer. Vertical bars represent the standard errors of the mean (n = 5). ●, ▲, ■: 0, 0.1, nd 0.3 cm−3·m−3·O3. a  Optimum Dark Adaptation Period for Evaluating the Maximum Quantum Efficiency of Photosystem II in Ozone-Exposed Rice Leaves 1755 effect of O3 was more pronounced in Exp. 2 due to the higher light intensities involved. In fact, the PPFD values recorded at 12:00 h in the natural light growth chamber were approximately 900 and 1100 µmol·m−2·s−1 in Exp. 1 and Exp. 2, respectively. Guidi et al. [23] also observed that the inhibition of PN and PSII activity by O3 was greater under high light intensities (30 - 1000 µmol·m−2· s−1 PPFD). Similarly, Kobayakawa and Imai [32] re- ported that the intercepted radiation is a major determin- ing factor in O3 inhibition. While the decrease in Fv/Fm was induced by an increase in F0 in the present study, in previous studies, a decrease in Fv/Fm was found to be induced by a decrease in Fm in O3-exposed lettuce [25] and tobacco [26]. Guidi et al. [22] measured the effect of O3 on chlorophyll fluorescence in 14 bean cultivars and reported that the cause of the inhibition of Fv/Fm (e.g., increased F0 and/or decreased Fm)depended on the cul- tivar. Interestingly, the Fv/Fm was found to be decreased by both an increase in F0 and a decrease in Fm in chroni- cally O3-exposed rice leaves [7]. Therefore, the cause of the decrease in Fv/Fm depends on the species, cultivar, and environmental conditions involved. Fv/Fm is determined without irradiating actinic light. Therefore, the obtained values can only be decreased by the non-photochemical quenching coefficient (qN). Three major components of qN have been identified in plant leaves in vivo: the energy (ΔpH)-dependent quenching coefficient (qE), photoinhibitory quenching coefficient (qI), and state-transition quenching coefficient (qT). The re- laxation kinetics of these components differ: the half time (t1/2) is 1 min for qE, 5 - 10 min for qT, and >30 min for qI [16,17]. Because qT is suppressed under strong light, it should not be regarded as a photoprotective me- chanism. In this study, the leaves of the plants were ex- posed to O3 during sunny daytime hours. Therefore, Fv/Fm was decreased mainly by qE and qI. qI includes the xan- thophyll cycle-dependent component and inactivation of the D1 protein component. The relaxation time of these two components differs: the t1/2 of the former is shorter than 30 min, whereas that of the latter is longer than 1 h [16,17]. In all plants, Fv/Fm recovered dramatically from D0 to D1 (Figures 1(a), (b) and 2(a)). This recovery was likely induced by the relaxation of qE. Consequently, in addition to the O0.1 and O0.3 plants, a decrease in Fv/Fm caused by qE also occurred in the O0 (control) plants. Furthermore, as the degree of recovery observed in the O0.3 plants from D0 to D1 was higher than in the O0 and O0.1 plants, qN was increased by a higher O3 concentra- tion (O0.3). Additionally, in the O0 plants, Fv/Fm did not change from D10 onward (Figures 1(a), (b) and 2(a)). Consequently, it appeared that qI disappeared in the O0 plants during a 10 min period of dark adaptation. Thus, because Fv/Fm decreased in the O0 plants prior to D5, it is difficult to distinguish the effects of O3 and other factors (e.g., light) prior to this time point. As Fv/Fm recovered in the O0.1 plants (increased) from D10 to D20, the xantho- phyll cycle-dependent quenching (fast relaxation phase) of qI would also have been increased during that time. Consequently, if the dark adaptation period is greater than 20 min, the effects of O3 on the fast relaxation phase of qI will disappear. However, when only the effects on D1 protein inactivation are to be evaluated, leaves must be maintained for more than 20 min in the dark. In the O0.3 plants, Fv/Fm decreased as the dark adaptation period progressed from D5. Therefore, if the dark adaptation period is too long, Fv/Fm might differ from the value ob- tained immediately after O3 exposure. The results of these experiments imply that the opti- mum dark adaptation period for evaluating Fv/Fm of PSII in O3-exposed rice leaves is 10 min because the effect of O3 is maximal at this time, and the effects of other fac- tors on Fv/Fm disappear. 5. Acknowledgements This work was supported by a grant for the Private Uni- versity Strategic Infrastructure Formation Support Pro- ject (No. S0901028) and a Grant-in-Aid for Challenging Exploratory Research (No. 23658019) from the MEXT, Japan. REFERENCES [1] Environ Improve Div, Tokyo Metropolitan Government Bureau Environ, “Review Report on the Photochemical Oxidant Measures,” Journal of Japan Society for Atmos- pheric Environment, Vol. 40, No. 6, 2005, pp. A65-A77. [2] H. Cabrera, S. V. Dawson and C. Stromberg, “A Califor- nia Air Standard to Protect Vegetation from Ozone,” En- vironmental Pollution, Vol. 53, No. 1-4, 1988, pp. 397- 408. doi:10.1016/0269-7491(88)90049-8 [3] I. Nouchi, “Plant Responses to Atmospheric Environ- mental Change,” Yokendo, Tokyo, 2001. [4] K. Imai and K. Kobori, “Effects of the Interaction be- tween Ozone and Carbon Dioxide on Gas Exchange, As- corbic Acid, and Visible Leaf Symptoms in Rice Leaves,” Photosynthetica, Vol. 46, No. 3, 2008, pp. 387-394. doi:10.1007/s11099-008-0070-4 [5] H. Kobayakawa and K. Imai, “Effects of the Interaction between Ozone and Carbon Dioxide on Gas Exchange, Photosystem II and Antioxidants in Rice Leaves,” Photo- synthetica, Vol. 49, No. 2, 2011, pp. 227-238. doi:10.1007/s11099-011-0024-0 [6] T. Ishioh and K. Imai, “Effects of Atmospheric Ozone and Carbon Dioxide Concentrations on Gas Exchanges, Contents of Rubisco and Chlorophyll in Leaves of Low- land Rice,” Proceeding of Kanto Branch, Crop Science Society of Japan, Vol. 20, 2005, pp. 54-55. Copyright © 2013 SciRes. AJPS  Optimum Dark Adaptation Period for Evaluating the Maximum Quantum Efficiency of Photosystem II in Ozone-Exposed Rice Leaves 1756 [7] R. Rai and M. Agrawal, “Evaluation of Physiological and Biochemical Responses of Two Rice (Oryza sativa L.) Cultivars to Ambient Air Pollution Using Open Top Chambers at a Rural Site in India,” Science of the Total Environment, Vol. 407, No. 1, 2008, pp. 679-691. doi:10.1016/j.scitotenv.2008.09.010 [8] H. Kobayakawa and K. Imai, “Effects of O3 and CO2 on Photosystem II, Nitrate Reductase and Nitrite Reductase in Paddy Rice Leaves,” Environment Control in Biology, Vol. 49, No. 2, 2011, pp. 91-98. doi:10.2525/ecb.49.91 [9] S. Toyama, M. Yoshida, T. Niki, T. Ohashi and I. Ko- yama, “Studies on Ultrastructure and Function of Photo- synthetic Apparatus in Rice Cells. IV. Effects of Low Dose and Intermittent Fumigation of Ozone on the Ultra- structure of Chloroplasts in Rice Leaf Cells,” Japanese Journal of Crop Science, Vol. 58, No. 4, 1989, pp. 664- 672. [10] K. Imai and T. Ookoshi, “Elevated CO2 Ameliorates O3- Inhibition of Growth and Yield in Paddy Rice,” Envi- ronment Control in Biology, Vol. 49, No. 2, 2011, pp. 75- 82. doi:10.2525/ecb.49.75 [11] I. Nouchi, O. Ito, Y. Harazono and H. Kouchi, “Accelera- tion of 13C-Labelled Photosynthate Partitioning from Leaves to Panicles in Rice Plants Exposed to Chronic Ozone at the Reproductive Stage,” Environmental Pollu- tion, Vol. 88, No. 3, 1995, pp. 253-260. doi:10.1016/0269-7491(95)93437-5 [12] C. D. Reid and E. L. Fiscus, “Ozone and Density Affect the Response of Biomass and Seed Yield to Elevated CO2 in Rice,” Global Change Biology, Vol. 14, No. 1, 2008, pp. 60-76. doi:10.1111/j.1365-2486.2007.01472.x [13] J. Pang, K. Kobayashi and J. Zhu, “Yield and Photosyn- thetic Characteristics of Flag Leaves in Chinise Rice (Oryza sativa L.) Varieties Subjected to Free-Air Release of Ozone,” Agriculture Ecosystems and Environment, Vol. 132, No. 3-4, 2009, pp. 203-211. doi:10.1016/j.agee.2009.03.012 [14] E. A. Ainsworth, G. R. Yendrek, S. Sitch, W. J. Collin and L. D. Emberson, “The Effects of Tropospheric Ozone on Net Primary Productivity and Implications for Climate Change,” Annual Review of Plant Biology, Vol. 63, 2012, pp. 637-661. doi:10.1146/annurev-arplant-042110-103829 [15] A. Bhatia, R. Tomer, V. Kumar, S. D. Singh and H. Pa- thak, “Impact of Tropospheric Ozone on Crop Growth and Productivity—A Review,” Journal of Scientific and Industrial Research, Vol. 71, No. 2, 2012, pp. 97-112. [16] W. W. Adams III and B. Demming-Adams, “Chlorophyll Fluorescence as a Tool to Monitor Plant Response to the Environment,” In: G. C. Papageorgiou and Govindjee, Eds., Chlorophyll a Fluorescence: A Signature of Photo- synthesis. Advances in Photosynthesis and Respiration, Springer, Dordrecht, 2004, pp. 583-604. [17] G. H. Krause and P. Jahns, “Non-Photochemical Energy Dissipation Determined by chlorophyll Fluorescence Quen- ching: Characterization and Function,” In: G. C. Papa- georgiou and Govindjee, Eds., Chlorophyll a Fluores- cence: A Signature of Photosynthesis. Advances in Pho- tosynthesis and Respiration, Springer, Dordrecht, 2004, pp. 463-495. [18] N. R. Baker, “Chlorophyll Fluorescence: A Probe of Pho- tosynthesis in Vivo,” Annual Review of Plant Biology, Vol. 59, 2008, pp. 89-113. doi:10.1146/annurev.arplant.59.032607.092759 [19] K. Sonoike, “Basics of the Measurements of Photosyn- thesis by Pulse Amplitude Modulation,” Low Tempera- ture Science, Vol. 67, 2009, pp. 507-524. [20] E. H. Lee, “Chlorophyll Fluorescence as an Indicator to Detect Differential Tolerance of Snapbean Cultivars in Response to O3 Stress,” Taiwania, Vol. 36, No. 3, 1991, pp. 220-234. [21] L. Guidi, C. Nali, S. Ciompi, G. Lorenzini and G. F. Sol- datini, “The Use of Chlorophyll Fluorescence and Leaf Gas Exchange as Methods for Studying the Different Re- sponses to Ozone of Two Bean Cultivars,” Journal of Experimental Botany, Vol. 48, No. 1, 1997, pp. 173-179. doi:10.1093/jxb/48.1.173 [22] L. Guidi, R. Di Cagno and G. F. Soldatini, “Screening of Bean Cultivars for Their Response to Ozone as Evaluated by Visible Symptoms and Leaf Chlorophyll Fluores- cence,” Environmental Pollution, Vol. 107, No. 3, 2000, pp. 349-355. doi:10.1016/S0269-7491(99)00170-0 [23] L. Guidi, M. Tonini and G. F. Soladatini, “Effects of High Light and Ozone Fumigation on Photosynthesis in Phaseolus vulgaris,” Plant Physiology and Biochemistry, Vol. 38, No. 9, 2000, pp. 717-725. doi:10.1016/S0981-9428(00)01172-4 [24] S. Shavnin, S. Maurer, R. Matyseek, W. Bilger and C. Scheidegger, “The Impact of Ozone Fumigation and Fer- tilization on Chlorophyll Fluorescence of Birch Leaves (Betula pendula),” Trees, Vol. 14, No. 1, 1999, pp. 10-16. doi:10.1007/s004680050002 [25] A. Calatayud, J. M. Ramirez, D. J. Iglesias and E. Bar- reno, “Effects of Ozone on Photosynthetic CO2 Exchange, Chlorophyll Fluorescence and Antioxidant Systems in Lettuce Leaves,” Physiologia Plantarum, Vol. 116, No. 3, 2002, pp. 308-316. doi:10.1034/j.1399-3054.2002.1160305.x [26] E. Degl’Innocenti, L. Guidi and G. F. Soldatini, “Charac- terisation of the Photosynthetic Response of Tobacco Leaves to Ozone: CO2 Assimilation and Chlorophyll Flu- orescence,” Journal of Plant Physiology, Vol. 159, No. 8, 2002, pp. 845-853. doi:10.1078/0176-1617-00519 [27] J. Skotnica, M. Gilber, I. Weingart and C. Wilhelm, “Ther- moluminescence as a Tool for Monitoring Ozone- Stressed Plants,” Environmental Pollution, Vol. 123, No. 1, 2003, pp. 15-20. doi:10.1016/S0269-7491(02)00365-2 [28] M. D. Flowers, E. L. Fiscus, K. O. Burkey, F. L. Booker and J.-B. Dubois, “Photosynthesis, Chlorophyll Fluores- cence, and Yield of Snap Bean (Phaseolus vulgaris L.) Genotypes Differing in Sensitivity to Ozone,” Environ- mental and Experimental Botany, Vol. 61, No. 2, 2007, 190-198. doi:10.1016/j.envexpbot.2007.05.009 [29] L. Wang, X. He and W. Chen, “Effects of Elevated Ozone on Photosynthetic CO2 Exchange and Chlorophyll a Fluo- Copyright © 2013 SciRes. AJPS  Optimum Dark Adaptation Period for Evaluating the Maximum Quantum Efficiency of Photosystem II in Ozone-Exposed Rice Leaves Copyright © 2013 SciRes. AJPS 1757 rescence in Leaves of Quercus mongolia Grown in Urban Area,” Bulletin of Environmental Contamination and Toxicology, Vol. 82, No. 4, 2009, pp. 478-481. doi:10.1007/s00128-008-9606-3 [30] J. R. Haun, “Visual Quantification of Wheat Develop- ment,” Agronomy Journal, Vol. 65, No. 1, 1973, pp. 116- 119. [31] M. Havaux, R. J. Strasser and H. Greppin, “A Theoretical and Experimental Analysis of qP and qN Coefficients of Chlorophyll Fluorescence Quenching and Their Relation to Photochemical and Nonphotochemical Events,” Pho- tosynthesis Research, Vol. 27, No. 1, 1991, pp. 41-55. doi:10.1007/BF00029975 [32] H. Kobayakwa and K, Imai, “Inclination Angle Affects Ozone Injury in the Flag Leaf of Rice,” Plant Production Science, Vol. 16, No. 1, 2013, pp. 24-30. doi:10.1626/pps.16.24
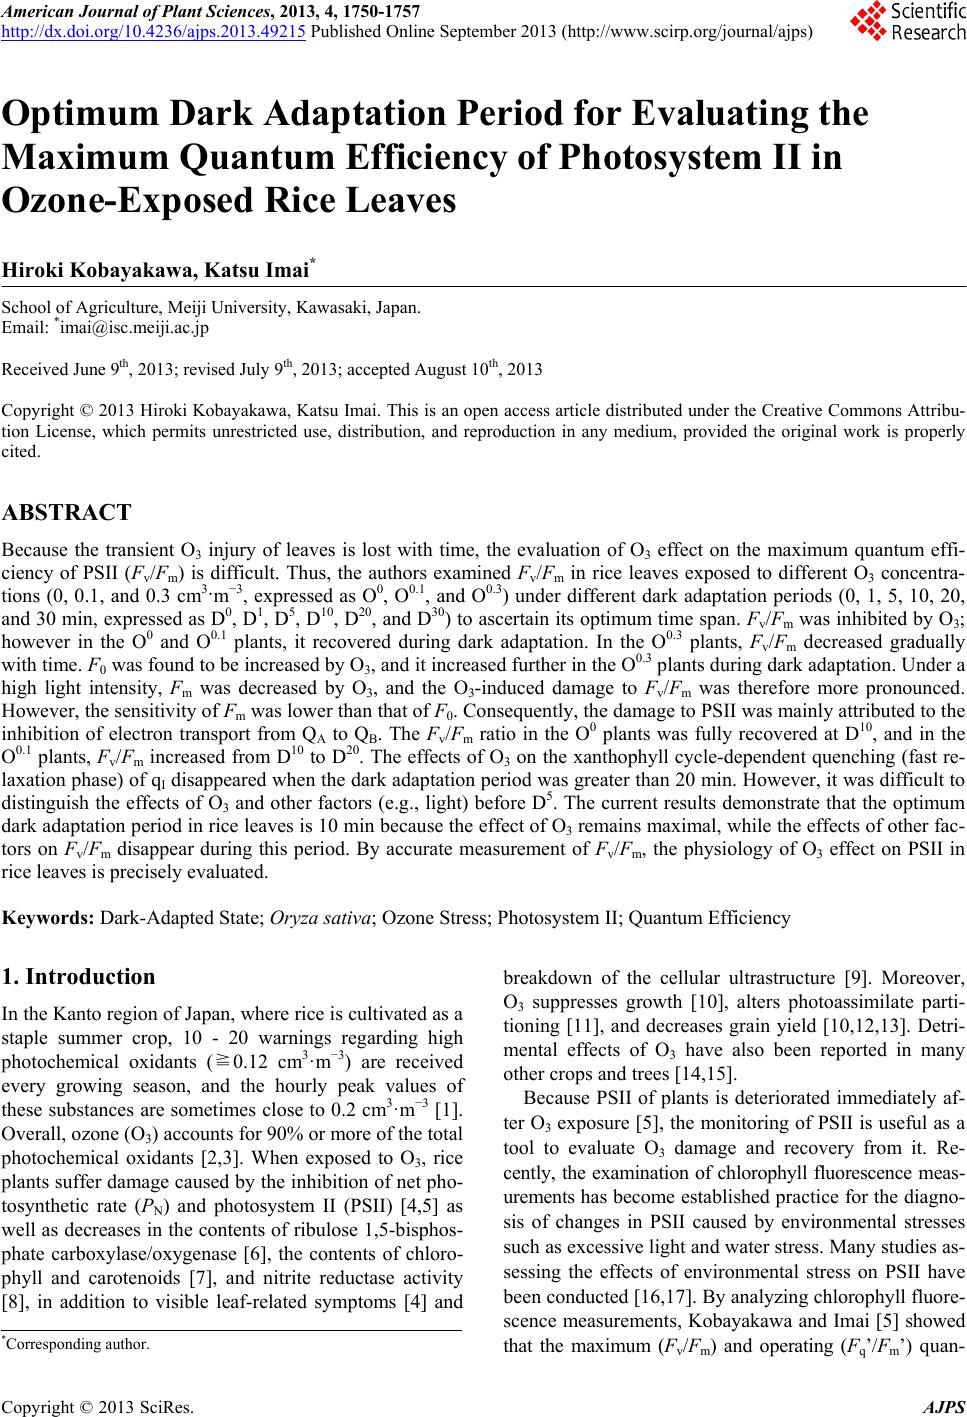
|