 Open Journal of Genetics, 2013, 3, 216-223 OJGen http://dx.doi.org/10.4236/ojgen.2013.33024 Published Online September 2013 (http://www.scirp.org/journal/ojgen/) Integration of expression profiles and endo-phenotypes in genetic association studies: A Bayesian approach to determine the path from gene to disease Sharon M. Lutz1,2,3*, Sunita Sharma4, John E. Hokanson5, Scott Weiss4, Benjamin Raby4, Christoph Lange2,4,6 1Department of Biostatistics, Harvard School of Public Health, Boston, USA 2Institute for Genomic Mathematics, University of Bonn, Bonn, Germany 3Department of Biostatistics, University of Colorado at Denver, Aurora, USA 4The Channing Division of Network Medicine, Department of Medicine, Bringham and Women’s Hospital, Boston, USA 5Department of Epidemiology, University of Colorado at Denver, Aurora, USA 6Germand Center for Neurodegenerative Diseases (DZNE), Bonn, Germany Email: *Sharon.lutz@ucdenver.edu Received 12 July 2013; revised 14 August 2013; accepted 22 August 2013 Copyright © 2013 Sharon M. Lutz et al. This is an open access article distributed under the Creative Commons Attribution License, which permits unrestricted use, distribution, and reproduction in any medium, provided the original work is properly cited. ABSTRACT In genetic association studies of complex diseases, endo-phenotypes such as expression profiles, epige- netic data, or clinical intermediate-phenotypes pro- vide insight to understand the underlying biological path of the disease. In such situations, in order to es- tablish the path from the gene to the disease, we have to decide whether the gene acts on the disease pheno- type primarily through a specific endo-phenotype or whether the gene influences the disease through an unidentified path which is characterized by different intermediate phenotypes. Here, we address the ques- tion that a genetic locus, given its effect on an endo-phenotype, influences the trait of interest pri- marily through the path of the endo-phenotype. We propose a Bayesian approach that can evaluate the genetic association between the genetic locus and the phenotype of interest in the presence of the genetic effect on the endo-phenotype. Using simulation stud- ies, we verify that our approach has the desired properties and compare this approach with a media- tion approach. The proposed Bayesian approach is illustrated by an application to genome-wide associa- tion study for childhood asthma (CAMP) that con- tains expression profiles. Keywords: Expression Profiles; Endo-Phenotypes; Genetic Association Studies; Bayesian Hierarchal Model; Pathway; Mediation 1. INTRODUCTION Following the paradigm that the biological road from a genetic locus to the disease phenotype of interest leads through expression data, the combination of genetic and expression data provides a unique opportunity to identify the path from gene to disease, and ultimately, the under- standing of the genetic causes of the disease. Conse- quently, it has become more common to collect expres- sion profile data in genetic association studies [1]. Other endo-phenotypes, such as epigenetic data, genomic data or clinical intermediate phenotypes can provide similar insight into the path from gene to disease. Complex dis- eases are often defined or characterized by a set of clini- cal intermediate phenotypes that describe the different features of the disease, such as respiratory phenotypes and atopy phenotypes. By definition, asthma affection status and the two types of endo-phenotypes will be cor- related. If an association between a genetic locus and asthma affection status is observed, associations between the same genetic locus and the endo-phenotype will also be visible. It is crucial for the understanding of the dis- ease to be able to determine whether the effects of the genetic locus on affection status can be explained by its influence on just one endo-phenotype (i.e. respiratory or atopy) or whether there are additional avenues via dif- ferent endo-phenotypes. For expression profiles, epigen- tic data, etc., the goal of an integrated analysis should be to conclude that the genetic association is completely *Corresponding author. OPEN ACCESS  S. M. Lutz et al. / Open Journal of Genetics 3 (2013) 216-223 217 explained by particular genomic associations, i.e. asso- ciations between the genetic locus and genomic data. This establishes a path from the genetic locus through the expression data. While endo-phenotypes are available in many genetic association studies, its integration in the statistical analy- sis is not trivial. Methods have been proposed that use an adjustment procedure to test the null hypothesis of no direct genetic effect on the disease phenotype in the presence of another association between the same marker locus and an endo-phenotype [2-4]. However, this me- thod allows one only to test if the genetic locus has a direct, causal effect on the disease. In many applications, particularly for expression profiles or epigenetic data, one may be interested in testing the reversed null hy- pothesis, i.e. the presence of a direct genetic effect on the disease phenotype, given the genetic association with the particular endo-phenotype [5-11]. A rejection of this null hypothesis allows one to conclude that there is no direct genetic effect between the genetic locus and the disease. This means that the gene acts on the disease primarily through a specific endo-phenotype. This allows us to eliminate other potential disease paths. A mediation ap- proach by Imai et al. can be used to test for both the in- direct and direct effect of the gene on the phenotype of interest via the endo-phenotype [12-15]. Using a Bayes- ian framework in order to simultaneously test whether the SNP is associated with the phenotype through the endo-phenotype or through another path, we propose an approach that evaluates the origin of the genetic associa- tion in the presence of the genomic association. Using simulation studies, we verify that the proposed Bayesian approach has the desired properties and compare this method to the mediation approach by Imai et al. [12]. The approach is illustrated by an application to ge- nome-wide association study for childhood asthma with expression profile data [16,17]. 2. METHODS Let n denote the number of subjects in a genetic associa- tion study. Let Y denote the phenotype of interest; for example, Y could be Body Mass Index (BMI) or Forced Expiratory Volume (FEV). Let X denote the coded genotype of the marker locus (i.e. X = 0, 1, 2 for an addi- tive genetic model) and K denote the endo-phenotype such as expression profiles, epigenetic data, or an inter- mediate phenotype such height. is the mean-centered, residuals which are obtained by regressing the phenotype of interest on the endo-phenotype K. Let Zj for j = 1,...,m denote covariates to be included in the model such as age or gender. For now, assume that Y 1 . m ijjii j YZX where 1, ,in and is normally distributed with mean 0 and variance 2 . If the SNP acts primarily through the endo-phenotype and does not have a direct effect on the disease pheno- type Y, then the genotype X is independent of the pheno- type of interest Y given the endo-phenotype K and any confounders. As a result, in the frequentist setting, an- swering the question of interest whether the SNP acts on the phenotype through the endo-phenotype is equivalent to testing the following null and alternative hypothesis: 0: :0 A H H 0 (2) Since the alternative hypothesis is a singularity in the 1-dimensional space for the regression parameter and the likelihood function is continuous, the likelihood ratio test is always 1 and the score test 0. Standard fre- quentist approaches, such as fitting a linear regression model and testing if =0 will not work here. Instead, there are several causal methods that can be used to test this indirect effect of X on Y through K, especially in the context of genetic and genomic data [5-11]. The method by Imai et al. allows one to test for both a direct and indirect effect using a mediation approach [12-15]. In the mediation framework, Y can be viewed as the outcome, K the endo-phenotype can viewed as the me- diator, and X can be viewed as the non-binary treatment variable, which Imai et al. can accommodate [14]. Imai et al. method and subsequent R package rely on the fol- lowing identification result obtained under the sequential ignorability assumption of Imai et al. [12] for any two levels of the treatment such that x1 ≠ x0 10 ,, ,, dd i ii iiii iii i Z KX xZ zKX xZz tEYKkXxZz d kF kFz (3) where t is the average causal mediation effect 1 0, ,, ,,d d i ii i ii ii ii iiZz KX xZ z tEYKkXxZz EYKkXx ZzFkFz (4) where t is the average direct effect. Causal media- tion analysis under these assumptions require two statis- tical models to be fit: one for the mediator , iii KXZ and the other for the outcome variable ,, iiii YX KZ. The estimated causal mediation effect and direct effect are calculated using algorithms detailed in Imai et al. [13] and implemented using the corre- sponding R package mediation [12]. While the mediation approach by Imai et al. can be used to test the null hypothesis (2) and the direct effect of the SNP on the phenotype of interest, we propose a (1) Copyright © 2013 SciRes. OPEN ACCESS  S. M. Lutz et al. / Open Journal of Genetics 3 (2013) 216-223 218 Bayesian approach that allows us to simultaneously test the indirect effect in addition to the direct effect. In the Bayesian framework, testing (2) is equivalent to fitting the full model (1) and determining which coefficients can be dropped from the model, which is equivalent to covariate selection and coefficient estimation in the standard normal linear regression model. Classical vari- able selection methods use either the Akaike information criterion or the Bayes information criterion to choose among possible models using −2log (max likelihood) plus a penalty term based on the dimensionality of the model [18-21]. However, in practice, this type of method is implemented using either forward selection or back- ward elimination, which can result in a locally optimal solution instead of the globally optimal solution. Fur- thermore, in this situation, using a method that depends on maximizing the likelihood will always favor the null hypothesis which would not be beneficial here. To cir- cumvent both of these problems, we propose a Bayesian method which uses a spike and slab prior which allows = 0 [22,23]. In order to develop this approach, we re-write model (1) as follows: 2 1 ,,, ~, m ijji j YNZX 2 i . (5) The prior for the mean parameter is defined as follows: ,~ 0, x cNc (6) where cx is a constant and γ = 0 or 1. The model is rela- tively insensitive to cx with choices cx = 2.852 or [18,19]. Consequently, based on both these recommendations and on simulation studies that we performed, we recommend setting cx = 10. The parame- ter γ controls the probability that 10,10000 x c is drawn from a point mass at zero. If γ = 0, then is drawn from a point mass at zero and if γ = 1, then is drawn from a normal distribution. The following prior is used for γ: ~ Bernoulli (7) where π is a constant. This model selection approach is a form of a spike and slab prior since it amounts to setting to zero with some nonzero probability. In order to put equal weight on the null and alternative hypothesis so that the type-1 error rate is not inflated, we suggest set- ting π = 0.5. Based on simulation studies, the model is relatively insensitive to the choice of π as long as π is not set to a value near zero or one. For example if π = 0, then γ = 0 for every iteration of the Markov chain Monte Carlo (MCMC), which is used to sample from the poste- rior distribution. This will prevent the MCMC from mixing well or converging. To be as non-informative as possible, Gelman (2006) suggests putting a flat prior on σ [24]. For αj for j = 1, ..., m, we suggest the following prior: ~0, z cNc z (8) where cz is a constant. Based on the literature and simu- lation studies, we recommend setting cz = 10 [18,19]. This model can be fit using Markov Chain Monte Carlo (MCMC) [19,25]. The conditional posteriors for σ2, and α have a closed form, but the conditional poste- rior for γ does not have a closed form. Consequently, a Gibbs sampler can be used to sample from the condi- tional posteriors for σ2, and α and a Metropolis Hastings Independence Sampler can be used to sample from the conditional posterior for γ [19]. 3. SIMULATIONS To evaluate how the proposed approach compares to Imai et al.’s mediation approach, we preformed simula- tions based on 1,000 replications. Figure 1 shows the three scenarios under which the data was simulated. Scenario 1 is generated under the alternative hypothesis where the effect of X on Y is mediated through K. Sce- nario 2 is generated under the null hypothesis where the effect of X on Y is not mediated through K. Scenario 3 is a combination of the first two scenarios, where the effect of X on Y is mediated through K and also through some other endo-phenotype. For all three scenarios, X is generated with an allele frequency of 20% for n = 1000 subjects. For scenario 1, K is generated from a normal distribution with mean ζxX where ζx is chosen such that the correlation between X and K is 0.2 and Y is generated from a normal distribu- tion with mean ζkK where ζk is chosen such that the cor- relation between K and Y is 0.1. For scenario 2, K is gen- erated from a normal distribution with mean ζxX where ζx is chosen such that the correlation between X and K is 0.2 and Y is generated from a normal distribution with mean ζxX where ζx is chosen such that the correlation between X and Y is 0.2. For scenario 3, K is generated from a normal distribution with mean ηxX where ηx is chosen such that the correlation between X and K is 0.2 and Y is generated from a normal distribution with mean ζxX + ζkK where ζx is chosen such that the correlation Figure 1. Figures illustrating how the data was simulated. K denotes the endo-phenotype of interest, Y denotes the pheno- type of interest and X denotes the SNP of interest. The first plot represents scenario 1, the alternative hypothesis where the ef- fect of X on Y is mediated by K. The 2nd plot represents the null hypothesis, where the effect of X on Y is not mediated through K. The 3rd plot represents a combination of the null and alternative hypothesis where X acts on Y through K and X also directly acts on Y. Copyright © 2013 SciRes. OPEN ACCESS 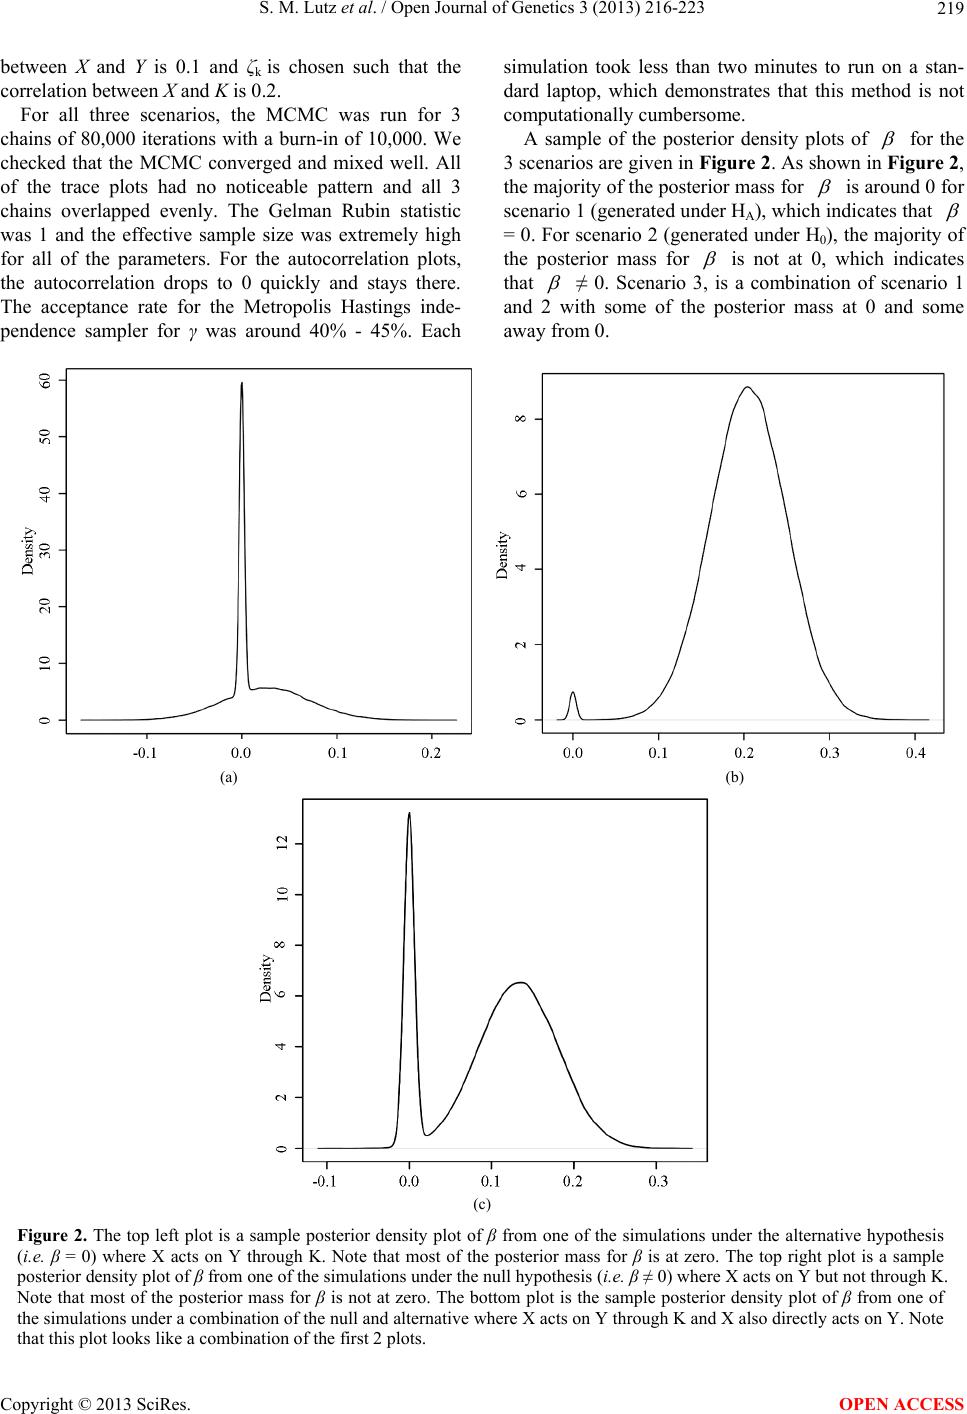 S. M. Lutz et al. / Open Journal of Genetics 3 (2013) 216-223 Copyright © 2013 SciRes. 219 between X and Y is 0.1 and ζk is chosen such that the correlation between X and K is 0.2. simulation took less than two minutes to run on a stan- dard laptop, which demonstrates that this method is not computationally cumbersome. For all three scenarios, the MCMC was run for 3 chains of 80,000 iterations with a burn-in of 10,000. We checked that the MCMC converged and mixed well. All of the trace plots had no noticeable pattern and all 3 chains overlapped evenly. The Gelman Rubin statistic was 1 and the effective sample size was extremely high for all of the parameters. For the autocorrelation plots, the autocorrelation drops to 0 quickly and stays there. The acceptance rate for the Metropolis Hastings inde- pendence sampler for γ was around 40% - 45%. Each A sample of the posterior density plots of for the 3 scenarios are given in Figure 2. As shown in Figure 2, the majority of the posterior mass for is around 0 for scenario 1 (generated under HA), which indicates that = 0. For scenario 2 (generated under H0), the majority of the posterior mass for is not at 0, which indicates that ≠ 0. Scenario 3, is a combination of scenario 1 and 2 with some of the posterior mass at 0 and some away from 0. (a) (b) (c) Figure 2. The top left plot is a sample posterior density plot of β from one of the simulations under the alternative hypothesis (i.e. β = 0) where X acts on Y through K. Note that most of the posterior mass for β is at zero. The top right plot is a sample posterior density plot of β from one of the simulations under the null hypothesis (i.e. β ≠ 0) where X acts on Y but not through K. Note that most of the posterior mass for β is not at zero. The bottom plot is the sample posterior density plot of β from one of the simulations under a combination of the null and alternative where X acts on Y through K and X also directly acts on Y. Note that this plot looks like a combination of the first 2 plots. OPEN ACCESS  S. M. Lutz et al. / Open Journal of Genetics 3 (2013) 216-223 220 Table 1 shows the percent of simulations where 0 is in the 95% credible band for β and the percent of simula- tions the mediation effect and direct effect are significant. For Scenario 1 generated under the alternative hypothesis, 99.7% of the simulations have 0 contained in the 95% credible bands for β where as 79.1% of the simulations are significant for the mediation effect. In scenario 2 generated under the null hypothesis, 0.8% of the simu- lations contain 0 in the 95% credible bands and 6.7% of the simulations have a significant mediation effect. For scenario 3, a combination of 1 and 2, 40.2% of the simu- lations contain 0 in the 95% credible bands and 71.5% of the simulations have a significant mediation effect and 67.2% of the simulations have a significant direct effect, which accurately captures the simulated scenario of both a direct and indirect effect. We also simulated the three scenarios above with known confounders and an unmeasured confounder, the results where similar to those seen above so they are not depicted here. 4. DATA ANALYSIS We applied the proposed approach to the CAMP Study which was a multicenter, randomized, double-blind, pla- cebo-controlled trial for childhood asthma which was established to investigate the long-term effects of inhaled corticosteroids and inhaled nedocromil, a non-steroidal anti-inflammatory medication [16,17]. Children enrolled in CAMP had mild to moderate persistent asthma based on the demonstration of increased airway responsiveness and at least two of the following: asthma symptoms at least twice weekly, use of inhaled bronchodilator at least twice weekly, or use of daily asthma medication for at least six months in the year prior to screening. Expres- sion data is now also available in the CAMP study. For the data analysis, we selected immunoglobulin E (IgE) as the target phenotype Y. We applied our method 5 times to determine if the SNP is associated with IgE through the expression profile of interest for the follow- ing 5 SNPs and expression profile pairs: rs9388766/ L3MBTL3, rs9388766/ L3MBTL3, rs11778556/NRBP2, rs10739927/CENPP, and rs1293764/OAS2. These 5 SNPs/expression profile pairs were chosen since they achieved genome-wide significant with the phenotype of interest IgE after adjusting for age and gender. Table 2 shows the posterior means for β and the 95% credible bands. For all 5 SNPs/expression profile pairs, 0 is contained in the 95% Credible Bands. The table also shows the p-values for the mediation and direct effect. Figure 3 shows the posterior density plots for β with the majority of the posterior mass at zero. There is a spike at zero which occurs when γ = 0 and there is a normal curve centered near 0 when γ = 1. As seen in Figure 3 for SNP rs10739927/expression profile CENPP, the majority of the posterior mass is at zero and the posterior density plot of β for this pair is the most similar to the posterior density plot of β simulated under the alternative as seen in Figure 2. Therefore, these results indicate that SNP rs10739927 may be associated with IgE through the cor- responding expression profile CENPP. Table 1. Pseudo power and type-1 error rate for the simulations. Simulated Scenario Bayesian Approach Mediation Effect Direct Effect 1) Power (X− > K− > Y) 99.7% 79.1% 3.0% 2) Type-1 Error Rate (X− > Y) 0.8% 6.7% 98.1% 3) Combination of 1 and 2 40.2% 71.5% 67.2% a. For the Bayesian approach, above is the percent of simulations where 0 is in the 95% Credible Interval for the 3 simulated scenarios depicted in Figure 1. The first row of the table is scenario 1 where the data is generated under the alternative, where the effect of X on Y is mediated through K. Note the improve- ment of the Bayesian approach over the Mediation approach (i.e. 99.7% vs 79.1%) The second row of the table represents the type-1 error rate, where the effect of X on Y is not mediated through K. Note that both the Bayesian approach and the Mediation approach are near or below 5%. The last row represents the scenario where the effect of X on Y is only partially mediated by K. Both approaches detect this effect. For the Bayesian Approach, it is easier to see this con- cept by looking at the posterior distribution in Figure 2. For the mediation approach, this can be seen by there being both a mediation and direct effect as seen in table above. Table 2. Below are posterior means and credible bands for β for the corresponding SNP and expression profile from the CAMP data- set and the p-values for the mediation and direct effect. SNP/Expression Profile Posterior Mean 95% Credible Interval p-value for Mediation Effect p-value for Direct Effect rs9388766 L3MBTL3 1.70 (−2.51,6.90) 0.31 0.16 rs9388766 L3MBTL3 1.67 (−2.49,6.82) 0.34 0.17 rs11778556 NRBP2 1.37 (−2.99,6.68) 0.86 0.19 rs10739927 CENPP 0.42 (−4.76,5.93) 0.25 0.44 rs1293764 OAS2 −1.86 (−7.01,2.35) 0.48 0.08 Copyright © 2013 SciRes. OPEN ACCESS  S. M. Lutz et al. / Open Journal of Genetics 3 (2013) 216-223 221 (a) (b) (c) (d) (e) Figure 3. Posterior density of β for the corresponding SNP and expression profile. Copyright © 2013 SciRes. OPEN ACCESS  S. M. Lutz et al. / Open Journal of Genetics 3 (2013) 216-223 Copyright © 2013 SciRes. 222 5. DISCUSSION This proposed Bayesian approach is comparable to the mediation approach proposed by Imai et al. Both meth- ods perform similar in scenario 2 when the data are simu- lated under the null hypothesis that the effect of X on Y is not mediated by K. For scenario 1 (the effect of X on Y is mediated by K) the proposed approach performs better than the mediation approach by Imai et al. For scenario 3 (a combination of scenario 1 and 2), it is not clear which approach is better. For this case, it is also best to look at the posterior density plot for β in addition to the 95% confidence bands since this provides additional informa- tion. OPEN ACCESS The strength of this Bayesian approach is that in this framework one does not need to reject the null hypothe- sis as in the frequentist framework. As a result, one can conclude that there is a direct or indirect effect, whereas in the frequentist setting, most approaches require fitting two models to make both of these conclusions since one can only reject the null hypothesis or fail to reject it. The weakness of this proposed approach is that Y must be continuous whereas the approach by Imai et al. can ac- commodate a broader range of phenotypes. In conclusion, the increasing availability of expression, epi-genetic profile, genomic data, and other endo-pheno- types in genetic association studies poses a great oppor- tunity and challenge at the same time. While the wealth of data provides the prospect for a better understanding of the disease paths, the analysis of the data is not trivial. To identify indirect effects, direct effects, or a combina- tion of these effects, the proposed Bayesian approach provides a suitable alternative to the mediation method proposed by Imai et al. in this context. Given expression, epi-genetic, genomic data, or other endo-phentoypes, our approach allows us to rule out direct genetic effects on the disease phenotype, implicating that the path of the disease phenotype leads through the components de- scribed by the expression, epi-genetic or genomic data. While our approach allows the powerful analysis of quantitative disease traits, extensions to other disease phenotypes have still to be investigated and are part of our ongoing research. The code for this analysis is available by emailing the corresponding author. 6. ACKNOWLEDGEMENTS This work was funded by NIH/NHLBI U01 HL089856 Edwin K. Silverman, PI. COPDGene is supported by NHLBI Grant Nos U01HL089897 and U01Hl089856. We would like to thank all subjects for their ongoing participation in this study. We acknowledge the CAMP investigators and research team, supported by NHLBI, for collection of CAMP Genetic Ancillary Study data. Special thanks to Anne Plunkett, Teresa Concordia, Debbie Bull, Denise Rodgers, and D. Sundstrom for their assistance with sample collection; to Huiqing Yin-DeClue, Ph.D, Michael McLane and Chris Allaire for their assistance with T cell isolations and RNA preparation; and to Ankur Patel for his assistance running the microarrays. All work on data collected from the CAMP Genetic Ancillary Study was conducted at the Channing Laboratory of the Brigham and Women’s Hospital under appropriate CAMP policies and human sub- ject protections. This work is supported by grant R01 HL086601 from the National Heart, Lung and Blood Institute, National Institutes of Health (NIH/NHLBI). The CAMP Genetics Ancillary Study is sup- ported by U01 HL075419, U01 HL65899, P01 HL083069 and T32 HL07427 from the NIH/NHLBI, and through the Colorado CTSA grant 1 UL1 RR025780 from the National Institutes of Health (NIH) and National Center for Research Resources (NCRR). No microarray data or other biological or clinical data is presented for the first time in this paper. Rather available biological and clinical data in the CAMP project are used. REFERENCES [1] Naylor, M.G., Lin, X., Weiss, S.T., Raby, B.A and Lange, C. (2010) Using canonical correlation analysis to dis- cover gentic regulatory variants. PloS One, 5, e10395. [2] Vansteelandt S. (2009) Estimating direct effects in cohort and case-control studies. Epidemiology, 20, 851-860. doi:10.1097/EDE.0b013e3181b6f4c9 [3] Vansteelandt, S., Geotgeluk, S., Lutz, S., Waldman, I., Lyon, H., Schadt, E.E., Weiss, S.T. and Lange, C. (2009) On the adjustment for covariates in genetic association analysis: A novel, simple principle to infer direct causal effects. Genetic Epidemiology, 33, 394-405. doi:10.1002/gepi.20393 [4] Lipman, P.J., Liu, K.Y., Muehlschlegel, J.D., Body, S. and Lange, C. (2010) Inferring genetic causal effects on survival data with associated endo-phenotypes. Genetic Epidemiology, 35, 119-124. doi:10.1002/gepi.20557s [5] Schadt E. E., Lamb J., Yang, X., Zhu, J. and Edwards, S. (2005) An integrative genomics approach to infer causal associations between gene expression and disease. Nature Genetics, 37, 710-717. doi:10.1038/ng1589 [6] Kulp, D.C. and Jagalur, M. (2006) Causal inference of regulator-target pairs by gene mapping of expression phenotypes. BMC Genomics, 7, 125. doi:10.1186/1471-2164-7-125 [7] Aten, J.E., Fuller, T.F., Lusis, A.J. and Horvath, S. (2008) Using genetic markers to orient the edges in quantitative trait networks: The NEO software. BMC Systems Biology, 2, 34. doi:10.1186/1752-0509-2-34 [8] Millstein J., Zhang, B., Zhu, J. and Schadt, E.E. (2009) Disentangling molecular relationships with a causal in- ference test. BMC Genetics, 10, 23. doi:10.1186/1471-2156-10-23 [9] Duarte, C. W. and Zeng, Z.B. (2011) High-confidence discovery of genetic network regulators in expression quantitative trait loci data. Genetics, 187, 955-964. doi:10.1534/genetics.110.124685 [10] Chen, L.S., Emmert-Streib, F. and Storey, J.D. (2007)  S. M. Lutz et al. / Open Journal of Genetics 3 (2013) 216-223 223 Harnessing naturally randomized transcription to infer regulatory relationships among genes. Genome Biology, 8, R219. doi:10.1186/gb-2007-8-10-r219 [11] Li, R., Tsaih, S.W., Shockley, K., Stylianou, I.M., Wergedal, J., Paigen, B. and Churchill, G.A. (2006) Stru- ctural model analysis of multiple quantitative traits. PLoS Genetics, 2, e114. doi:10.1371/journal.pgen.0020114 [12] Imai, K., Keele, L., Tingley, D. and Yamamoto, T. (2010) Causal mediation analysis using R. In: Vinod, H.D., Ed., Advances in Social Science Research Using R, Springer, New York, 129-154. [13] Imai, K., Keele, L. and Tingley, D. (2010) A general approach to causal mediation analysis. Psychological Methods, 15, 309-334. doi:10.1037/a0020761 [14] Imai, K., Keele, L. and Yamamoto, T. (2010) Identifica- tion, inference, and sensitivity analysis for causal media- tion effects. Statistical Science, 25, 51-71. doi:10.1214/10-STS321 [15] Imai, K., Keele, L., Tingley, D. and Yamamoto, T. (2011) Unpacking the black box: Learning about causal mecha- nisms from experimental and observational studies. Ame- rican Political Science Review, 105, 765-789. doi:10.1017/S0003055411000414 [16] The Childhood Asthma Management Program Research Group (2000) Long-term effects of budesonide or nedo- cromil in children with asthma. The New England Jour- nal of Medicine, 343, 1054-1063. doi:10.1056/NEJM200010123431501 [17] The Childhood Asthma Management Program Research Group (1999) The childhood asthma management pro- gram (CAMP): Design, rationale, and methods. Con- trolled Clinical Trials, 20, 91-120. doi:10.1016/S0197-2456(98)00044-0 [18] Carlin, B.P. and Louis, T.A. (2009) Bayesian methods for data analysis. Chapman and Hall/CRC Press, Boca Raton. [19] Gelman, A., Carlin, J.B., Stern, H.S. and Rubin, D.B. (2003) Bayesian data analysis. Chapman and Hall/CRC Press, Boca Raton. [20] O’Hagan, A. and Foster, J. (2004) Kendall’s advanced theory of statistics: Bayesian inference. Edward Arnold Press, London. [21] Spiegelhalter, D.J., Abrams, K.R. and Myles, J.P. (2004) Bayesian approaches to clinical trials and health-care evaluation. John Wiley and Sons, Chichester. [22] Chipman, H., George, E.I. and McCulloch, R.E. (2001) The practical implementation of Bayesian model selec- tion. IMS Lecture Notes—Monograph Series, 38, 65-134. doi:10.1214/lnms/1215540964 [23] Yuan, M. and Lin, Y. (2005) Efficient empirical Bayes variable selection and estimation in linear models. Jour- nal of the American Statistical Association, 100, 1215- 1225. doi:10.1198/016214505000000367 [24] Gelman, A. (2006) Prior distributions for variance pa- rameters in hierarchical models. Bayesian Analysis, 3, 515-533. [25] Robert, C.P. and Casella, G. (2004) Monte Carlo statisti- cal methods. Springer, New York. doi:10.1007/978-1-4757-4145-2 Copyright © 2013 SciRes. OPEN ACCESS
|