Journal of Modern Physics
Vol.07 No.04(2016), Article ID:63923,15 pages
10.4236/jmp.2016.74038
Quantum Interference without Wave-Particle Duality
Román Castañeda1*, Giorgio Matteucci2, Raffaella Capelli3
1Physics School, Universidad Nacional de Colombia Sede Medellín, Medellín, Colombia
2Department of Physics and Astronomy, University of Bologna, Bologna, Italy
3CNR―Istituto Officina dei Materiali, Trieste, Italy

Copyright © 2016 by authors and Scientific Research Publishing Inc.
This work is licensed under the Creative Commons Attribution International License (CC BY).
http://creativecommons.org/licenses/by/4.0/


Received 24 December 2015; accepted 23 February 2016; published 26 February 2016
ABSTRACT
Interference of light and material particles is described with a unified model which does not need to assume the wave-particle duality. A moving particle is associated with a region of spatial correlated points named coherence cone. Its geometry depends on photon or particle momentum and on the parameters of the experimental setup. The final interference pattern is explained as a spatial distribution of particles caused by the coherence cone geometry. In the present context, the wave front superposition principle, wave-particle duality and wave-collapse lose their meaning. Fits of observed single electron and single molecule interference patterns together with the simulation of expected near-field molecule interference (Talbot carpet) demonstrate the model validity.
Keywords:
Electron Interference, Molecule Interference, Two-Point Correlation, Wave-Particle Duality

1. Introduction
Interference of light and material particles is usually described with the superposition principle applied to waves. In case of light they are related to the electromagnetic field while, in case of a material particle, to the particle probability density. In spite of the success of this approach, it is a matter of fact that the description of massive objects propagation in terms of waves is a puzzling aspect of quantum mechanics.
Here we describe interference of light and material particles with a unified model which does not need to assume the wave-particle duality of Copenhagen interpretation. The energy propagation of photons or of massive particles is approached by solving the corresponding stationary coupled Helmholtz equations by the Green functions method, which yields two-point correlation functions [1] . We present an original solution of this problem that allows associating to a propagating object a region of spatial correlated points named coherence cone. Its geometry depends on photon or particle momentum and on the parameters of the experimental setup. The final interference pattern is explained as a spatial distribution of particles caused by the coherence cone geometrical structure. It must be underlined that the coherence properties, discussed in this paper, differ from those conventionally adopted in classical optics. For example, to an ideal point source we calculate a finite transversal coherence length while, in conventional optics, the lateral coherence is infinite.
In Section 2 the basic mathematical model is illustrated. Its reliability is demonstrated in Section 3 with, 1) the simulation of the build-up of two-slit single electron interference fringes, 2) the fit of a single electron interference we have observed using a linear transmission grating, 3) the fit of single molecule interference recorded at the Vienna Centre of Quantum Physics and Technology with a sophisticated interferometer, 4) the simulations of near-field, molecule interference figures which are known as Talbot carpets. Finally, a discussion section is reported.
2. Unified Model for Light and Material Particle Interference
2.1. Fundamentals
To introduce our approach, let us consider the Schrödinger and Maxwell equations for moving particles and light propagation in field free space, respectively. Taking into account only the stationary solutions 
 , with energy E,
  and h the Planck constant, the time dependence can be eliminated so that either the Schrödinger or the Maxwell equations are written in a unified form corresponding to the Helmholtz equation
![]() , (1)
, (1)
where ![]() is the electromagnetic field with associated photons of momentum p, or the complex amplitude probability function of particles of momentum p. The two-point correlation
is the electromagnetic field with associated photons of momentum p, or the complex amplitude probability function of particles of momentum p. The two-point correlation![]() , with
, with![]() ,
, ![]() and asterisk denoting ensemble average and complex conjugated respectively, is a well-established method to describe optical interference [1] . This mathematical approach is extended here to account for the propagation of single particles through an interferometer. Moreover, an original physical interpretation of the model is given.
and asterisk denoting ensemble average and complex conjugated respectively, is a well-established method to describe optical interference [1] . This mathematical approach is extended here to account for the propagation of single particles through an interferometer. Moreover, an original physical interpretation of the model is given.
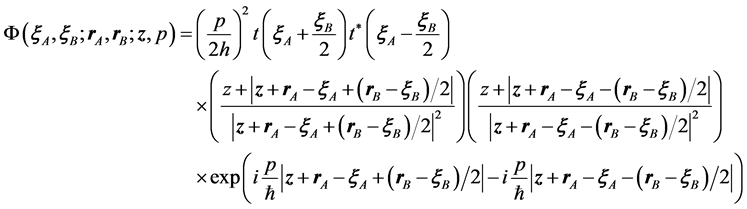
Let us consider a space volume delimited by two parallel planes at a distance ![]() named, respectively, input (IP) and output plane (OP), Figure 1. The two-point correlation at the OP can be expressed as a modal expansion, whose coefficients are given by the two-point correlation at the IP. In turn, the non-paraxial modes, obtained by solving Equation (1) by the Green’s function method [2] , define the modal kernel, i.e.
named, respectively, input (IP) and output plane (OP), Figure 1. The two-point correlation at the OP can be expressed as a modal expansion, whose coefficients are given by the two-point correlation at the IP. In turn, the non-paraxial modes, obtained by solving Equation (1) by the Green’s function method [2] , define the modal kernel, i.e.
![]() . (2)
. (2)
The reduced coordinates ![]() and
and ![]() univocally refer to pairs of points, with separation vectors suffixed B, to the midpoint between them at the positions suffixed A, so that
univocally refer to pairs of points, with separation vectors suffixed B, to the midpoint between them at the positions suffixed A, so that ![]() on IP and
on IP and  on OP. The region around each position suffixed A includes pairs of points for which the two-point correlation takes on non-null values. It is called the structured support of spatial coherence. Outside the structured support, the two-point correlation nullifies or is negligible. The modal kernel
 (3)
(3)

Figure 1. Illustrating the notation relating to Equation (2) for the correlation propagation. Reduced coordinates are shown on shadowed circles that represent structured supports of spatial coherence on each plane. A point emitter is placed at the structured support centre on IP and its contribution is related to a structured support and its centre, on OP, by the solid and the dotted lines, respectively.
is a scalar, dimensionless, complex valued and deterministic function, essentially determined by the boundary conditions of the arrangement.  is the complex transmission function of IP.
By assuming the spatial symmetry of Equation (3) for each point in IP, the modal kernel defines a cone with vertex at the input plane and base at the output plane, Figure 1. The electromagnetic irradiance or the particle
density distribution at IP and OP are the physical observables given by  and
and
 respectively. From Equation (2) follows
 , (4a)
where
 (4b)
(4b)
is the contribution of the structured support centred at a given  to the physical observable at any
 . To characterize physically the two point correlation function, it is useful to introduce the dimensionless function
  in the integral of Equation (4b), with
  the Dirac delta function, thus obtaining
 ,
,
with
 , (5a)
and
 , (5b)
given, respectively, by the first and second term of the dimensionless function. From Equation (3) it follows that, in Equation (5a),  is real and positive definite, so that
 . Accordingly, Equation (5a) denotes the transport of the physical observable from a fixed
  to any
 . For this reason, the vertex of the cone defined by the kernel of Equation (5a), which acts as source of
 , is named real point emitter.
  is independent of the two-point correlation for
 . The hermitic symmetry of
  and
and  for the change
  leads to the real part of the kernel in Equation (5b), denoted Re. Indeed, it results from the association of the integrand values for the two degrees of freedom in orientation of
 . Consequently,
  oscillates between positive and negative values with average zero without affecting the total number of particles (Appendix 1). For this reason, the vertex of the cone defined by the kernel of Equation (5b), which acts as source of
 , is named virtual point emitter. The physical effect of
  is to distribute particles, arising from the real point emitters, along well defined regions of the interferometer. From Equations (4) and (5) the physical observable is then given by
 , (6a)
with
 (6b)
(6b)
and
 (6c)
(6c)
In summary, a model for particle propagation from IP to OP is obtained by considering, 1) two sets of point emitters, with different physical attributes, distributed on IP and, 2) the corresponding cone geometries confined within the volume delimited by IP and OP. The real point emitters represent the photon irradiance or the particle density at a given point , independently of the two-point correlation conditions. The cones associated to photon or particle propagation have different scales but similar geometries given by
 .
.
The virtual point emitters are determined by the corresponding two-point correlation over the structured support centred at the emitter position. The correlation cones depend on the shape and size of the experimental setup and the particle momentum according with the modal kernel of Equation (5b). The virtual cones modulate the space between IP and OP, thus contributing to the formation of the final interference pattern. In conclusion, the propagation of particles between two planes is reduced to define two types of cones, i.e. the real and the virtual ones. The mathematical procedure to define the minimum number and distribution of real and virtual point emitters to describe the final interference pattern is analogous to what reported in optics. (see [2] and references therein).
Although particle interference has also been described in terms of trajectories (see [3] -[7] and references therein), our approach does not define single paths but rather it delineates preferential regions for particles propagation through an interferometer. Indeed, Equation (1) does not define the dynamic of a discrete ensemble of single particles but it describes the particle spatial probability density.
2.2. The Young Interferometer
In this section we give a pictorial physical description of the coherence and real particle distribution through the interferometer as derived from the present model. The setup is divided into two stages in which, the output plane of the first stage is the input plane of the second one. With reference to Figure 2, the SM-stage is the volume delimited by the source (SP) and the mask (MP) planes placed at a distance z' to each other. The second stage MD is confined between MP and the detector plane (DP) placed at a distance z. The effective particle source, of size a, is at SP, while a mask with two holes at a distance b, is at MP. A conventional squared modulus detector is at DP.
The behaviour of photons or particles in both stages is described by inserting, in Equations (2)-(6), the corresponding experimental parameters (the integration domains, the distance between planes, etc.). Figure 3 shows two cases of high and zero correlation, respectively. The experimental parameters of the SM-stage (i.e. the source diameter a, the distance z', etc.) determine the correlation cone that provides the structured support of spatial coherence at MP as in graphs, (a) for high correlation and, (c) for zero correlation. In Figure 3(a), the lateral coherence (the central maximum diameter of the correlation cone) is larger than the two-pinhole distance b while in Figure 3(c) the lateral coherence is shorter than b.

Figure 2. Young setup for light or particle interference.

 (a) (b)
 (c) (d)
Figure 3. Correlation cones and particle propagation in a Young setup: (a): high correlation cones in SM- and MD-stages. The red spot represents the virtual point emitter, (b): particle propagation under the correlation conditions of (a), (c): the narrow correlation cone in SM determines vanishing coherence conditions in MD stage, (d): particle propagation under the correlation conditions of (c).
Under the high correlation conditions of Figure 3(a), a virtual point emitter, indicated by the red dot, is activated between the two holes. It generates, in the MD-stage, a cone whose internal structure is schematically represented by the bright and dark regions shown in Figure 3(a). Particles propagate preferentially along the bright regions so that a system of interference fringes is formed at the detector plane. Figure 3(b) shows an overall view of particle propagation from the source to the detector.
In case of zero correlation conditions in the SM-stage, the virtual source is not activated at MP leaving the MD-stage completely uncorrelated, Figure 3(c). Particles passing through the two holes are randomly distributed at the detector plane, Figure 3(d).
3. Single Material Particle Interference
3.1. Build-Up of Two-Slit Single Electron Interference
Let us proof the validity of the model by considering a two-slit or alternatively a double-hole, single electron experiment realized with the Young setup of Figure 2 (see Appendix 2 for details). Thermionic emission of single electrons is modelled as a uniform, random and spatially incoherent effective source at SP. The term “uniform” means that the emission probability is the same for all the source points and any of them emits the same average number of electrons per unit time with the same probability. For a spatial incoherent source  , which means that virtual point emitters are not activated at SP so that, in the SM-stage, Equation (2) becomes
 ,
,
(in optics, the paraxial approach of this expression is given by the Van Cittert-Zernike theorem [1] ). For an ideal point source at , it turns out that
  and
and . Therefore only one correlation cone, given by the modal kernel
 , specifies the structured support at MP. Accordingly a finite lateral coherence length is defined at a plane, at any distance from the source. This is a substantial different result with respect to the one obtained with a wave approach according to which an infinite transversal coherence is considered. By enlarging the effective source size the number of correlation cones increases. Their superposition in the SM-stage reduces the resulting structured support dimensions (lateral coherence) at MP, as discussed previously. An important consequence is that the effective source size determines the coherence conditions for interference, independently of the electron emission statistics.
The two holes of the Young mask are modelled with mathematical points at , it means that diffraction effects are neglected. When the electron beam strikes on the mask, then a real point emitter is activated in the hole crossed by a single electron. At the same time, if the correlation cone “illuminates” both holes, one virtual point emitter is activated at the midpoint between them, Figure 3(a). The final interference fringe system is given by the contribution of real and virtual point emitters according to Equation (6a),
 ,
,
where
 (7)
(7)
with
 (8)
(8)
By taking into account only the fraction S0 of electrons which go through the mask, we define P the probability of an electron passing the pinhole at the position , and
, and  the probability of electrons passing at
 . Therefore,
  and
and  represent the correlation functions of the real point emitters at the pinholes. By applying the Schwartz inequality to the two-point correlation
 , we obtain
 , where
  is the modulus
of the complex degree of spatial coherence [1] at MP and the condition  assures that electrons go through both pinholes.
Simulations of the build-up of single electron interference patterns with high, partial and very low correlation conditions are shown in Figure 4. The entries are in accordance with reported experimental setups [8] -[10] , (i.e. two-slit spacing 330 nm, detector resolution 128 × 32 pixels, p = 1.59 × 10⁻²² kg∙m∙s−1). The two-point correlation at MP is adjusted by changing the distance z' in the SM-stage to obtain three different coherence conditions while, the distance z in the MD-stage is fixed. The resulting detection events of 70,000 electrons are calculated. Detector sensitivity is modeled by adjusting the minimum number of “hits” on a specific pixel, during the integration time, in order to produce the record of electron arrivals. The background and the shot noises of conventional physical detectors are also taken into account. Zero electron loss is assumed so that the emission statistics determines the random electron arrivals to the detector.
Images of Figure 4 have two identical frames. The upper ones show the random electron hits on DP at the pixel indicated at top right. The number of arrivals is reported at top left. The lower frames show the interference figures resulting from the build-up of 70,000 single electrons. The cumulative, single electron detection process is accurately simulated with the present model in accordance with observations [8] [9] (for a historical review of single electron interference experiments see [10] ). The movies reporting the build-up of interference fringes with high, partial and no coherent conditions are available respectively at
3.2. Single Electron Interference with a Line Grating
The potential of our model is presented to fit the interference pattern obtained with single electrons striking on a line grating (see Appendix 3 for details). Figure 5 shows the left lobe of the observed pattern. It consists of an ensemble of bright spots with decreasing intensity as evidenced also by the calculated intensity profile .
.
Simulations were carried out by considering a uniform effective source whose size is controlled with the condenser lens system of the microscope [8] [9] . Under these conditions, a resulting sinc-function correlation envelope is obtained at MP. Due to the particular construction features of the grating, to obtain a careful fit of the interference peak modulation a Gaussian transmission function was used. Because images were recorded with non-standard electron optical ray path, microscope lens aberrations and non-linear response of the photographic recording were not considered. The excellent agreement with the experimental pattern of Figure 5 was obtained with an effective source diameter 130 nm.
 (a) (b) (c)
Figure 4. Simulated images of the build-up of single electron interference patterns under: (a) high correlation, (b) partial correlation and (c) very low correlation.

Figure 5. Left lobe of the observed single electron interference from a line grating and the corresponding calculated profile.
3.3. Single Molecule Interference with a Line Grating
Starting from these promising results, we simulate the single molecule interference patterns of Phthalocyanine (PcH2) and its derivative (F24PcH2) [11] . The molecular beam, generated by a Knudsen cell in a horizontal interferometer configuration, is limited by a collimating slit which determines the effective source size. Subsequently, molecules go through a linear transmission grating and interference patterns are revealed by a dedicated detector. In Figure 6, our simulations (red solid lines) are contrasted with the experimental curves reported in [11] . The simulation results are obtained with the experimental setup parameters which, for the small PcH2 and large F24PcH2 molecules are, respectively, 1) collimating slit 1 μm wide, collimating slit-grating distance 0.702 m, 2) collimating slit 3 μm wide, collimating slit-grating distance 0.566 m [11] . The transmission function for both collimating and grating slits is assumed constant in Figure 6(a) and Figure 6(b), and Gaussian in Figure 6(c) and Figure 6(d). The molecule velocity distribution, centred at values corresponding to the de Broglie wavelengths 5.2 pm for PcH2 and 2.1 pm for F24PcH2, is corrected for vertical dispersion due to gravity (for a more direct comparison of our simulations with those of [11] , the de Broglie wavelength is used instead of particle momentum). Moreover, an effective width reduction of the grating slits was considered, due to van der Waals interaction between grating bars and passing molecules [11] - [14] . Only the curves in Figure 6(c) and Figure 6(d) are in excellent agreement with the experimental results thus confirming that the assumption of a Gaussian transmission function is crucial. The maximum molecule transmission assumed centred on the slit optical axis is a further confirmation that the interaction between molecules and grating walls is essential to describe the final intensity distribution. Our simulation in Figure 6(d) is obtained only with a rigorous evaluation of the two-point correlation conditions (Appendix 4), without resorting to the ad hoc Gaussian correction to smear the interference peaks used in [11] .
It turns out that the lateral coherence distance at the grating plane is larger for PcH2 molecules than for F24PcH2 molecules. Because the grating period is the same in both experiments, the number of correlated slits is higher for the small molecules with respect to the bigger ones. It must be pointed out that the numerical fit of the experimental data of Figure 6(d) was obtained, by the Vienna group, using diffraction integrals in the paraxial approximation convoluted with an ad hoc Gaussian with a standard deviation of 3 μm [11] . To explain the observed smearing of the interference fringes, loss of contrast of Figure 6(d) with respect to Figure 6(c), molecular fragmentation within the beam and/or surface diffusion were assumed. Alternatively, our model, based on a

Figure 6. Fit of the experimental molecule interference curves for PcH2, (a) and (c), and F24PcH2, (b) and (d). Our simulations, red solid lines, are integrated in correspondence of a velocity spread Δv/v = 0.27. The blue dotted lines are the experimental data reported in [11] (Courtesy of Prof. M. Arndt).
rigorous evaluation of the two-point correlation conditions (Appendix 4), gives directly an excellent fit of the observed results advancing no further hypothesis.
3.4. Near-Field Interference: Talbot Carpets
Talbot carpets are near field interference figures which are repeated at specific distances away from the grating plane. The transversal dimension of the maxima and their periods, which depends on the grating distance, can be consistently reduced with respect to the grating slit size. In principle, this peculiarity is worth considering to realize molecular nanostructures on a large scale. Figure 7 illustrates a Talbot carpet of a thought experiment, based on realistic set up parameters, which could be realized with Tetracene molecules moving with a velocity of 2000 m/s produced by a SuMBD source [15] . A collimating slit, width 0.2 μm, is placed in front of the source at 1 m from a linear grating. The grating period is 500 nm and individual slit width 50 nm. As it can be seen in Figure 7, the period of the principal maxima is about 10 nm, a value much smaller that the slit width (50 nm). This result demonstrates clearly how our model can be adopted for nanolithography applied to organic electronics.
4. Discussion and Concluding Remarks
Interference of particles moving in field free space is described with a model that does not associate wave properties to moving corpuscles. Interference fringes result from the combined effect of particle momenta and peculiar configurations of spatial correlated points set out by the two-point correlation function. In particular, we have demonstrated that a careful fit of the experimental data is obtained without assuming that massive molecules propagate as delocalized quantum waves. Therefore, the wave front superposition principle is not needed and, as a consequence, the counter-intuitive features such as wave-particle duality, self-interference and wave- collapse lose their meaning. At present, we are not able to explain the fundamental nature of the spatial correlation but we have reported a physical intuitive and rigorous theory one can calculate with and obtain striking results.
A further remarkable outcome of the model is also obtained. Counter-intuitive infinite spatial coherence (for instance a plane wave) associated with an ideal point source (Dirac delta function) as adopted in Copenhagen interpretation is no longer considered. We have demonstrated that a finite coherence cone is also calculated (in far field conditions) for an ideal point source (see Appendix 5 for details about the definition and size of the structured support).
We hope that these considerations will help to shed new light regarding the role of the space on a basic problem of quantum mechanics.
Acknowledgements
We wish to thank M. Arndt and his colleagues (Vienna Center of Quantum Science and Technology) for providing the interference curves of their experimental results and F. Navarria, R. Brancaccio and A. Amorosi for

Figure 7. Calculated Talbot carpet for Tetracene molecule interference. z is the grating-substrate distance, rA is perpendicular to the grating slit axis.
the critical reading of the manuscript. We are indebted to H. Muñoz (Universidad Nacional de Colombia in Medellín) for the realization of the simulations of Figure 4. We should also like to thank a referee of JMP for suggesting improvements. This work was partially supported by the Patrimonio Autónomo Fondo Nacional de Financiamiento para la Ciencia, la Tecnología y la Innovación, Francisco José de Caldas, Colciencias Grant 111852128322, and by the Universidad Nacional de Colombia, Vicerrectoría de Investigación grants 12932 and 12934.
Cite this paper
RománCastañeda,GiorgioMatteucci,RaffaellaCapelli, (2016) Quantum Interference without Wave-Particle Duality. Journal of Modern Physics,07,375-389. doi: 10.4236/jmp.2016.74038
References
- 1. Mandel, L. and Wolf, E. (1995) Optical Coherence and Quantum Optics. Cambridge University Press, Cambridge.
http://dx.doi.org/10.1017/CBO9781139644105 - 2. Castañeda, R. (2014) Physical Review A, 89, Article ID: 013843.
http://dx.doi.org/10.1103/PhysRevA.89.013843 - 3. Philippidis, C., Dewdney, D. and Hiley, B.J. (1979) Il Nuovo Cimento B, 52, 15-28.
http://dx.doi.org/10.1007/BF02743566 - 4. Couder, Y. and Fort, E. (2006) Physical Review Letters, 97, Article ID: 154101.
http://dx.doi.org/10.1103/PhysRevLett.97.154101 - 5. Kocsis, S., Braverman, B., et al. (2011) Science, 332, 1170-1173.
http://dx.doi.org/10.1126/science.1202218 - 6. Gondran, M. and Gondran, A. (2005) American Journal of Physics, 73, 507-515.
http://dx.doi.org/10.1119/1.1858484 - 7. Sanz, A.S. and Miret-Artes, S. (2012) A Trajectory Description of Quantum Processes. II. Applications. Lecture Notes in Physics Vol. 831, Springer, Berlin.
- 8. Frabboni, S., Gabrielli, A., Gazzadi, G.C., et al. (2012) Ultramicroscopy, 116, 73-76.
http://dx.doi.org/10.1016/j.ultramic.2012.03.017 - 9. Matteucci, G., Pezzi, M., et al. (2013) European Journal of Physics, 34, 511-517.
http://dx.doi.org/10.1088/0143-0807/34/3/511 - 10. Matteucci, G. (2013) Proceedings of SPIE, 8785, 8785CF-1.
- 11. Juffmann, T., Milic, A., et al. (2012) Nature NanoTechnology, 7, 297-300.
http://dx.doi.org/10.1038/nnano.2012.34 - 12. Arndt, M., Nairz, O., et al. (1999) Nature, 401, 680-682.
http://dx.doi.org/10.1038/44348 - 13. Nalrz, O., Arndt, M., et al. (2003) American Journal of Physics, 71, 319-325.
http://dx.doi.org/10.1119/1.1531580 - 14. Juffmann, T., Truppe, S., Geyer, P., et al. (2009) Physical Review Letters, 103, Article ID: 263601.
http://dx.doi.org/10.1103/PhysRevLett.103.263601 - 15. Iannotta, S. and Toccoli, T. (2003) Journal of Polymer Science: Part B: Polymer Physics, 41, 2501-2521.
http://dx.doi.org/10.1002/polb.10644 - 16. Born, M. and Wolf, E. (1993) Principles of Optics. 6th Edition, Pergamon Press, Oxford.
- 17. Matteucci, G., Castañeda, R., et al. (2010) European Journal of Physics, 31, 347-356.
http://dx.doi.org/10.1088/0143-0807/31/2/012
Appendix 1
The conservation of the total wave energy or the total number of particles in the setup is assured by the condition
 . (A1)
From Equations (6) it follows

so that
 (A2)
(A2)
Equations (A1) and (A2) yield  and
and  for
for . This result confirms the oscillatory behavior of
  between positive and negative values, therefore,
  cannot be a physical observable in spite of its units. It justifies the term “virtual” given to the point emitters that contribute to
 .
.
Appendix 2
The experimental setup was modelled as a 1D arrangement with a random, uniform emission of single electrons in the SM-stage so that,  within the effective source area of size a and equals to zero otherwise.
Furthermore,  and
and  hold at SP. Consequently, Equations (2) and (4) give
 (A3)
(A3)
and
 (A4)
(A4)
respectively, where z' is the axial length of the SM-stage. By assuming that the rms-error between the exact calculation and the paraxial approach for our setup configuration is smaller than 0.5% and by restricting the simulation in the paraxial Fraunhofer domain [16] , Equation (A4) is well-approximated as
 (A5)
(A5)
at MP. It means that the Young mask is uniformly illuminated. In addition,

holds in the SM-stage, so that the two-point correlation at MP is given by
 (A6)
(A6)
![]() and
and ![]() characterize the conditions under which single electrons from the effective source cross the mask at MP. Fraunhofer paraxial approach was also used in MD-stage. From Equations (7) and (8) it follows
characterize the conditions under which single electrons from the effective source cross the mask at MP. Fraunhofer paraxial approach was also used in MD-stage. From Equations (7) and (8) it follows
![]() (A7)
(A7)
for the physical observable at DP.
Appendix 3
We used a Philips EM400 transmission electron microscope (TEM) equipped with a hair-pin filament source operating at 60 keV, giving an electron momentum p = 1.36 × 10⁻²² kg∙m∙s−1. In standard operating conditions, the average distance between consecutive electrons is of the order of 1cm so that, as a reasonable approximation, electrons go through a 30 nm thin film sample one at a time [8] . In our experiment, the electron source temperature was reduced and the condenser lenses were strongly excited to obtain a beam even weaker than that used to record, with the same TEM, the build-up of two-slit single electron interference patterns [8] [9] . In these conditions an effective source with variable size, corresponding to an illumination divergence of about 10−5 rad, was obtained [17] . A commercially available carbon replica, with Au/Pd shadowing, of a diffraction line grating (spacing 462.9 nm) was inserted at the standard specimen level, at a distance of about 5 cm from the effective source. An electron-optical arrangement, referred to as low angle diffraction mode, was adopted [8] [9] . The objective lens was weakly excited to project the Fraunhofer interference pattern onto the selected area of the aperture plane. The remaining lenses of the TEM provided an enlargement of this pattern onto a photographic plate (exposure time 150 s.). In these conditions the electron microscope works as a diffraction camera of length 81 meters. Using the same theoretical framework discussed in Appendix 2, the physical observable interference pattern after a great enough number of single electron arrivals is now modelled as
![]() (A8)
(A8)
by assuming the grating with ![]() (M = 10) identical and regularly spaced slits. For this experiment, the transmission function of the grating slits was modelled using a Gaussian distribution in order to achieve the best agreement with the experimental data.
(M = 10) identical and regularly spaced slits. For this experiment, the transmission function of the grating slits was modelled using a Gaussian distribution in order to achieve the best agreement with the experimental data. ![]() is an adjustment parameter to fit the diffraction envelope which modulates the observed interference peaks.
is an adjustment parameter to fit the diffraction envelope which modulates the observed interference peaks.
Simulations were carried out under different correlation conditions (Figure A1), controlled by the effective source size a in the sinc-function. The optimal fit to the experimental pattern in Figure 5 is achieved by the profile b, produced by an effective electron source of 130 nm width, whose lateral coherence distance or correlation width is 3.75 mm. So, a grating of 21 slits with spacing 463 nm accurately reproduces the observed interference patterns. If the number of slits increases in the simulation, only the peak heights increase but the profile morphology remains invariant.
As expected, the profiles show the decrease of the correlation width with the increase of the effective source size. Consequently, the interference fringe contrast is reduced, and a broadening of the maximum angular widths takes place, while the maximum and minimum positions are unaffected. These results show how closely the experimental images can be interpreted by introducing only few approximations for the overall working conditions of the microscope setting. Calculations were implemented by using the conventional Mathematica® platform. They can be also performed in Mathlab®.
Appendix 4
The red, solid line curves in Figure 6(a) and Figure 6(b) were calculated by assuming ![]() for the collimating slit at SP and the grating slits at MP, in the SM-stage. With these entries, the two-point correlation and
for the collimating slit at SP and the grating slits at MP, in the SM-stage. With these entries, the two-point correlation and
![]()
Figure A1. Simulated profiles for the grating interference experiment with single electrons under different two-point correlation conditions.
the molecule density at MP are calculated in a similar way to the one used in the single electron experiment.
The molecule density at DP for a large number of molecules is given by
![]() (A9)
(A9)
as the physical observable molecule density at DP after a great number of single molecule arrivals.
To obtain the redsolid profiles in Figure 6(c) and Figure 6(d) a Gaussian modulation of the transmission function is considered for the collimating slit at SP and the grating slits at MP, in the SM-stage. Instead of a sinc-function as in Equation (A9), the two-point correlation is now proportional to the Gaussian
![]() with
with ![]() the adjustment parameter that optimizes the fit of the predicted profile to the
the adjustment parameter that optimizes the fit of the predicted profile to the
experimental results. The physical observable molecule density at DP after a great number of single molecule arrivals is given now by
![]() (A10)
(A10)
In order to reproduce the interference profiles of Figure 6 different molecular velocities have been taken into account [11] . To facilitate the comparison of the results of our model with the data reported in [11] , we indicate the molecule velocity dispersions in terms of de Broglie wavelength. The range of wavelengths is, 1) 4 pm ≤ λ ≤ 6 pm with the higher weight ascribed to λ = 5.1 pm, Figure 6(a) and Figure 6(c), and 2) 2 pm ≤ λ ≤ 3 pm, centred at λ = 2.1 pm, Figure 6(b) and Figure 6(d). The de Broglie wavelengths and weight factors (WF) to obtain the best fit are listed in Table 1.

Table 1. De Broglie wavelengths and best fit weight factors (WF) used for the simulations reported in Figure 5.
Appendix 5
An important question is to define the size of the structured supports of spatial coherence due to different distributions of real point emitters. It is not trivial to establish analytically because of the non-linearity of the expansion kernel of Equation (2), defined in Equation (3). However, the numerical analysis of the behavior of a given correlation cone in the volume delimited by IP and OP, Figure 1, can be generalized to any correlation cone to give us the criterion to determine the size of the structured supports. For simplicity and without lack of generality, let us consider, 1) a single real point emitter of particles placed at![]() , 2) linear arrays of N identical real point emitters of particles, of momentum p = 1.36 × 10⁻²² kg∙m∙s−1, centered at
, 2) linear arrays of N identical real point emitters of particles, of momentum p = 1.36 × 10⁻²² kg∙m∙s−1, centered at ![]() and regularly distributed with period b. With these two types of effective sources, the correlation cone with basis (the structured support of spatial coherence) centred at
and regularly distributed with period b. With these two types of effective sources, the correlation cone with basis (the structured support of spatial coherence) centred at ![]() is calculated. According to Equations (2) and (3), the single real point emitter provides the correlation cone given by
is calculated. According to Equations (2) and (3), the single real point emitter provides the correlation cone given by
![]() (A11)
(A11)
while the correlation cone of the linear array of emitters takes the form
![]() (A12)
(A12)
Figure A2 compares the profiles of the normalized ![]() at OP placed at a distance z = 104 μm from IP, for the single real point emitter and the arrays under the two extreme conditions of spatially coherence and incoherence, respectively. Any partially coherence situation should be contained between these two extremes of spatial coherence.
at OP placed at a distance z = 104 μm from IP, for the single real point emitter and the arrays under the two extreme conditions of spatially coherence and incoherence, respectively. Any partially coherence situation should be contained between these two extremes of spatial coherence.
Although the profiles were calculated for![]() , the same ones were also obtained centred at points
, the same ones were also obtained centred at points ![]() in the regions
in the regions ![]() for spatially coherent sources and
for spatially coherent sources and ![]() for spatially incoherent sources. Therefore, there are correlation cones with the same geometry whose bases (i.e. the structured supports of spatial coherence) are centred at the points rA in such regions. Outside these regions, the geometry of the profiles change but the physical description above remains valid.
for spatially incoherent sources. Therefore, there are correlation cones with the same geometry whose bases (i.e. the structured supports of spatial coherence) are centred at the points rA in such regions. Outside these regions, the geometry of the profiles change but the physical description above remains valid.
In analogy with optics, the cross-section inscribed by the central maximum (i.e. delimited by the first zeroes of ![]() at OP), determines the structured support on OP. However, in case of a source consisting of a single point emitter, the cross-section of the correlation cone is Lorentzian-like at any axial position z, Figure A3(a), so that the structured support cannot be bounded by zeroes. Nevertheless, taking into account that this profile decreases monotonically to zero from the main maximum, a criterion is proposed to establish the structured support dimension. Accordingly, a decay of 95% of the Lorentzian-like profile is selected which subtends the structured support cross-section larger than 90%. Very close to IP, the structured support size grows linearly along the z-axis as represented by the dotted lines, Figure A3(a). These lines determine an angle, at the cone vertex, of about 70˚ which corresponds to a numerical aperture of about 0.94 (for particles moving in free space).
at OP), determines the structured support on OP. However, in case of a source consisting of a single point emitter, the cross-section of the correlation cone is Lorentzian-like at any axial position z, Figure A3(a), so that the structured support cannot be bounded by zeroes. Nevertheless, taking into account that this profile decreases monotonically to zero from the main maximum, a criterion is proposed to establish the structured support dimension. Accordingly, a decay of 95% of the Lorentzian-like profile is selected which subtends the structured support cross-section larger than 90%. Very close to IP, the structured support size grows linearly along the z-axis as represented by the dotted lines, Figure A3(a). These lines determine an angle, at the cone vertex, of about 70˚ which corresponds to a numerical aperture of about 0.94 (for particles moving in free space).
![]()
Figure A2. Profiles of normalized ![]() at z = 104 μm provided by linear arrays of N real point emitters of particles of momentum p = 1.36 × 10⁻²² kg∙m∙s−1 and different lengths L. Profiles were obtained at the regions of OP denoted by
at z = 104 μm provided by linear arrays of N real point emitters of particles of momentum p = 1.36 × 10⁻²² kg∙m∙s−1 and different lengths L. Profiles were obtained at the regions of OP denoted by![]() .
.
![]()
Figure A3. Correlation cones provided by (a) a single real point emitter and, (b) a linear array of real point emitters. Particle momentum, p = 1.36 × 10⁻²² kg∙m∙s−1. Dotted lines bound the correlation cone of the single real point emitter while the correlation cone of the array is bounded by the central maximum of the graph. Figures were enhanced for presentation purposes.
According to Figure A3(a), at a distance of 1.2 nm from a point emitter, the structured support diameter is 8 nm.
A real point emitter provides a structured support larger than those obtainable with a linear array of point sources. The longer the effective source the smaller the structured support results. As shown in Figure A3(b), the correlation cones, provided by arrays with N > 1, exhibit a central maximum and lateral lobes whose maxima decays monotonically. In this case the structured support of spatial coherence is defined as the cross-section subtended by the central maximum of the correlation cone. It turns out that, at a distance of 1.2 nm from a linear array of 11 point emitters, the structured support diameter results 0.4 nm, i.e. 20 times smaller than the structured support size of a single point emitter.
In accordance to the profiles in Figure A2, the correlation cones for the cases of spatially coherence and partially coherence are narrower than the cone in Figure A3(a) but wider than the cone in Figure A3(b). Thus, the validity of the analysis above is general, in spite of the particular considered cases.
NOTES
![]()
*Corresponding author.