Advances in Bioscience and Biotechnology
Vol.1 No.1(2010), Article ID:1584,14 pages DOI:10.4236/abb.2010.11003
On the orientation of plane tensegrity cytoskeletons underbiaxial substrate stretching
![]()
Department of Mechanics, Faculty of Applied Mathematical and Physical Sciences, National Technical University of Athens, Athens, Greece.
Email: kolazop@mail.ntua.gr
Received 12 February 2010; revised 26 February 2010; accepted 6 March 2010.
Keywords: Tensegrity; Cytoskeleton; Adherent Cells; Reorientation; Stability; Coexistence of Phases
ABSTRACT
Two different simple cases of plane tensegrity cytoskeleton geometries are presented and investigated in terms of stability. The tensegrity frames are used to model adherent cell cytoskeletal behaviour under the application of plane substrate stretching and describe thoroughly the experimentally observed reorientation phenomenon. Both models comprise two elastic bars (microtubules), four elastic strings (actin filaments) and are attached on an elastic substrate. In the absence of external loading shape stability of the cytoskeleton is dominated by its prestress. Upon application of external loading, the cytoskeleton is reorganized in a new direction such that its total potential energy is rendered a global minimum. Considering linear constitutive relations, yet large deformations, it is revealed that the reorientation phenomenon can be successfully treated as a problem of mathematical stability. It is found that apart from the magnitude of contractile prestress and the magnitude of extracellular stretching, the reorientation is strongly shape–dependent as well. Numerical applications not only justify laboratory data reported in literature but such experimental evidence as the concurrent appearance of two distinct and symmetric directions of orientation, indicating the cellular coexistence of phases phenomenon, are clearly detected and incorporated in the proposed mathematical treatment.
1. INTRODUCTION
Active adherent cells alter their orientation direction, defined by their long axis, in response to substrate stretching. In absence of external strain field cells appear with random orientation; yet, the application of extracellular strain results to a concerted reorganization of the components of the cytoskeleton (CSK) in the new direction. The CSK is the intracellular network that consists of different types of biopolymers such as actin and intermediate microfilaments, microtubules, myosin and other filaments, and acts concurrently as a supporting frame and chief regulator of cell deformability. Constant remodelling of the CSK directly affects almost all functions of living cells like growth, differentiation, mitosis, apoptosis, motility, cell locomotion, etc. ([1] and references therein). In the case of cells adherent to an elastic substrate, the actin CSK disassembles and reassembles under stretching of the substrate in order to mechanically stabilize the cell by means of the so-called intracellular contractile mechanism, that is, the generation of tensile forces in the actin filaments by myosin motor proteins through the ATP-driven process of myosin crossbridge cycling. Experimental observations report that the direction of cellular orientation is primarily governed by the magnitude of the extracellular strain field and the strength of the contractile mechanism [2-5]. Depending on these agents, cells have been observed to align either with the direction of the maximum extracellular stretch component [6-9], or perpendicular to it [2-5,10-15]. Specifically, under the effect of static or quasi–static substrate stretch cells orient parallel to the direction of maximum stretch [6,7,9], whereas in response to dynamic stretching they align perpendicularly to the direction of maximum stretch [2-5,10-15]. However, there also exists a special case of cellular orientation behaviour; independent experiments have confirmed the discovery that under the same substrate stretching such a configuration is possible that two distinct orientation directions (phases) of the cells coexist [3,5].
In the present study the cellular orientation phenomenon is addressed by employing two simple mechanical models belonging to a family of structural systems known as tensegrity. Tensegrities are reticulated structures forming a highly geometric combination of bars and strings in space. In fact, tensegrity is a portmanteau word for “tension-integrity” referring to the integrity of structures as being based in a synergy between balanced continuous tension (elastic strings) and discontinuous compression (elastic bars) components. Pre–existing tensile stress in the string members, termed prestress, is required even before the application of any external loading in order to maintain structural stability. There already exists extensive literature regarding the advanced mathematics and mechanics used for the integral description of these structures [16-20], as well as the successful identification of the principles of tensegrity architecture to cytoskeletal biomechanics [21-24]. In fact, some of the characteristic mechanical properties of the CSK were initially predicted by the cellular tensegrity model and were later verified in laboratory experiments as such [21,24].
Since reorganization of the CSK is observed at high extracellular strains (of the order 10%–110%), Finite Elasticity principles and methods will be followed. Adopting Maxwell’s convention for stability [25,26], two different planar tensegrity CSK geometries are introduced and the stability of their orientation directions under the application of biaxial substrate stretching is studied. As it is the case for their biological counterparts, under the effect of stretching, the planar tensegrity models are considered to deform and reorient in a new direction. In concert to Maxwell’s convention, it is assumed that this new orientation direction, out of all the available ones, renders the total potential energy function of the given tensegrity CSK model a global minimum. Recently, the same analytical methodology presented in this study was used to theoretically investigate the problem of stress fibre reorientation under both static and cyclic substrate stretching [27-29]. The current treatment is an extension of the previous work to the cellular scale, and enhances further the former effort that had not focused on the intracellular microstructure but considered the cell as a generalized Mooney–Rivlin elastic material [30]. The properties of the plane tensegrity models are discussed in detail in the next sections. However, it is pointed out that in the following and in terms of cell physiology, elastic string members correspond to actin microfilaments, elastic bar members correspond to microtubules and the tensegrity frames are anchored on the elastic substrate through their vertices, representing focal adhesions complexes on the extracellular matrix.
2. THE PLANE TENSEGRITY CYTOSKELETON MODELS
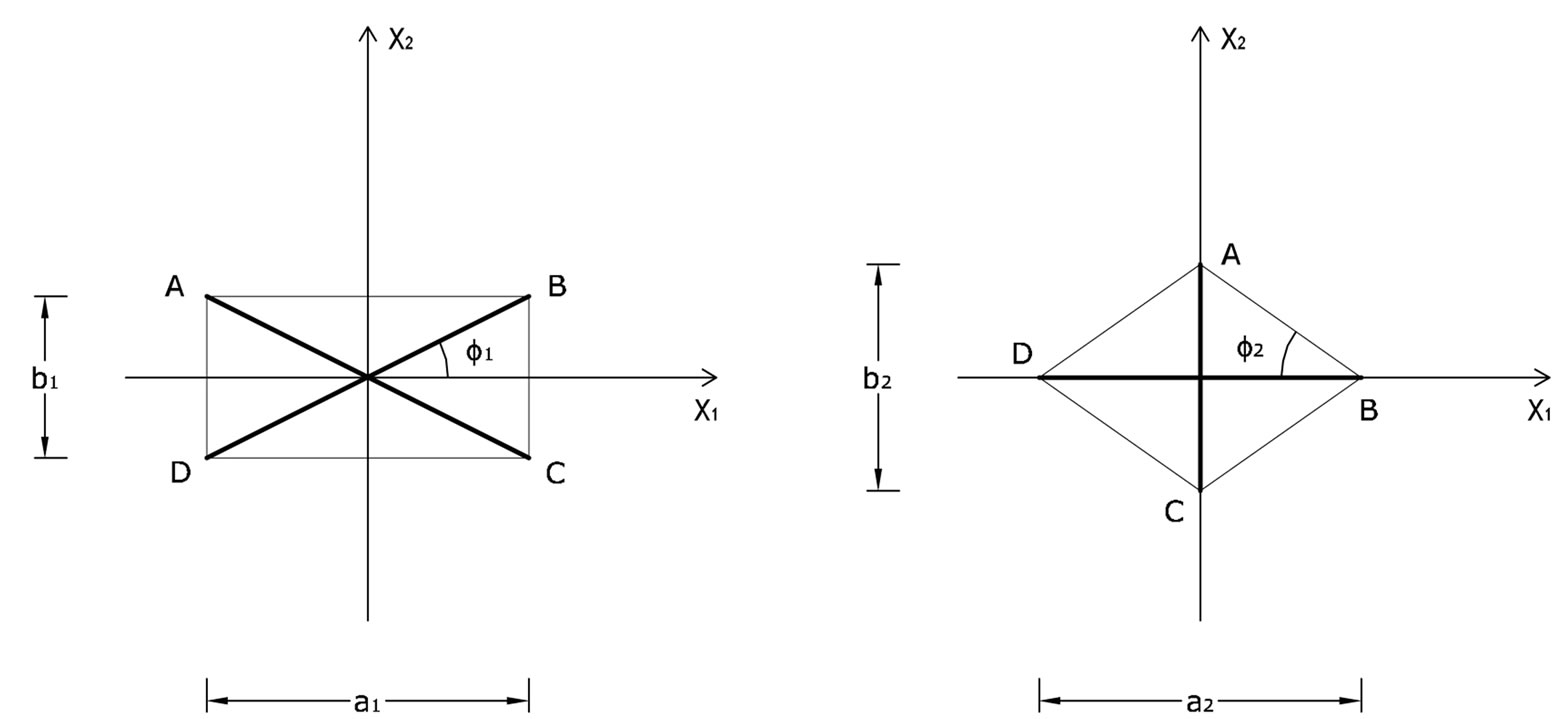
For the theoretical description of the reorientation phenomenon the CSK is modelled by two independent planar tensegrity frames of rectangular and rhombic shaperespectively (Figure 1). Both frames comprise four elastic strings and two elastic bars (not joint at their intersection) and are attached upon an elastic substrate through their vertices. It is apparent from Figure 1 that the strings occupy the sides of the models while the bars are identified with the diagonals. In accordance to cellular physiology, the cross–section area of the bars is considered to be eight (8) times that of the strings [21,31], the elastic moduli of all members (both strings and bars) are assumed to be the same [21,31], and their constitutive equations are considered to be linear [21,31]. Albeit, nonlinear behaviour of the system may still be exhibited; it has been shown that it is mainly a result of geometrical rearrangement of the structural members under the effect of external loading, rather than intrinsic nonlinearity of the members themselves [32]. Further, in the initial configuration where no stretch is applied, it is assumed that all string members acquire the same prestrain due to the existing myosin–actin contractility motor systems. The prestrain of the strings is equilibrated entirely through reaction forces applied by the substrate at the vertices of the tensegrity model. Thus, the bars are considered to be initially unstressed. Finally, in the initial configuration, the origin of an orthogonal Cartesian coordinate system  is defined to coincide with the geometric centre of the models, while their long axis is originally aligned with the
  axis of the coordinate system (Figure 1).
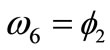
In absence of extracellular strain field the shape stability of the models is controlled by prestrain. Next, biaxial substrate stretching is applied in the directions defined by the angles  and (
and ( ), cf. Figure 2. As mentioned above, due to the increased strain in the substrate the models deform and reorient to a new (current) orientation direction (Figure 3). The current direction is the one, out of all available orientation directions, that corresponds to the global minimum of the total potential energy of the models.
2.1. The Rectangular Model
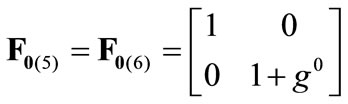
The initial configuration of the rectangular tensegrity CSK model (henceforth simply rectangular model) is illustrated in Figure 1(a). Assigning the index values: i = 1, 2 to the bars (AC) and (BD), i = 3, 4 to the strings (AB) and (CD) with initial length a1, i = 5, 6 to the strings (BC) και (DA) with initial length b1, and taking advantage of the model geometry, the initial deformation of every structural member due to prestrain is described by the deformation gradient tensors , in the fashion:
 (1)
(1)
 (2)
(2)
 (a) (b)
Figure 1. The initial prestrained placement of the: (a) rectangular plane tensegrity cytoskeleton; (b) rhombic plane tensegrity cytoskeleton.
 (3)
(3)
where ,
,  , is the initial homogeneous displacement and its gradient (prestrain) along the string members, respectively, while the
  identity matrix 1 in Eq.1 expresses the fact that at the initial configuration the bars are considered to be undeformed.
The deformation gradient of the biaxial substrate stretching with reference to the axis  of the maximum and minimum extracellular normal strain, respectively (Figure 2), is given as:
 , (4)
, (4)
where ,
,  , with
 , are the displacement gradients along the directions
  and
and , and:
 , (5)
, (5)
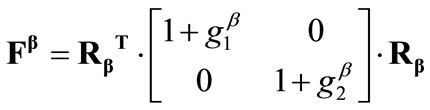
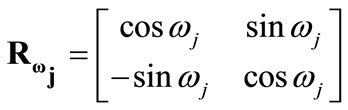
is the rotation matrix of the coordinate system by the angle . The superscript
  denotes the transpose matrix. The total deformation gradient of every member of the rectangular model as a result of the superposition of prestrain and biaxial substrate stretching is expressed through the product of the respective deformation gradient tensors as:
 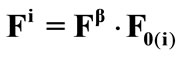 for
for .
.
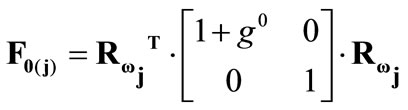
The model responds to the increase of the substrate strain field by altering its initial configuration. Consequently, the reference placement has changed; in fact, it has been rotated through an angle  (Figure 3(a)). In the
  direction the deformation gradient tensor of each member of the rectangular model due to prestrain is given as:
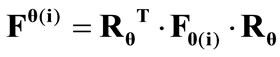 , where the rotation matrix
  is defined in the same fashion as
 . The total deformation in the
  direction as a result of biaxial substrate stretching and prestrain is expressed through the tensors:
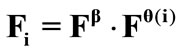 . Now, if we call
  the deformed length of the initial length
  along the given member of the rectangular model, its displacement gradient is expressed in the form:
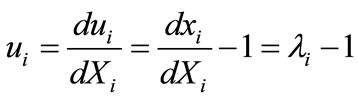 , (6)
, (6)
for , where
 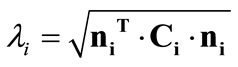 is the stretch,
 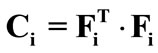 is the right Cauchy–Green tensor [33,34], and:
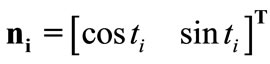 (7)
(7)
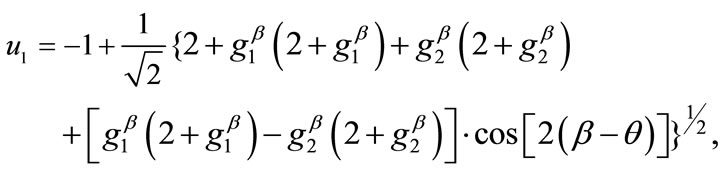
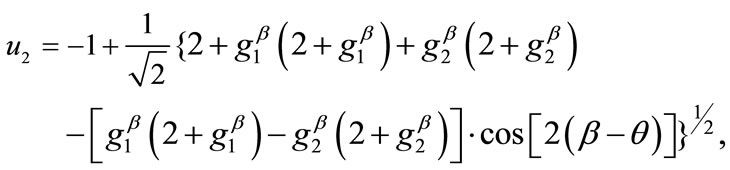
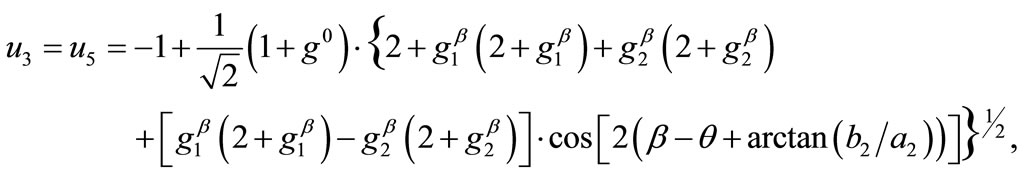
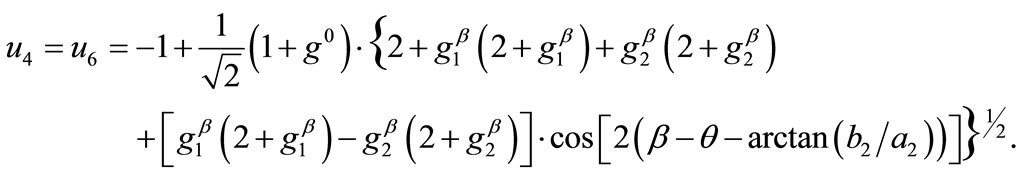
is the unit vector along the direction of each member in the new (reoriented) configuration. Specifically, defining the angle , see Figure 1(a), it follows that in the reoriented configuration for
  to
to :
: ,
,  ,
,  ,
,  , respectively. Hence, the analytical expressions for the displacement gradient along each member of the rectangular model are given in the form:
 (8)
(8)
 (9)
(9)
 (10)
(10)
 (11)
(11)
2.2. The Rhombic Model
The initial configuration of the rhombic tensegrity CSK model (henceforth simply rhombic model) is illustrated in Figure 1(b). The deformation analysis of the model follows the exact same steps as in the previous section. Thus, we assign the index values:  to the bar
  with initial length
 ,
,  to the bar
  with initial length
 , and
, and  to
to  to the strings
 ,
,  ,
,  ,
,  , respectively, that constitute the rhombic model perimeter. The initial deformation of each member due to prestrain is described in terms of the deformation gradient tensors
  as:
as:
 (12)
(12)
 ,(13)
,(13)
with ,
,
where  is the initial homogeneous displacement gradient (prestrain) along the strings,
  is the
  identity matrix expressing, again, the fact that at the initial configuration the bars are considered to be undeformed, and
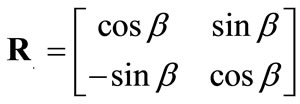
  is the rotation matrix with explicit form:
 (14)
(14)
Defining the angle , see Figure 1(b), from the rhombic model geometry follows that for
  to
to :
: ,
,  ,
,  ,
,  ,
,
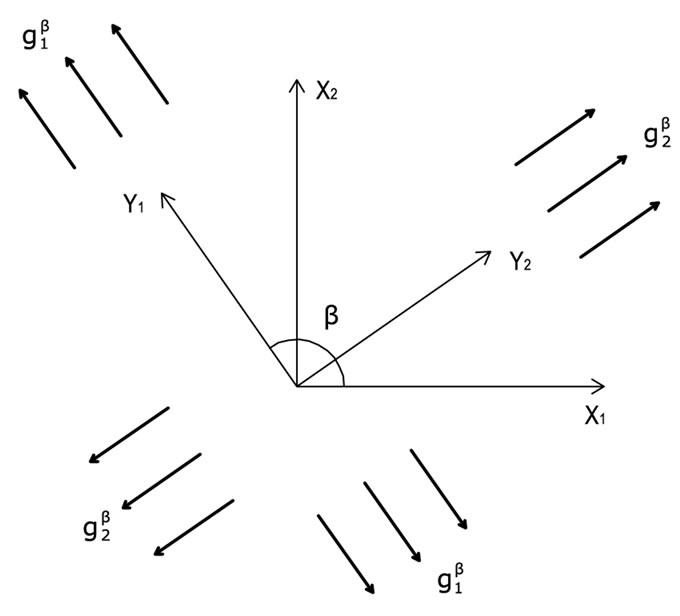
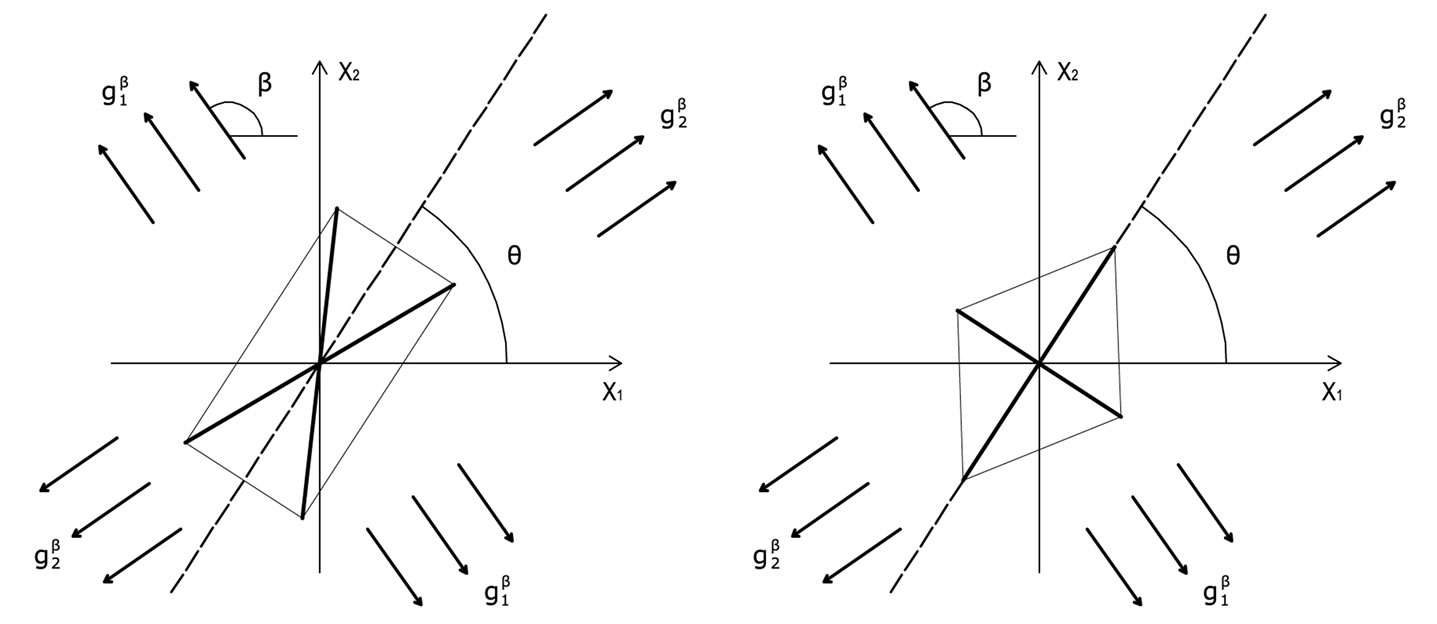
Figure 2. The geometry of the biaxial substrate stretching and its coordinate system.
respectively.
The deformation gradient of the biaxial substrate stretching is provided again from Eq.4. The total deformation gradient of the members of the rhombic model, as a result of prestrain and the strain field of the substrate, is given through the product of the respective deformation gradient tensors as:  with
with . In response to the increased strain the initial configuration of the model is changed to the new direction
 . In the
  direction the deformation gradient tensor of each member of the rhombic model due to prestrain is given as:
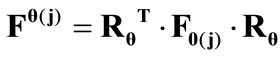 . Hence, the total deformation in the
  direction due to prestrain and the superimposed biaxial substrate stretching is expressed through the tensors:
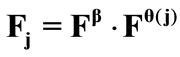 . Now, the displace-
 (a) (b)
Figure 3. The geometry of the reoriented plane tensegrity cytoskeletons. (a) the rectangular case; (b) the rhombic case.
ment gradient along each member of the model is given from Eqs.6 and 7, after the apparent interchange between indexes  and
and . Specifically, for the unit vector
  along the direction of each member in the new configuration (Figure 3(b)), follows that for
  to
to :
: ,
,  ,
,  ,
,  ,
,  ,
,  , respectively. Now, the analytical expressions for the displacement gradients of the rhombic model members are formulated as:
 (15)
(15)
 (16)
(16)
 (17)
(17)
 (18)
(18)
3. EQUILIBRIUM OF THE PLANE TENSEGRITY CSK MODELS
For the reasons of physiological compatibility mentioned in Section 2, it is assumed for both model geometries that the constitutive equations of all members are linear. Thus, the strain energy density per unit length function for each member may be written as:
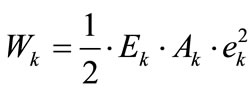 (19)
(19)
with ,
,
where  is the Young modulus,
  is the cross–sectional area, and:
 (20)
(20)
is the nonlinear Lagrangian strain. Again for the physiological reasons of Section 2—and recalling that index i corresponds to the rectangular model, whereas index j to the rhombic—it is considered that  for
for  to 6,
to 6,  for
for  (bars), and
  for
for  to 6 (strings). With no harm of the generality, in what follows it is assumed that
  and
and . Evidently, the strain energy density, through the Lagrangian strain of Eq.20, may be expressed as a function of the displacement gradient
 . Then, the total potential energy of each model is written as:
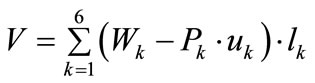 (21)
(21)
where 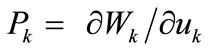 is the first Piola–Kirchhoff stress along each member, and
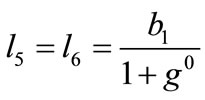
  is its natural (unstressed) length. In the case of the rectangular model
 , from the geometry of the initial configuration, Figure 1(a), follows that:
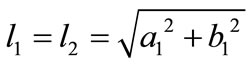 ,(22)
,(22) 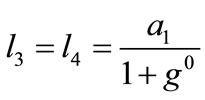 ,
, 
whereas for the rhombic model , from Figure 1(b):
 ,(23)
,(23)  ,
,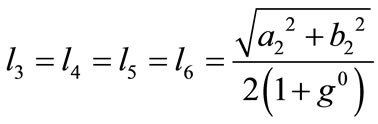 .
.
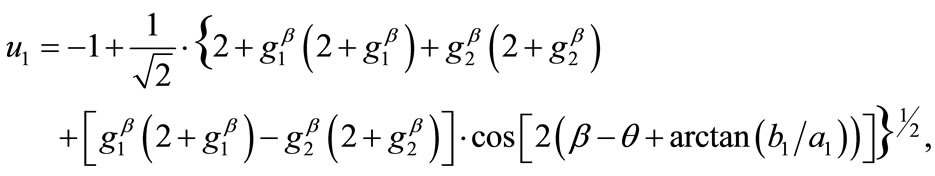
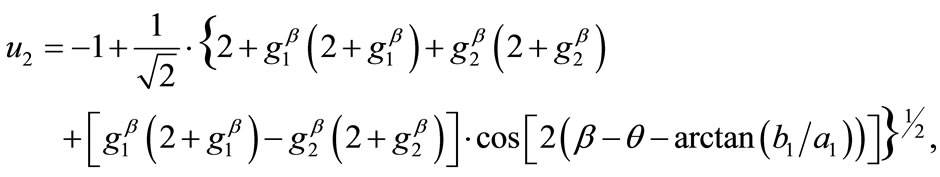
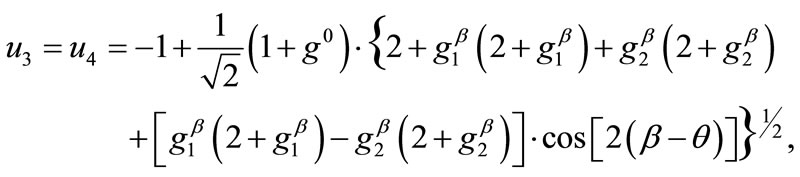
The combination of Eqs.8 to 11, 19 for , and Eq.22 yields the analytical expression of the total potential energy density function of the rectangular model. Similarly, the combination of Eqs.15 to 18, 19 for
 , and Eq.23 yields the analytical expression of the total potential energy density function of the rhombic model. The explicit form of both functions is not given here due to their large representations; albeit, in compact form they are expressed as:
 (24)
(24)
where ,
,  , for the rectangular model, and
 ,
,  , for the rhombic model. Furthermore, it should be stressed that after some elementary algebraic manipulation and factorization, the potential energy functions show a very strong dependence on the ratio
  rather than on the individual lengths themselves. It is straightforward that the value of this ratio directly controls the shape geometry of the two plane tensegrity models. Assuming that
 , as already implied in Figure 1, from the geometrical point of view, low ratio values correspond to elongated tensegrity frames, whereas at the limiting case where the ratio assumes the value equal to unity the shape of the frames degenerates to exactly square. As it will become evident in the following, the value of the elongation ratio
  (henceforth simply ER) strongly affects the orientation direction of the models.
Finally, the stable equilibrium directions are detected from the minimization of the total potential energy of both models, i.e., when the following two conditions are met simultaneously:
 (a) and
  (b) (25)
4. GLOBALLY STABLE EQUILIBRIUM DIRECTIONS OF THE PLANE TENSEGRITY CSK MODELS
It is evident that there exists a number of equilibrium directions for the plane tensegrity models that emerge as solutions to Eq.25(a); among them, the ones that additionally satisfy Eq.25(b) are stable. The investigation of the stability of the equilibrium requires the definition and adoption of the appropriate explicit stability criteria for the given problem. The orientation of active adherent cells, or even of stress fibres within them, is experimentally established to be one of the natural phenomena that exhibit coexistence of phases. Here, coexistence of phases is translated to the emergence of two distinct and concurrent orientation directions in a two–dimensional culture of cells or stress fibres, under the application of the same substrate stretching [3,5]. This kind of behaviour can be met at many different fields of the physical sciences, e.g., the melting of ice, or the coexistence of crystallographic systems in solids [35,36]. In order that our present framework is compatible to this behaviour, we adopt Maxwell’s convention for stability which allows coexistence of phases phenomena and declares that the system state is such that globally minimizes the potential [25]. In this context, the fundamental physical reasoning behind cellular reorientation is that when the strain field under the substrate anchored CSK changes, the orientation direction that renders the total potential energy minimum, with respect to all equilibrium directions , will be chosen. Accordingly, under the application of substrate stretching, the plane tensegrity models will equilibrate at such a placement where their total potential energy value is a global minimum.
For the integral study of the reorientation phenomenon, the mechanical response of both tensegrity frame geometries will be examined for a broad range of the problem parameters. The general outline is sketched through numerical inspection of the stability of the equilibrium solutions of Eqs.25. To this end, a series of graphs is produced that illustrate the variation of the total potential energy density function of each model with respect to the orientation direction . Specifically, for a given set of the parameters (
 ,
,  ,
,  ,
, ) the potential energy is plotted for selected, increasing values of the ER until its maximum value equal to unity. In this fashion, the differences in mechanical behaviour between the two shape geometries, and between more or less elongated frames of the same geometry, are both successfully detected. Moreover, comparison between graphs that correspond to the same ER value, yet different substrate stretching or prestrain conditions, allows the interpretation of the individual parameter effect on the stability of the orientation direction and on the control of the phenomenon in general. Finally, in this way, the direct cross–examination between experimental data and theoretical predictions is also possible.
4.1. Globally Stable Equilibrium Directions of the Rectangular Model
The graphs comprising Figure 4 illustrate the total potential energy density as a function of the orientation direction  for the case of the rectangular model. For the reasons reported above the graphs are arranged in the following fashion. Every column corresponds to a given set of the parameters (
 ,
,  ,
,  ,
, ), and differs from the next one in the value of a single parameter. Further, for each individual column the descending graph order corresponds to discreet increasing ER values, see Figure 4. On the other hand, every individual row corresponds to the same ER value.
The graphs of the first (reference) column, Figures 4(1) to 4(8), have been produced for the set of parameter values: ,
,  ,
,  ,
,  , and outline the general behaviour of the rectangular model under biaxial substrate stretch with respect to the geometry of the frame shape. From this sequence it is deduced that for elongated rectangular frames (low ER values), relatively low prestrain and minimum stretch component values, only one global minimum exists at the direction
 ; that is, the rectangular model is reoriented and aligned with the direction of the maximum substrate stretch, see Figures 4(1) to 4(3). For intermediate ER values, i.e., moderately elongated rectangular frames, the stability character of this direction is maintained (Figures 4(4) and 4(5)). However, as ER tends to its limiting value equal to one, the
  solution is destabilized and the emergence of two new globally stable solutions is evident (Figures 4(6) to 4(8)). The direction of maximum substrate stretch,
  , evolves initially to a local, and finally to a global maximum at the square configuration of the frame. Moreover, the two new, globally stable equilibrium directions located at
  are obviously symmetric with respect to the direction of the maximum substrate stretch.
The second column graphs of Figure 4 have been produced after doubling the value of the maximum displacement gradient of the substrate ( ), while all the other parameter values are the same as in the reference column. The general behaviour of the model is essentially the same as in the previous case. It is easy to identify that rectangular models with low ER values are still aligned with the direction
  of the maximum stretch (Figures 4(9) to 4(12)). Albeit, comparison of Figures 4(5) and 4(13) reveals that now the maximum stretch direction is destabilized and the symmetric global minima appear even for intermediate ER values.
The third column graphs of Figure 4 have been produced after increasing the value of the minimum displacement gradient of the substrate to , while all the other parameter values are the same as in the reference column. Again, the same general orientation evolution of the model is observed as in the previous cases. Yet, by cross–examining the sequences of the first three columns, especially for the intermediate and high ER values (e.g., Figures 4(6), 4(14) and 4(22)), it is observed that the increase of the minimum stretch results to a delay (in terms of increasing ER value) in the destabilization of the maximum stretch direction and the consequent appearance of the two symmetric global minima at
 .
.
The same conclusions hold for the case where prestrain is the parameter increased with respect to the first column value set. For , and all the other parameter values the same as in the reference column, the fourth column graphs are produced. Comparing Figures 4(6), 4(14), 4(22), and 4(30) (that is, the sixth row of Figure 4), it is evident that high prestrain value delays the destabilization of the
  solution and favours the orientation parallel to the direction of the maximum substrate stretch, even for high ER values. However, when the rectangular model tends to its limiting configuration (ER→1), the symmetric global minima at
  appear again.
It should be pointed out that the four parameters sets reported above and used to construct the graphs of Figure 4 are representative, and were chosen in order to clearly define both the general behaviour of the model as well as the individual parameter effect on this particular behaviour. Apart from these specific sets, other possible combinations of substrate stretching and prestrain were applied on the rectangular model for an extended range of parameter values (e.g., simultaneous gradual variation); nevertheless, no deviation from the general behaviour exposed above was observed whatsoever. The stability investigation reveals that the final orientation direction depends strongly on the shape geometry of the model as expressed through the ER. Thus, upon the application of biaxial substrate stretch, for the quite elongated rectangular models (low ER values), there exists a single globally stable orientation direction parallel to the direction of the maximum substrate stretch ( ), independently of the magnitude of the stretch or prestrain. Regarding the other extreme value of the ratio
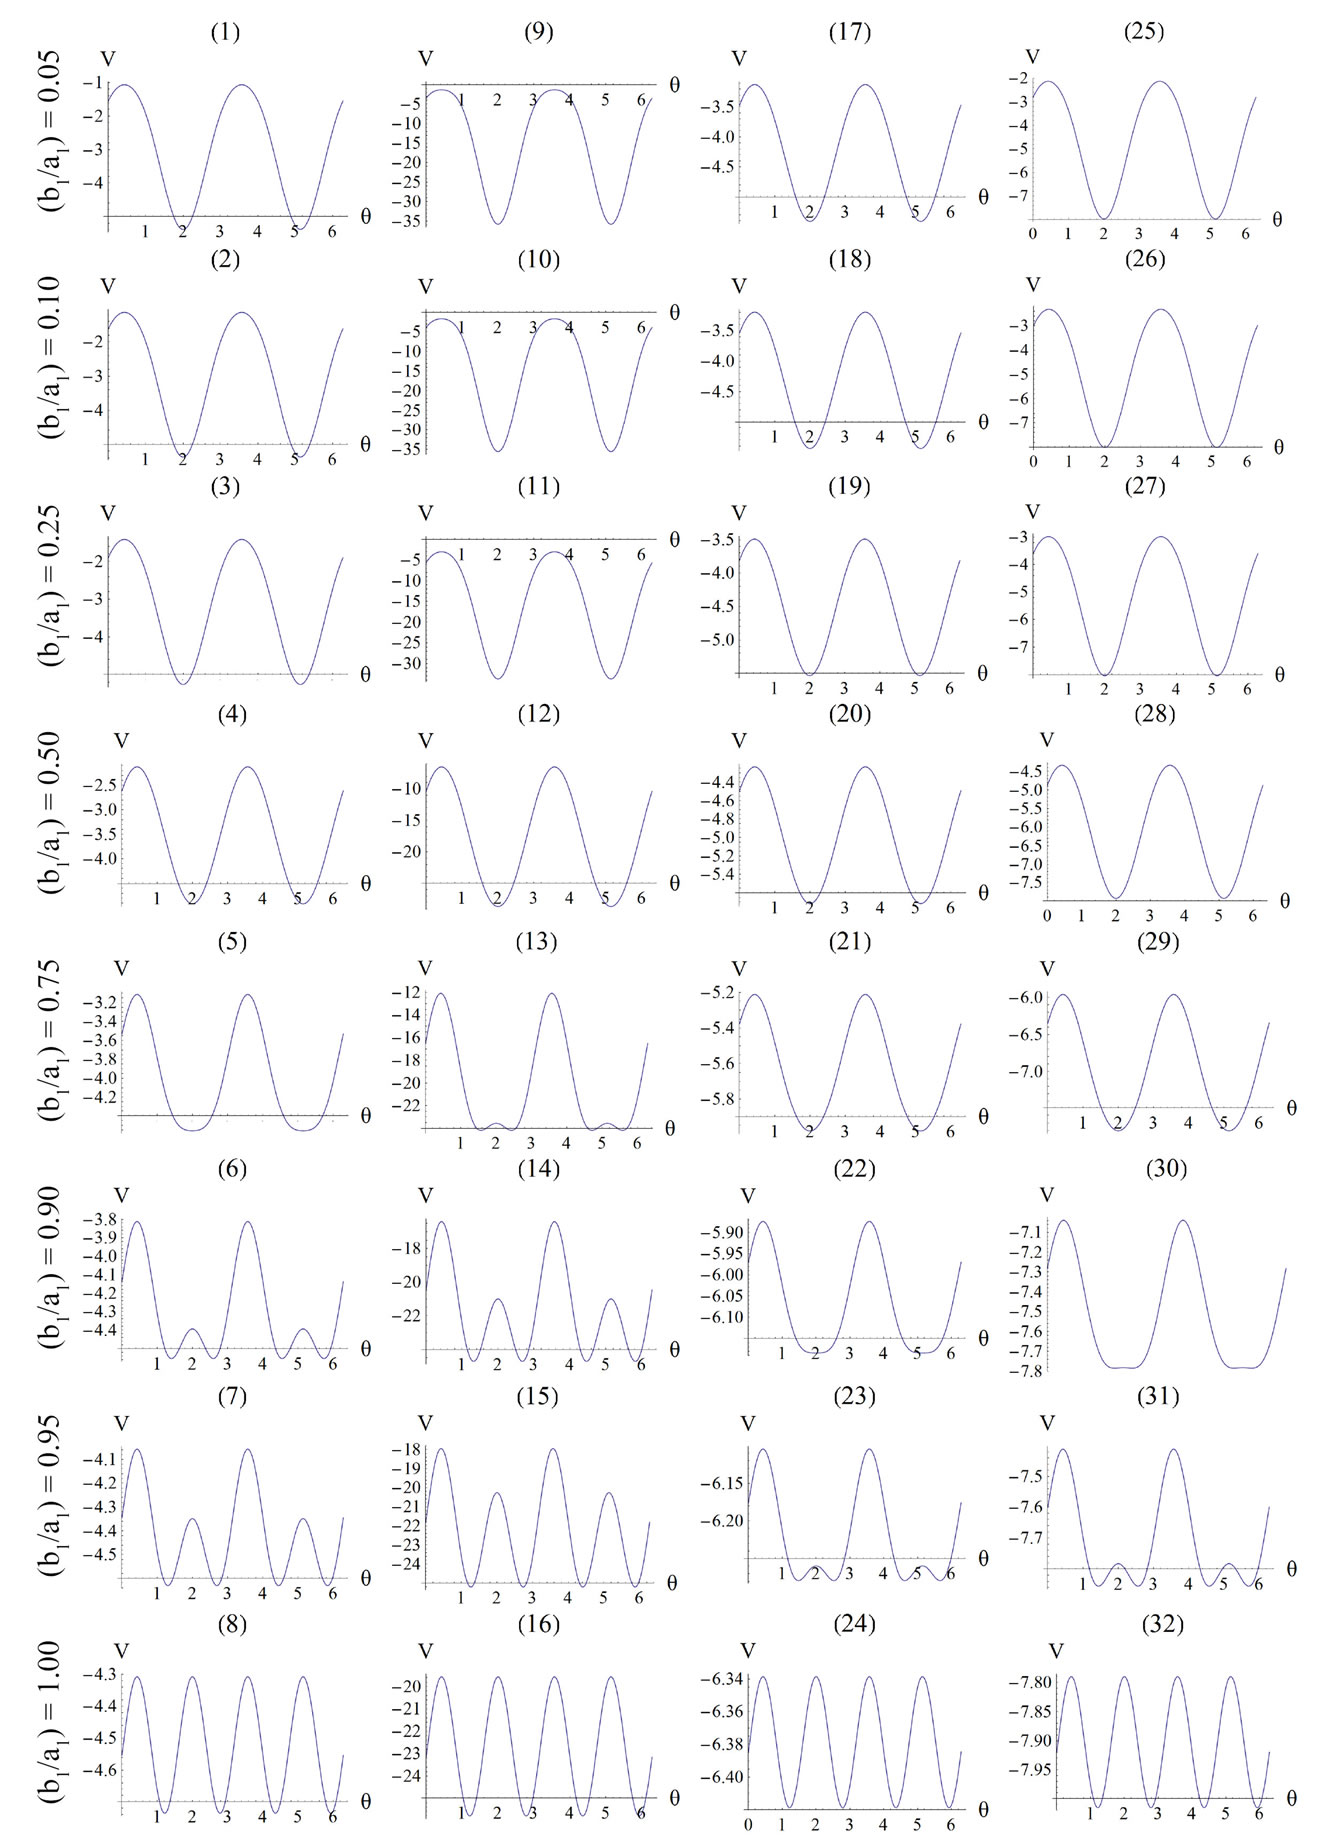
Figure 4. Graphs illustrating the variation of the total potential energy function with respect to the reorientation angle  for the rectangular tensegrity cytoskeleton. For graph parameters and thorough description see Subsection 4.1.
(ER = 1), where the rectangular frame evolves to square, there exist two globally stable orientations (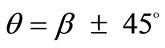 ), symmetrically arranged with respect to the direction of the maximum substrate stretch, again independently of the magnitude of the stretch or prestrain. The stability character for intermediate ER values is determined primarily by the magnitude of the maximum substrate stretch component. Initially, the direction of the maxi-
Figure 5. Graphs illustrating the variation of the total potential energy function with respect to the reorientation angle  for the rhombic tensegrity cytoskeleton. For graph parameters and thorough description see Subsection 4.2.
mum stretch  is globally stable, but as the value of
  increases, the aforementioned direction destabilizes and the new, symmetric globally stable minima emerge. On the other hand, increase of the minimum stretch or prestrain with respect to, either constant or increasing, maximum stretch, delays the destabilization and the appearance of the symmetric global minima until relatively higher ER values only when the values of
  and
and  are comparable to the value of
 . In any case, the increase of
 ,
,  , values does not prevent the destabilization from happening, and their effect is observed to diminish for high
  values. Hence, as it is concluded by the preceding analysis of the rectangular model, its stability is strongly shape dependent and it is affected by other agents as well, of which the magnitude of the maximum substrate stretch is the primary one.
4.2. Globally Stable Equilibrium Directions of the Rhombic Model
The graphs comprising Figure 5 illustrate the total potential energy density as a function of the orientation direction  for the case of the rhombic model. The arrangement of the graphs follows the same fashion as in Figure 4 (cf. Subsection 4.1 for details).
The graphs of the first (reference) column, Figure 5(1) to 5(8), have been produced for the set of parameter values: ,
,  ,
,  ,
,  , and outline the general behaviour of the rectangular model under biaxial substrate stretch with respect to the geometry of the frame shape. From this sequence it is deduced that for elongated rhombic frames (low ER values), relatively low prestrain and minimum stretch component values, only one global minimum exists at the direction
 ; that is, the rhombic model is reoriented and aligned with the direction of the maximum substrate stretch, see Figures 5(1) to 5(4). In contrast to the rectangular frame case, here, as the ER value increases, equilibrium direction
  maintains its globally stable character for the entire range of the ratio values, even for the limiting square configuration (Figures 5(5) to 5(8)). Nevertheless, increase of ER values generates the change of stability character in other
  directionssolutions. Specifically, directions
 , which initially corresponded to global maxima, Figures 5(1) to 5(4), are gradually developed to local minima, Figures 5(5) to 5(7), and at the limit case (ER = 1), their stability becomes global, Figure 5(8).
Doubling the value of the maximum displacement gradient of the substrate ( ), while keeping all the other parameter values the same as in the reference column, the second column graphs of Figure 5 are produced. The general behaviour observed above for the reference column is identically traced here as well, the only actual difference being that the stability transition of directions
  from unstable global maxima to stable local minima takes place even for intermediate ER values (compare Figures 5(4) and 5(12)).
The exact opposite case holds when the parameter values that are increased with respect to the reference column correspond to the minimum displacement gradient of the substrate (third column, ), or prestrain (fourth column,
 ). Upon comparing Figures 5(5) with 5(21) and 5(29) it is concluded that increased values of the aforementioned parameters allow the stability transition of directions
  only for high ER values.
It is pointed out once again that the parameter sets reported above for the construction of the graphs of Figure 5 are representative, in order to clearly define both the general behaviour of the rhombic frame as well as the individual parameter effect on this behaviour. Other possible combinations of parameter variation were also tested for an extended range of values, yet the frame response was essentially the same in every respect. The stability investigation for the case of the rhombic tensegrity model reveals that the dominant orientation direction strongly depends on the shape geometry also. Thus, upon the application of biaxial substrate stretch, elongated rhombic frames (low ER values) are always aligned parallel with the maximum stretch direction, which corresponds to the unique global minimum of the total potential energy, independently of the stretch or prestrain magnitudes. In the limiting configuration where the rhombus evolves into a square (ER = 1), apart from the globally stable direction , there exists concurrently a second globally stable direction at
 , that is, perpendicular to the maximum stretch direction. The stability character for the intermediate shape geometries is dominated, again, by the magnitude of the maximum stretch component. Increasing the magnitude of
  not only does not affect the globally stable character of the
  solution for any feasible ER value, but new–normal to the initial stable direction–local minima appear at formerly unstable directions. The emergence of the new minima takes place for intermediate or even low
  values provided that the magnitude of
  is sufficiently high. On the other hand, increase of the minimum stretch or prestrain with respect to, either constant or increasing, maximum stretch does not affect the stability character of the maximum stretch direction
 , and delays the emergence of the new symmetric minima until relatively higher ER values, only when
  and
and  values arecomparable to
 . In any case, the
  or
or  value increase does not prevent the emergence of the new minima and their transition from local to global. Further, the influence of
  and
and  is observed to diminish for high
  values. Consequently, it is deduced from the analysis of this section that the orientation stability of the rhombic model is strongly shape dependent, and that it is controlled secondarily by the magnitude of the
 (a) (b)
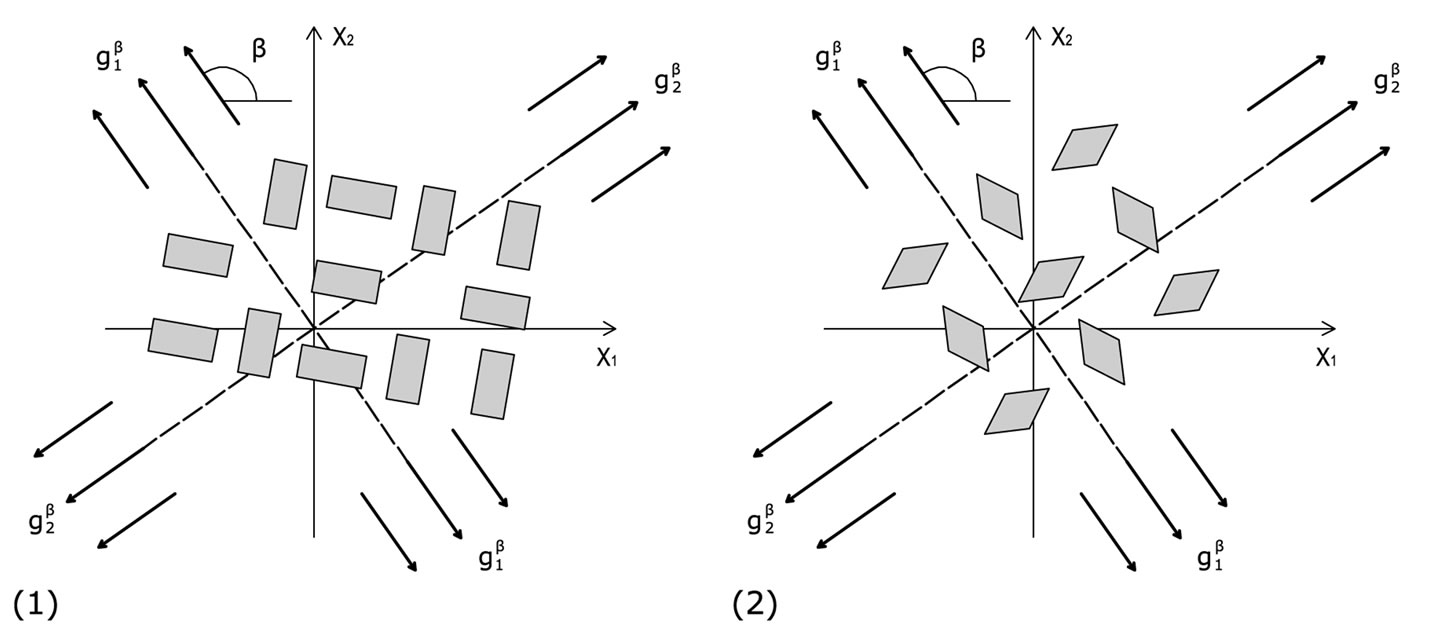
Figure 6. The cellular coexistence of phases phenomenon. (a) the rectangular cytoskeleton case; (b) the rhombic cytoskeleton case.
maximum substrate stretch.
5. DISCUSSION
Summarizing the findings of the stability investigation of both plane tensegrity models in the context of Maxwell’s convention, the following can be said. The orientation direction is defined primarily by the shape geometry of the models (ER value), and secondarily the magnitude of the maximum substrate stretch. The similar contribution that present the minimum stretch and prestrain is rather negligible and is only detected when their values are comparable to the maximum stretch component. The rectangular model, for the greatest part of the ER value range, is aligned parallel to the direction  of the maximum substrate stretch, while for the high ER or maximum stretch values it is symmetrically aligned
  away from the aforementioned direction. The rhombic model is oriented parallel to the direction of the maximum stretch for all ER values; albeit, in the liming configuration where it degenerates to a square (ER = 1), it can also align perpendicular to the
  direction. In terms of increasing ER values, the orientation of both models evolves from a single, globally stable orientation direction, to the appearance of multiple stable directions, Figure 6. In conjunction to previous studies [27,28], it should be pointed out that even though the strain energy of individual structural members of each model has been assumed to be convex, multiple stable equilibrium solutions appear here too, and the total potential energy of both models may be a non–convex function of the orientation direction. This fact affects the shape geometry the models as well.
The discords in the described above orientation evolution of the two models may be attributed both to the different initial shape geometries, and the slightly different definitions of the ER. Although ER expresses essentially the same thing for both frames, it is evident that in the case of the rectangular model it is a ratio of length of elastic strings, whereas for the rhombic model it is a ratio of length of elastic bars, Figure 1. Furthermore, in the initial configuration of the rectangular model the two bars are of the same length, while the length of the strings differs in pairs. On the other hand, in the initial configuration of the rhombic model the length of all strings is equal and of the two bars different. However, all these differences are eliminated at the limit–case , where both initial geometries degenerate to precisely square. At this special configuration, the “rectangular–square” and the “rhombic–square” identify with each other provided that either one of them is rotated by
  with respect to its geometric centre. This can be independently confirmed upon qualitative inspection and comparison of the last row graphs in Figure 4 and Figure 5. It is found that the locations of the global minima in the “rectangular–square” case coincide with the locations of the global minima in the “rhombic–square” case if either one of the plot families is translated parallel to the
 –axis by
 .
.
For the low and intermediate ER values, that correspond to physiologically more compatible cellular configurations, the stability analysis of the two models predicts orientation parallel to the direction of the maximum substrate stretch. This response is consistent to the experimental observations of the behaviour of active adherent cells cultured on an elastic substrate under the effect of static or quasi–static stretching [6-9]. For low ER values (ER→0), it is reasonable to consider that the models now represent stress fibres, rather than the entire CSK [24]. In this case, the analysis predicts alignment with the direction of the maximum substrate stretch, again, in concert to the experimental observations for static stretch [6,8,14]. Further, according to the performed stability analysis, for a certain range of parameter values the concurrent existence of more than one orientation directions is possible, Figure 6, a fact that has also been certified experimentally (cellular coexistence of phases phenomenon) [3,5]. In the case of the rectangular model, increase of the maximum substrate stretch value results to alignment away from the direction of maximum stretch. The same response to stretch increase is observed for adherent cells under the effect of cyclic substrate stretch [2,4,5,10-13,15], in order to avoid the excessive stretching that may cause rapid disassembly of the cytoskeletal filament network [11,14,37]. Nevertheless, this kind of behaviour is not presented during the orientation evolution of the rhombic model. For this frame type, the increase of the maximum substrate stretch results to a stability transition of the perpendicular to the maximum stretch direction from globally unstable to locally stable. This direction continues to correspond to local only minima until the limit square– configuration, where its stability is rendered global. Hence, according to Maxwell’s convention, the rhombic model orients parallel to the direction of the maximum substrate stretch, since in the perpendicular to the latter direction the total potential energy is not globally minimum (except, of course, when ER = 1).
Apart from this last discrepancy between theoretical predictions and experimental observations there appears to be another one related to the effect of prestrain. For both model geometries, increase of prestrain while keeping all the other parameter values constant seems to promote alignment parallel to the maximum stretch direction. Nevertheless, experimental observations for the case of cyclic substrate stretching report a different response [11]. Since in previous theoretical work on the subject, [27,28], model predictions were in concert to experimental data regarding the prestrain effect, it is possible and reasonable to ascribe this discrepancy to the assumption of linear elastic strings. Quite often, in two–dimensional cultures of stationary cells on artificial substrata, actin filaments are bundled to form stress fibres (in fact, in such cases stress fibres are the prominent cytoskeletal feature). If instead of actin filaments we assume that the elastic strings of the two plane tensegrity models correspond to stress fibres, then the strain energy function of Eq.19 should be modified (e.g., by adding a higher order term), since experimental data suggest that for strains exceeding 40% their behaviour is nonlinear [38]. However, such a consideration would only be in expense of mathematical calculations without improving the physical motivation. In any case, the general behaviour of the two plane tensegrity models is in good agreement with experimental data reported in literature for the cellular orientation under static biaxial substrate stretching, whereas the detected inconsistencies are related to cyclic stretching observations (which are not examined here).
6. CONCLUSIONS
A general integral stability analysis of two plane tensegrity frames used for the description of cellular reorientation under biaxial substrate stretching has been presented. Adopting Maxwell’s convention for stability, the analysis was performed in the context of Finite Elasticity Theory. It has been shown that the reorientation is controlled by such parameters as the magnitude of the extracellular stretch components, of which the maximum component is the primary one, and the strength of the intracellular contractile mechanism. This dependence is consistent to numerous well documented laboratory reports (see Refs. in Introduction). It is also in accord with previous theoretical modelling of the reorientation of cellular stress fibres as well [27,28]; yet, the present study focuses on the response of the entire intracellular biopolymer network, which is a substantially more difficult undertaking than studying individual, isolated stress fibres. The new finding, when working with a plane tensegrity CSK, is the governing role of the shape– geometry of the frame. The properties and general behaviour of the two different tensegrity frame geometries have been thoroughly analysed and discussed in the text.
Cellular orientation is a mechanochemical process involving the transduction of a mechanical stretching signal to changes in intracellular biochemistry (and vice versa), while the CSK exhibits dynamic, viscoelastic behaviour. Furthermore, it is certain that cellular architecture is far more complicated than any of its existing mechanical descriptions, and that tensegrity modelling is, rather, a simplification. For these reasons, the good agreement between experimental data and predictions, based on elastic stability considerations of the two, purely mechanical, plane tensegrity models, is quite remarkable. However, the models employed here are simple, physiologically compatible, and the analysis is based on fundamental principles; moreover, no far– fetched assumptions that could bias the results have been introduced. Taking all these into account, it is revealed that mechanical stability is a major determinant of cytoskeletal rearrangement, and that cellular orientation can be successfully treated as a problem of elastic stability. This conclusion does not–in any way–exclude other (chemical) agents that could influence the determination of the orientation direction. Albeit, the consistency of theoretical predictions to the experimental data suggests that the extent of the other agents effect is rather limited, or that their contribution is already integrated to the analysis through their mechanical expressions (e.g., prestrain).
REFERENCES
- Suresh, S. (2007) Biomechanics and biophysics of cancer cells. Acta Biomaterialia, 3, 413-438.
- Dartsch, P.C. and Haemmerle, H. (1986) Orientation response of arterial smooth muscle cells to mechanical stimulation. European Journal of Cell Biology, 41, 339-346.
- Takemasa, T., Sugimoto, K. and Yamashita, K. (1997) Amplitude - dependent stress–fiber reorientation in early response to cyclic strain. Experimental Cell Research, 230, 407-410.
- Neidlinger-Wilke, C., Grood, E.S., Wang, J.H.–C., Brand, R.A. and Claes, L. (2001) Cell alignment is induced by cyclic changes in cell length: studies of cells grown in cyclically stretched substrates. Journal of Orthopaedic Research, 19, 286-293.
- Wang, J.H.-C., Goldschmidt-Clermont, P., Wille, J. and Yin, F.C.-P. (2001) Specificity of endothelial cell reorientation in response to cyclic mechanical stretching. Journal of Biomechanics, 34, 1563-1572.
- Takakuda, K. and Miyairi, H. (1996) Tensile behavior of fibroblasts cultured in collagen gel. Biomaterials, 17, 1393-1397.
- Eastwood, M., Mudera, V.C., Mcgrouther, D.A. and Brown, R.A. (1998) Effect of precise mechanical loading on fibroblast populated collagen lattices: morphological changes. Cell Motility and the Cytoskeleton, 40, 13-21.
- Collinsworth, A.M., Torgan, C.E., Nagada, S.N., Rajalingam, R.J., Kraus, W.E. and Truskey, G.A. (2000) Orientation and length of mammalian skeletal myocytes in response to unidirectional stretch. Cell and Tissue Research, 302, 243-251.
- Ignatius, A., Blessing, H., Liedert, A., Kaspar, D., Kreja, L., Friemert, B. and Claes, L. (2004) Effects of mechanical strain on human osteoblastic precursor cells in type I collagen matrices. Orthopade, 33, 1386-1393.
- Iba, I. and Sumpio, B.E. (1991) Morphological response of human endothelial cells subjected to cyclic strain in vitro. Microvascular Research, 42, 245-254.
- Wang, J.H.-C., Goldschmidt-Clermont, P. and Yin, F.C.-P. (2000) Contractility affects stress fiber remodelling and reorientation of endothelial cells subjected to cyclic mechanical stretching. Annals of Biomedical Engineering, 28, 1165-1171.
- Sipkema, P., van der Linden, J.W., Westerhof, N. and Yin, F.C.-P. (2003) Effect of cyclic axial stretch or rat arteries on endothelial cytoskeletal morphology and vascular reactivity. Journal of Biomechanics, 36, 653-659.
- Wille, J.J., Ambrosi, C.A. and Yin, F.C.-P. (2004) Comparison of the effects of cyclic stretching and compression on endothelial cell morphological responses. ASME Journal of Biomechanical Engineering, 126, 545-551.
- Kaunas, R., Nguyen, P., Usami, S. and Chien, S. (2005) Cooperative effects of Rho and mechanical stretch on stress fiber organization. Proceedings of the National Academy of Sciences of the USA, 102, 15895-15900.
- Kurpinski, K., Chu, J., Hashi, C. and Li, S. (2006) Anisotropic mechanosensing by mesenchimal stemm cells. Proceedings of National Academy Sciences, USA, 103, 16095-16100.
- Roth, B. and Whiteley, W. (1981) Tensegrity frameworks. Transactions of the American Mathematical Society, 265, 419-446.
- Motro, R. (1992) Tensegrity systems: the state of art. Int. Journal of Space Structure, 7(2), 75-83.
- Connelly R. and Back, A. (1998) Mathematics and tensegrity, American Scientist, 86, 142-151.
- Skelton, R.E., Helton, J., Adhikari, R., Pinaud, J. and Chan, W. (2002) An introduction to the mechanics of tensegrity structures (chapter 17), CRC Press.
- Williams, W.O. (2007) A primer on the mechanics of tensegrity structures. http://www.math.cmu.edu/users/wow/ papers/newprimer.pdf
- Stamenović, D. (2006) Models of cytoskeletal mechanics based on tensegrity. In Mofrad, M.R.K., Kamm, R.D. (Eds.), Cytoskeletal mechanics: models and measurements, Cambridge University Press, Manhattan, 103-128.
- Ingber, D.E. (1993) Cellular tensegrity: defining new rules of biological design that govern the cytoskeleton. Journal of Cell Science, 104, 613-627.
- Ingber, D.E. (1998) The architecture of life. American Science, 48(1), 75-83.
- Ingber, D.E. (2008) Tensegrity-based mechanosensing from macro to micro. Progress in Biophysics and Molecular Biology, 97(2-3), 163-179.
- Gilmore, R. (1981) Catastrophe theory for scientists and engineers. Wiley and Sons, New York.
- Thompson, J.M.T. and Hunt, G.W. (1984) Elastic instability phenomena. Wiley and Sons, Chichester.
- Lazopoulos, K.A. and Pirentis, A. (2007) Substrate stretching and reorganization of stress fibers as a finite elasticity problem. International Journal of Solids and Structures, 44, 8285-8296.
- Pirentis, A.P. and Lazopoulos, K.A. (2009) On stress fibre reorientation under plane substrate stretching. Archives of Applied Mechanics, 79, 263-277.
- Stamenović, D., Lazopoulos, K.A., Pirentis, A. and Suki, B. (2009) Mechanical stability determines stress fiber and focal adhesion orientation: a mathematical model. Cellular and Molecular Bioengineering, 2(4), 475-485.
- Lazopoulos, K.A. and Stamenovic, D. (2006) A mathematical model of cell reorientation in response to substrate stretching. Molecular Cellular and Biomechanics, 3, 43-48.
- Kamm, R.D. and Mofrad, M.R.K. (2006) Introduction, with the biological basis for cell mechanics. In: Mofrad, M.R.K., Kamm, R.D. (Eds.), Cytoskeletal mechanics: models and measurements. Cambridge University Press, Manhattan, 1-17.
- Stamenović, D., Fredberg, J.J., Wang, N., Butler, J.P. and Ingber, D.E. (1996) A microstructural approach to cytoskeletal mechanics based on tensegrity. Journal of Theoretical Biology, 181, 125-136.
- Ogden, R.W. (1997) Non–linear elastic deformations. Dover, New York.
- Holzapfel, G.A. (2000) Nonlinear solid mechanics: a continuum approach for engineering. Wiley and Sons, Chichester.
- Ericksen, J.L. (1991) Introduction to the thermodynamics of solids. In: Knops, R.J., Morton, K.W. (Eds.). Chapman & Hall, London, 39-61.
- Pitteri, M. and Zanzotto, G. (2003) Continuum models for phase transitions and twinning in crystals. Chapman, et al., Boca Raton, etc.
- Hayakawa, K., Sato, N. and Obinata, T. (2001) Dynamic reorientation of cultured cells and stress fibers under mechanical stress from periodic stretching. Experimental Cell Research, 268, 104-114.
- Deguchi, S., Ohashi, S. and Sato, M. (2006) Tensile properties of single stress fibers isolated from cultured vascular smooth muscle cells. Journal of Biomechanics, 39, 2603-2610.