Advances in Microbiology
Vol.3 No.6(2013), Article ID:38161,8 pages DOI:10.4236/aim.2013.36065
Differing Roles for Clostridium acetobutylicum’s Galactose Utilization Pathways*
1US Army Research Laboratory, Biotechnology Branch, Adelphi, USA
2Federal Staffing Resources, Annapolis, USA
Email: #christian.j.sund.civ@mail.mil
Copyright © 2013 C. J. Sund et al. This is an open access article distributed under the Creative Commons Attribution License, which permits unrestricted use, distribution, and reproduction in any medium, provided the original work is properly cited.
Received August 9, 2013; revised September 11, 2013; accepted September 24, 2013
Keywords: Clostridium acetobutylicum; Galactose; Lactose; Tagatose; Leloir Pathway; Fermentation
ABSTRACT
There has been a surge of interest in acetone-butanol-ethanol fermentations of Clostridium acetobutylicum due to its capacity to ferment many carbohydrates found in biomass. This metabolic diversity makes it a promising candidate for conversion of inexpensive, heterogeneous carbohydrate feedstocks to biofuels. Galactose is present in many such feedstocks due to its incorporation in plant cell walls. C. acetobutylicum encodes two galactose utilization pathways, the Leloir (LP) and the tagatose-6-P (T6P), and a previous study indicated genes for these pathways was differentially regulated during growth on galactose and lactose. In the current study we utilized quantitative PCR to further investigate gene expression levels and to show both pathways which were subject to carbon catabolite repression. During growth on galactose, mRNA for galactose-6-P isomerase from the T6P was induced to a greater extent than mRNA for glactokinase, the first enzyme in the LP. The galactose-6-P isomerase mRNAs were also more abundant than galactokinase mRNAs during growth on galactose. Analysis of theoretical ATP requirements to generate essential precursor metabolites indicated: 1) the LP is more efficient at generating upper glycolytic intermediates, 2) the T6P is more efficient at forming ATP, lower glycolytic intermediates and TCA cycle intermediates, 3) a combination of the two pathways is most efficient for forming precursor metabolites found in the pentose phosphate pathway. From this it can be suggested that the two pathways have different roles in the organism with the T6P generating most ATP and precursor metabolites and the LP providing upper glycolytic metabolites.
1. Introduction
Clostridium acetobutylicum is a gram positive, sporeforming anaerobe with an industrial history from its use to ferment starches to acetone, butanol and ethanol in the early part of the 20th century [1]. A renewed interest in C. acetobutylicum has emerged as oil reserve depletion looms and the need for a gasoline alternative compatible with current distribution systems remains unfulfilled. The driving forces behind this interest are butanol, which is an excellent gasoline alternative and C. acetobutylicum has the ability to ferment most carbohydrates found in biomass [2]. Thus, C. acetobutylicum fermentations are promising for high conversion rates of biomass to butanol. Optimizing this process will require a deeper understanding of C. acetobutylicum’s carbohydrate metabolism network, its regulation and the contribution of each pathway to metabolic output.
Reconstruction of C. acetobutylicum’s carbohydrate utilization network from its genomic sequence revealed the organism encodes two galactose utilization pathways, the Tagatose-6-P Pathway (T6P) and the Leloir pathway (LP) [3]. These results were intriguing because when cells were grown on lactose, it was observed the sugar was hydrolyzed intracellularly to galactose-6-P and glucose with the resulting galactose-6-P most likely being metabolized via the T6P [4]. Redundancy of galactose utilization pathways seems wasteful because only one should be required for growth; however the presence of both pathways has been reported in several genera from the phylum Firmicutes including Streptococcus, Staphylococcus, Lactococcus and Lactobacillus [5-11].
The LP is the most prevalent galactose utilization pathway and it converts intracellular galactose to glucose-6-P (see Figure 1) [12]. Possible sources of intra-
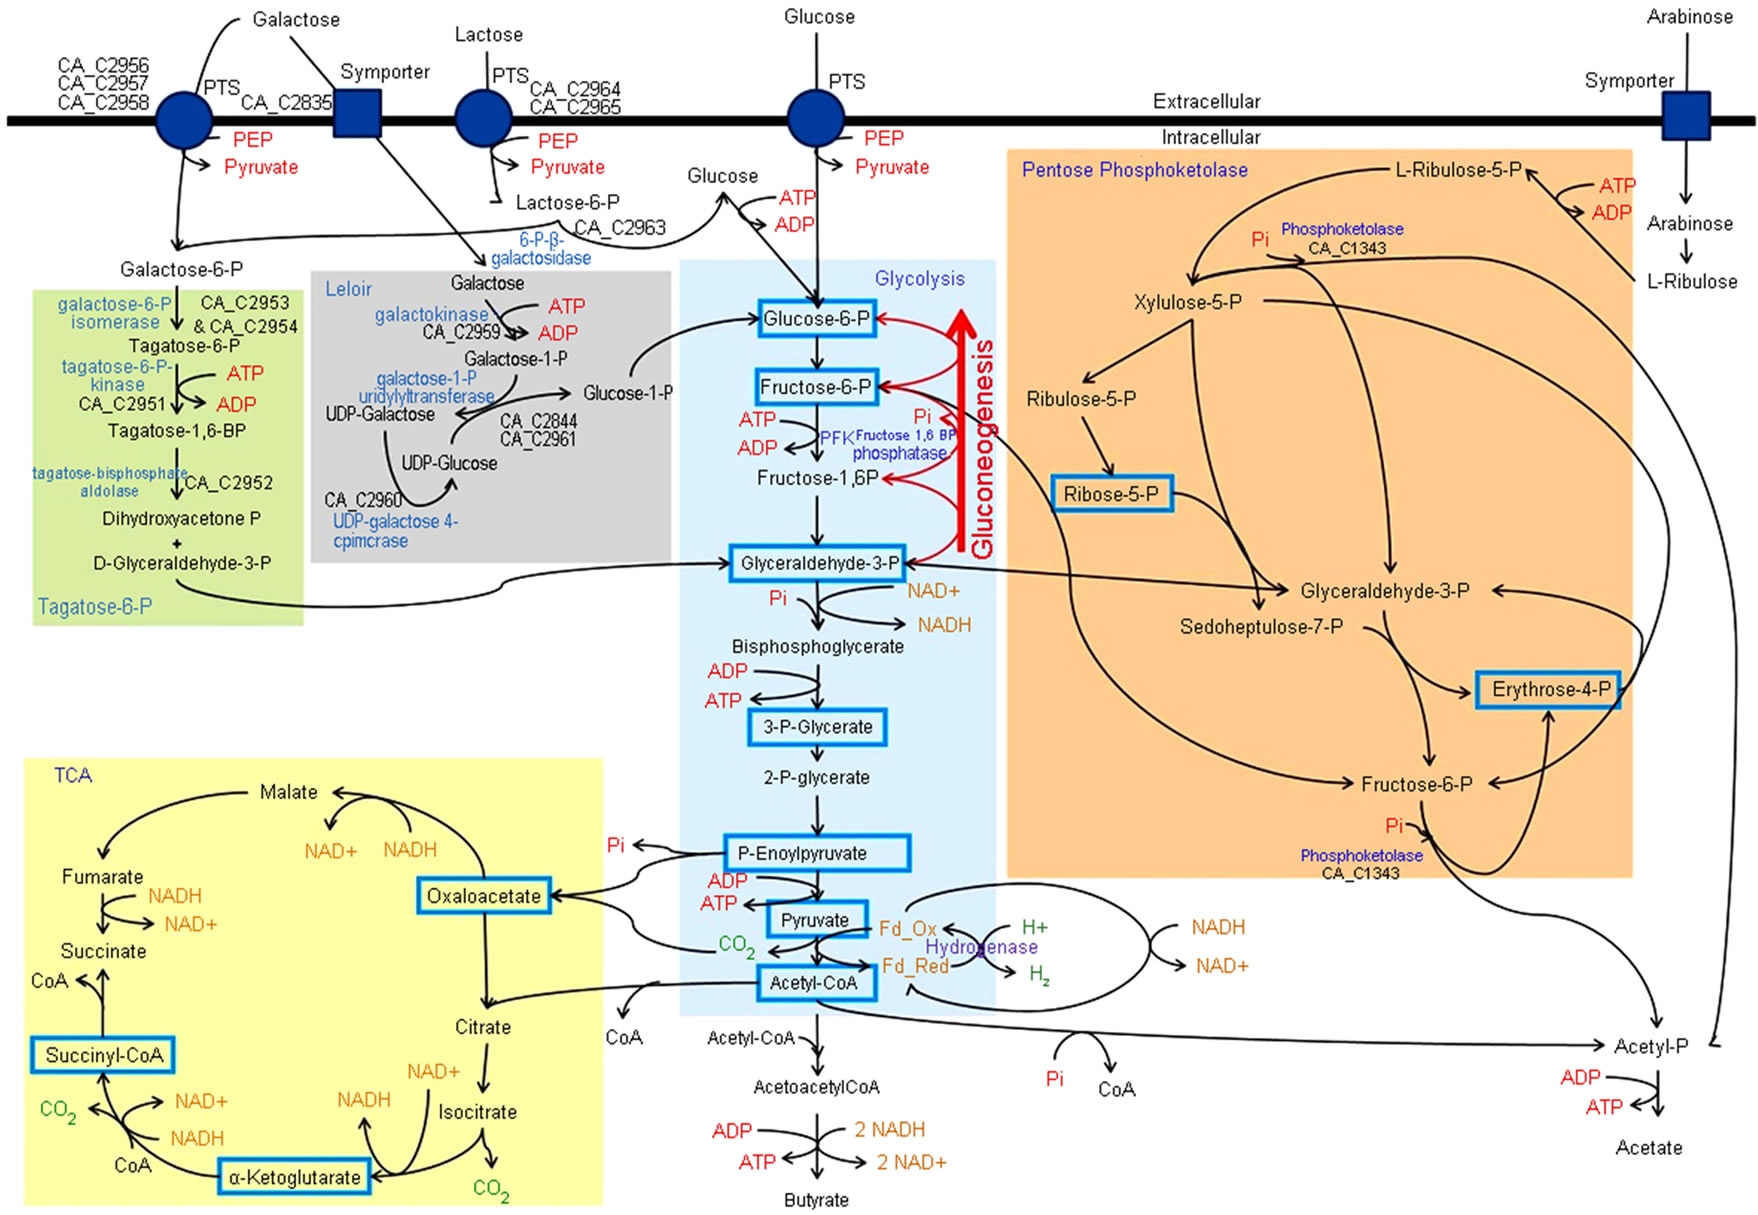
Figure 1. Schematic of select carbohydrate utilization pathways in C. acetobutylicum. Essential precursor metabolites are highlighted with blue boxes. Gluconeogenic reactions are shown by red arrows. Enzymes and the genes encoding them pertinent to this manuscript are in blue text and non-bolded black text, respectively.
cellular galactose in bacteria are symporter mediated import of galactose or hydrolysis of intracellular lactose (from symporter mediated transport) by beta-galactosidases. Upon entry into the LP, galactose is phosphorylated by galactokinase [12]. The resulting galactose-1-P is exchanged with the glucose moiety of uridine diphosphate (UDP) glucose by galactose-1-P uridylyltransferase, forming UDP-galactose and glucose-1-P [12]. Phosphoglucomutase converts glucose-1-P into glucose-6-P which can be processed via glycolysis [12]. UDP-glucose is regenerated by conversion of UDP-galactose to UDPglucose by UDP-galactose-4-epimerase [12]. C. acetobutylicum does not appear to transport lactose via a symporter and lacks intracellular beta-galactosidases, so the primary source of intracellular galactose in this organism is probably symporter mediated transport of galactose [4].
The T6P is less common than the LP and has been implicated as the primary pathway used for metabolism of intracellular galactose-6-P by C. acetobutylicum [4]. In this pathway galactose-6-P isomerase converts galactose-6-P to tagatose-6-P which is in turn phosphorylated to tagatose-1,6-BP, by tagatose-6-P kinase. Tagatose-BP aldolase converts tagatose-1,6-BP to two three-carbon molecules, dihydroxyacetone-P (DHAP) and glyceroldehyde-3-P (G3P), which can enter glycolysis. In C. acetobutylicum there are two potential sources of intracellular galactose-6-P, phosphotransferase system (PTS) mediated transport of galactose and hydrolysis of intracellular lactose-6-P (from PTS transport of lactose) by 6-P-beta-galactosidases [4-13].
A previous report showed C. acetobutylicum uses PTSs and symporters for galactose transport indicating the organism metabolized galactose via the T6P and LP [13]. Additionally, both pathways were induced at the transcriptional level during growth on galactose while only T6P genes were induced during growth on lactose [14]. In this report we attempt to elucidate regulatory mechanisms and physiological roles of the LP and the T6P by examining the two pathways in light of essential precursor metabolite production and comparing gene expression levels among varying growth conditions.
2. Materials and Methods
2.1. Growth
Cultures of C. acetobutylicum ATCC 824 were propagated anaerobically in clostridial growth media (CGM) as previously described [14]. Each liter of CGM contained: KH2PO4, 0.75 g; K2HPO4, 0.75 g; MgSO4·H2O, 0.4 g; MnSO4·H2O, 0.01 g; FeSO4·7 H2O, 0.01 g; NaCl, 1.0 g; asparagine, 2.0 g; yeast extract, 5.0 g; (NH4)2SO4, 2.0 g; carbohydrate, 5 g [15]. Glucose was used as the carbohydrate for routine growth.
2.2. RNA Isolation
Cultures of C. acetobutylicum were grown in a 4-vessel DASGIP bioreactor where the temperature was maintained at 37˚C, the cultures were agitated with a rushton impeller at 400 RPM, and the A600 was measured every 30 seconds with a DASGIP OD probe (path length 10 mm). The vessels contained 750 ml of CGM supplemented with either 0.5% galactose or 0.5% arabinose. Samples were removed from the bioreactors at selected time points and were treated with rifampicin, chloramphenicol, and phenylmethanesulfonyl fluoride (PMSF) at final concentrations of 30 µg/ml, 50 µg/ml, and 0.5 mM, respectively. Cultures were immediately incubated on ice for 10 minutes and then centrifuged in sealed tubes for 10 minutes, 5000 × g at 4˚C. The supernatant was removed and the cell pellets were suspended in 750 µl of a solution containing a 1:1 ratio of RNA protect (Qiagen) and phosphate buffered saline. After 5 min incubation at room temperature the cells were pelleted by centrifugation and the supernatant was removed. The cell pellets were immediately stored at −80˚C. Cell pellets were thawed and suspended in 1.5 ml RLT buffer (Invitrogen) supplemented with 150 µl β-mercaptoethanol and homogenized with 0.1 mm Zirconia/Silica beads (BioSpec) in a Mini-Beadbeater-16 (BioSpec) for 4 min. Total RNA was extracted from homogenized cells using an RNeasy mini kit (Qiagen) according to the manufacturer’s instructions.
2.3. Quantitative PCR
Purified RNA was treated with a Turbo DNA-free kit (Applied Biosystems) using the manufacturer provided rigorous DNase treatment protocol. The RNA was tested for DNA contamination using real time PCR primers for 16S ribosomal DNA. DNA contaminated samples were treated a second time with the Turbo DNA-free kit and retested. No samples required a third treatment. A SuperScript III first strand synthesis kit (Invitrogen) was used to synthesize cDNA for real time PCR. Primers designed using Primer3 were used to amplify products between 125 and 130 bp in size and are presented in Table 1 [16]. Reactions were setup as previously described with final volumes of 12.5 ml and were performed using the iQ SYBR Green Super mix (BioRad) on a LightCycler 480 II (Roche) [14]. Cycling parameters were as
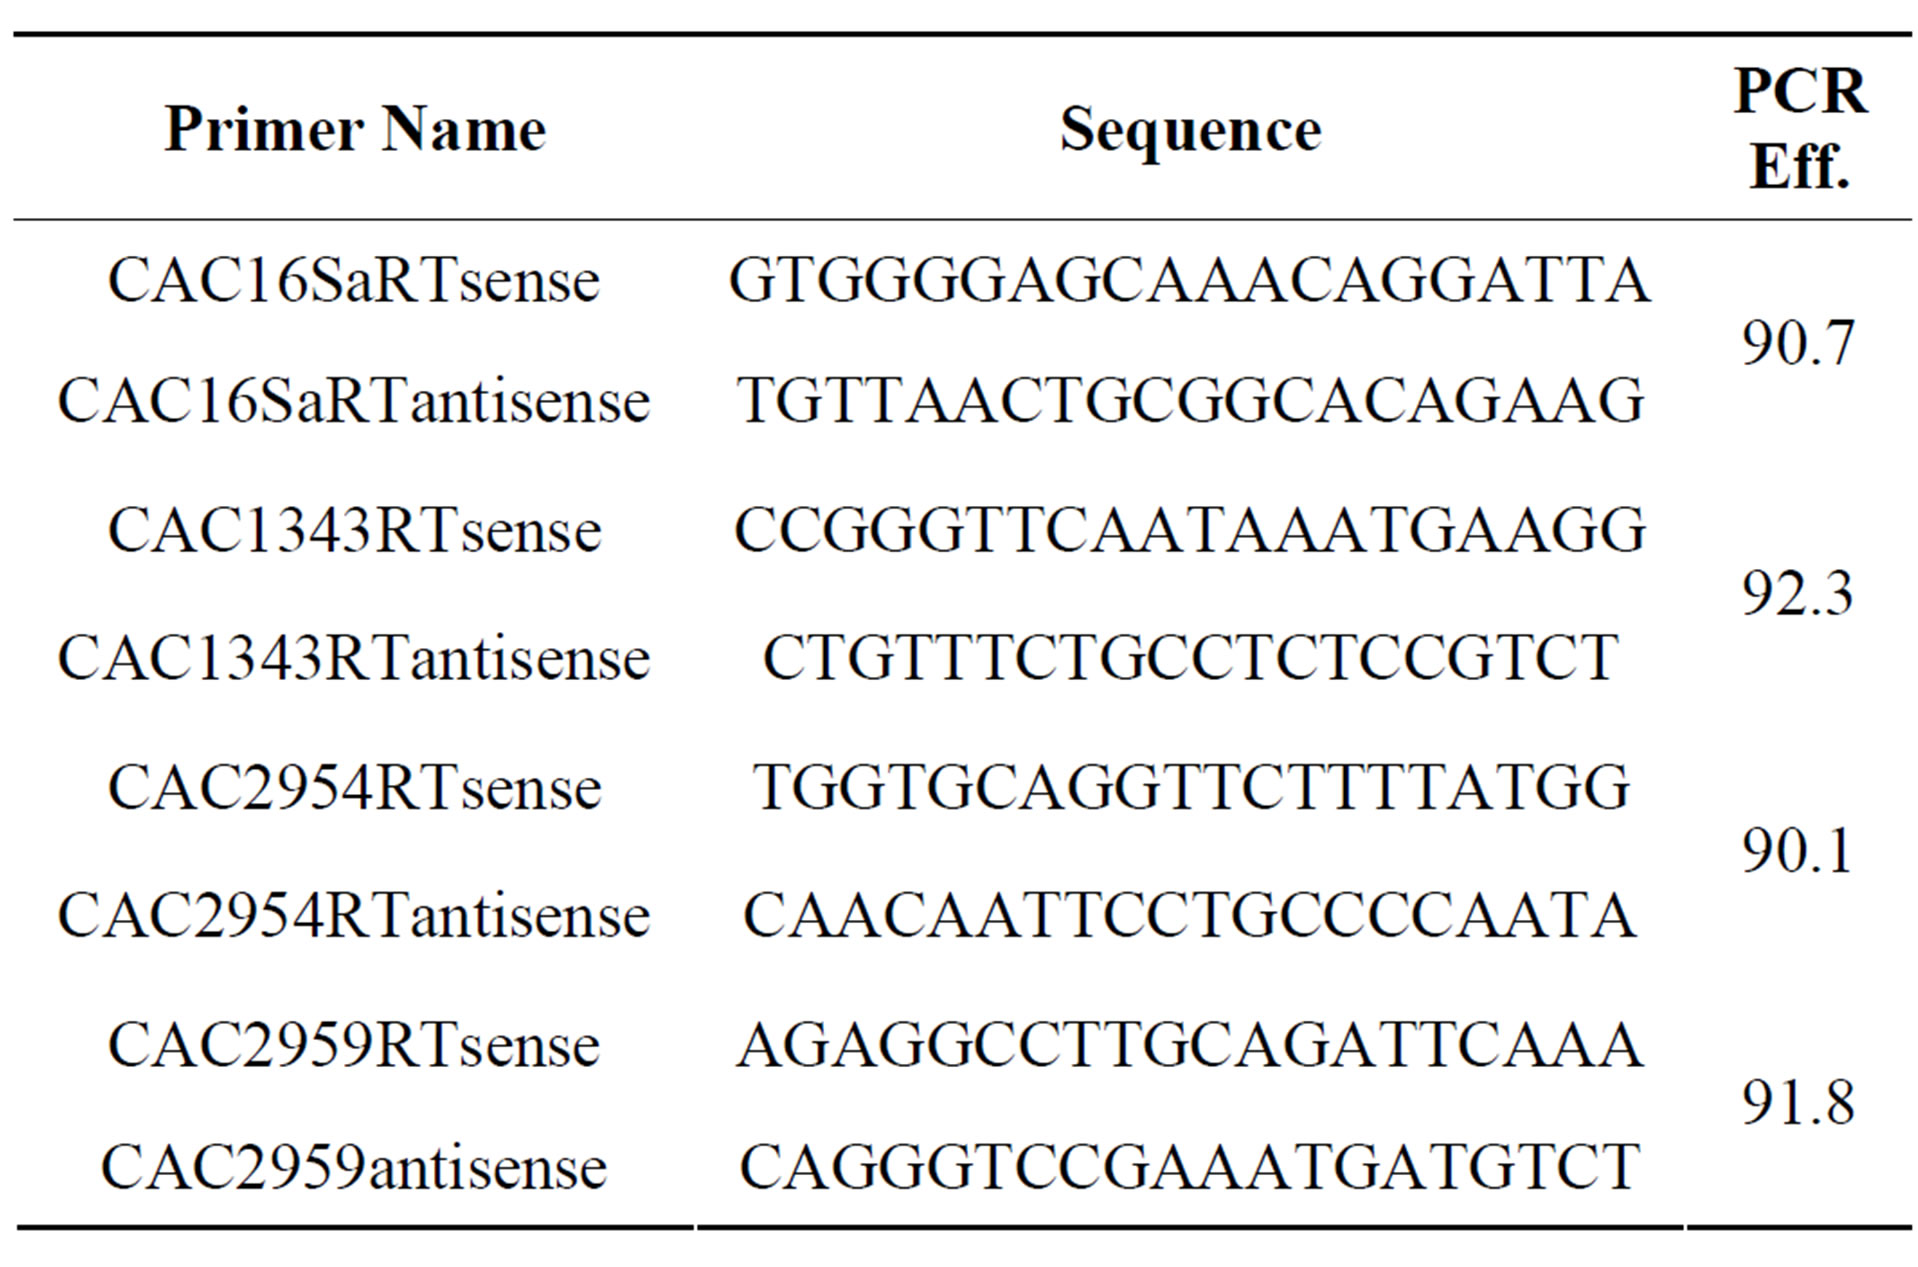
Table 1. Oligonucelotide sequences of primers for real time PCR analysis. The PCR efficiencies of primer pairs were determined as described in the materials and methods.
follows: 95˚C for 3 min (1 cycle) then 95˚C 10 s, 54˚C 15 s, 72˚C 15 s (50 cycles) with fluorescence being measured during the extension step. Melt curves ensured amplification of single products and the PCR efficiency was determined for each primer pair by analyzing serial dilutions (three replicates) of chromosomal DNA digested with BamHI. Relative expression levels were obtained using the Pfaffl method [17] with 16S cDNA serving as an internal standard.
3. Results and Discussion
3.1. Induction of T6P and LP Genes by Galactose
The genome sequence and transcriptomic profile of C. acetobutylicum indicate that it encodes and utilizes both the T6P and LP [14,18]. In a previous report we showed genes encoding enzymes for both pathways were induced by growth on galactose, while only T6P genes were induced during growth on lactose [14]. The narrow dynamic range of DNA microarrays limited accurate measurement of transcriptional levels in that study and only one time point was examined. Therefore, in the current study quantitative PCR was employed to compare mRNA levels of the galactokinase gene (CA_C2959) for the T6P and the galactose-6-isomerase gene (CA_C2954) for the LP during growth on galactose to mRNA levels during growth on glucose. The data presented in Figure 2(c) are in agreement with previous microarray results in that both pathways are induced by galactose in comparison to growth on glucose [14]. Both genes showed maximum induction during early exponential phase with the galactokinase gene being induced to a greater extent than the galactose-6-isomerase gene. Analysis of Cp values obtained during real time PCR analysis of galactose grown cells showed CA_C2959 Cp values ranged between 4.9 and 6.5 lower than CA_C2954 Cp values (data not shown). Since the primer sets for the two genes had similar PCR efficiencies (see Table 1) it can be concluded that CA_C2959 mRNA was more abundant than CA_C2954 mRNA suggesting the T6P predominates galactose utilization C. acetobutylicum.
3.2. LP and T6P Genes Are Repressed by Glucose
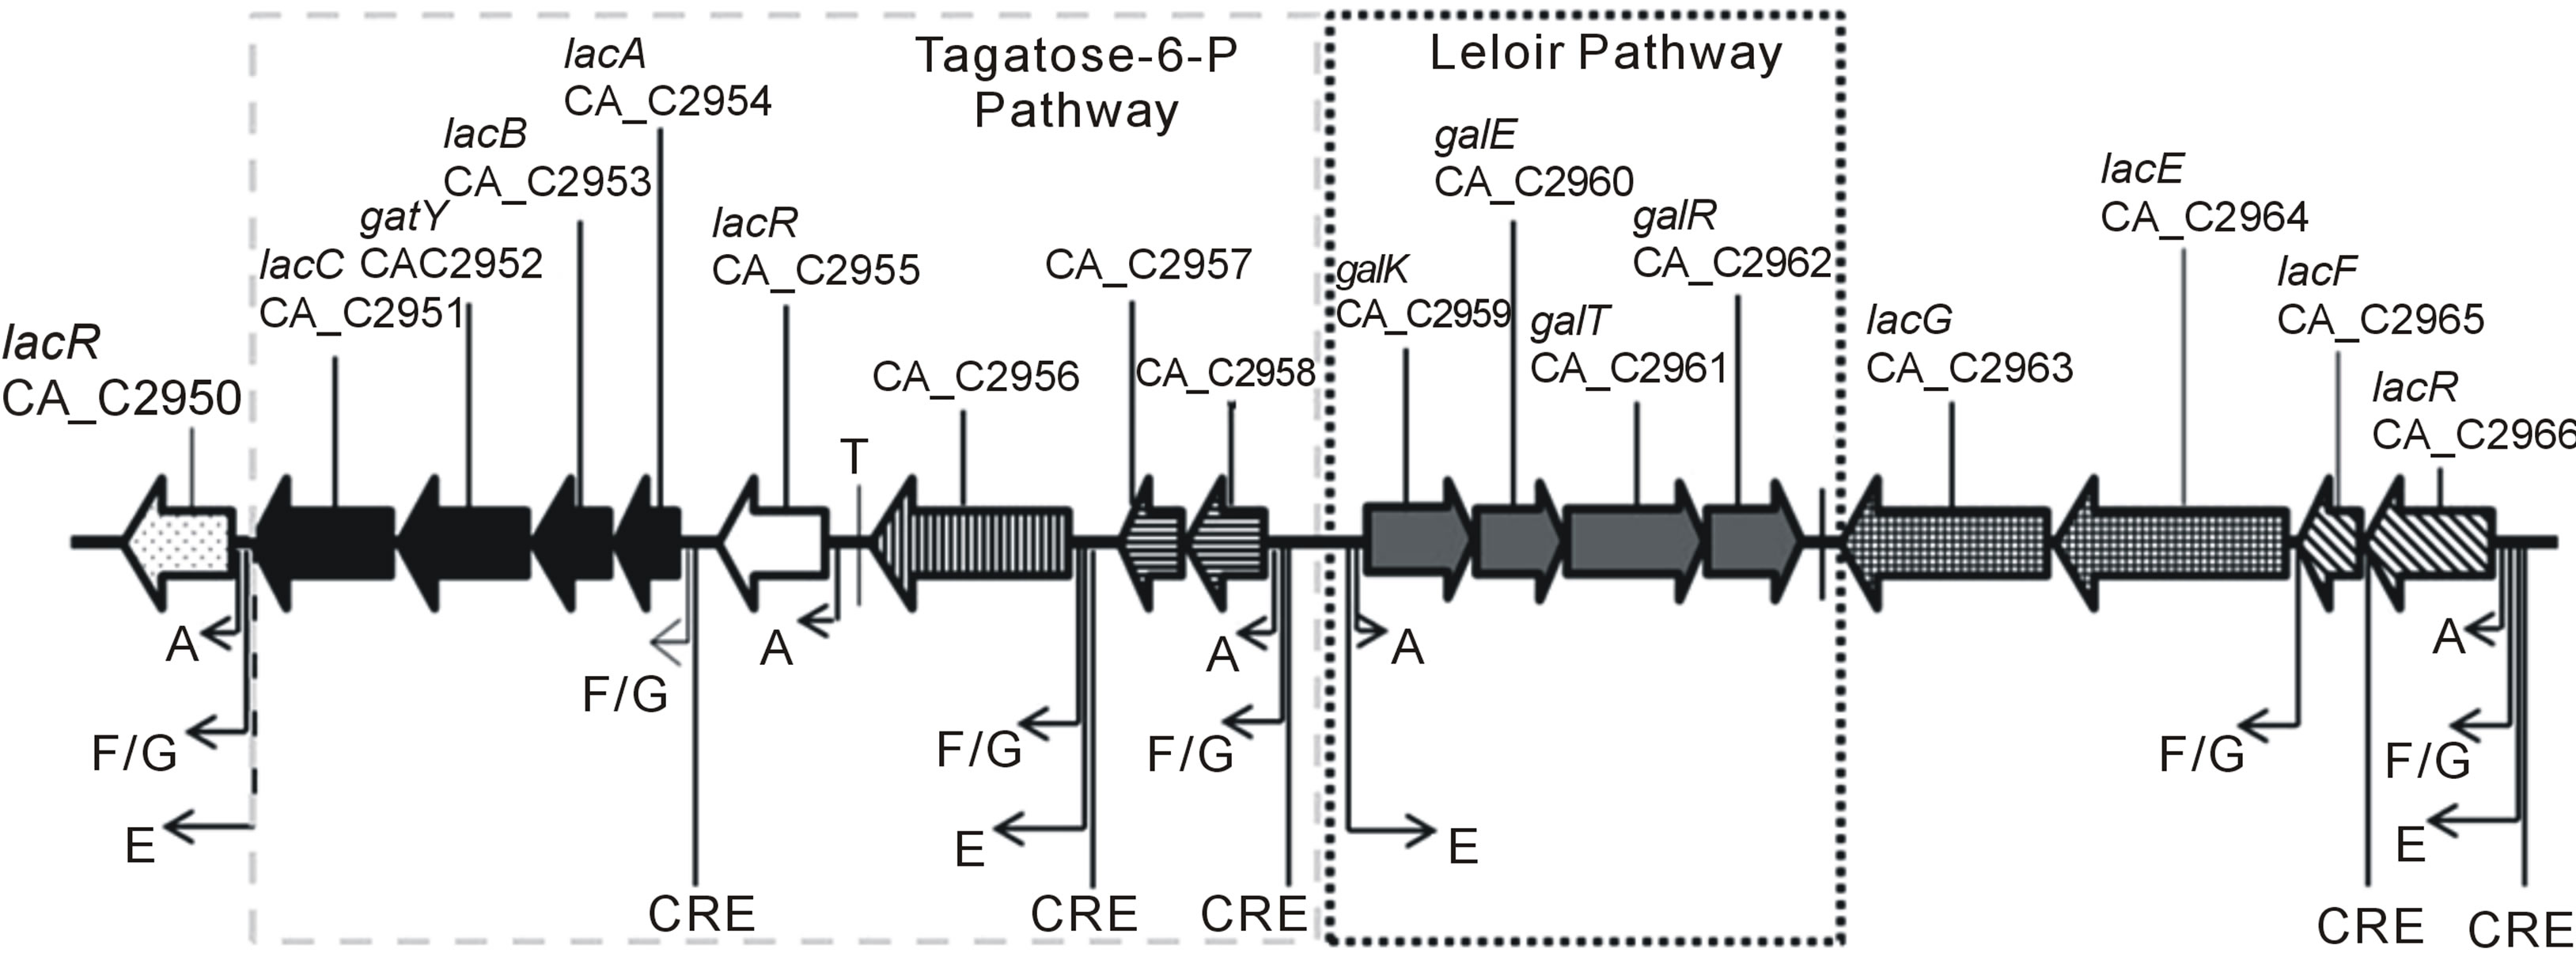
Previous studies identified several Catabolite Repression Elements (CREs, CcpA binding sites) upstream of galactose utilization operons (see Figure 2(a)) indicating galactose utilization is subject to catabolite repression [19]. To test whether LP and T6P genes were controlled by catabolite repression we used quantitative PCR to compare mRNA expression levels of CA_C2959 and CA_C2954 during growth on glucose and arabinose. Based upon previous work, growth on glucose was chosen as a condition when genes would be repressed by CcpA [20-22]. Arabinose was chosen as a non-repressing carbohydrate because it is transported by proton symporters and it therefore does not lead to dephosphorylation of HPr-P to Hpr [23,24]. It has been demonstrated that HPr-P inhibits catabolite repression by binding CcpA, thereby preventing its association with CREs, and leading to de-repression of downstream transcription [24]. The results presented in Figure 2(b) show CA_C2954 mRNA encoding galactose-6-P isomerase, the first enzyme of the T6P, reached maximal expression during exponential growth on arabinose where it had ~200 fold higher expression when compared to cells grown on glucose. Messenger RNA expression of the galactokinase gene CA_C2959, encoding the first enzyme of the LP, was ~20 fold higher during exponential growth on arabinose when compared to growth on glucose. The increase in relative expression levels of CA_C2954 and CAC2959 during growth on arabinose when compared to growth on glucose, and the presence of putative CREs in upstream sequences indicate both genes were subject to catabolite repression when glucose was present. Both genes were induced to a greater extent by galactose, providing evidence of a second level of regulation in which galactose induces expression of galactose utilization operons, a common regulatory scheme for carbohydrate utilization operons across the domain of Bacteria.
3.3. Formation of Lower Glycolytic Intermediates Is More Favorable via the T6P
Microorganisms using carbohydrates as a carbon source must have the metabolic capacity to transform carbohydrate precursors into all cellular building blocks [25]. Extensive studies of metabolism revealed there are 12 essential precursor metabolites that can be used to generate nearly all cellular components [25]. Figure 1 shows these essential precursors, highlighted by blue boxes, in context with galactose utilization and central metabolic pathways of C. acetobutylicum reconstructed from previous studies [14,18]. By examining the metabolic output of the T6P and LP, and the calculated ATP costs to form precursor metabolites shown in Table 2, two potentially different roles for the pathways emerge.
Uptake of galactose by PTSs and its metabolism via the T6P results in the formation of G3P and DHAP (see Figure 1). This costs one ATP and one phosphoenoylpyruvate (dephosphorylated to pyruvate) which are effectively equivalent to two ATPs per galactose. Ignoring energy associated with transport, metabolism of galactose via the LP to G3P and DHAP also costs the cell two ATPs per galactose. The difference between the two pathways arises from the galactose/H+ symporter used to import unphosphorylated galactose for metabolism via the LP. Proton symporters rely on the transmembrane proton gradient to drive the transport process. Since C. acetobutylicum does not respire, it probably generates a portion of its proton gradient by running the F0F1 ATP synthase in reverse like other fermentative organisms [26]. This process hydrolyses ATP to ADP and pumps protons out of the cell with stoichiometries of 2-3 H+ transported per ATP [27]. If this ATP requirement is taken into account for metabolism via the LP then the total ATP required for transport and conversion of galactose to G3P and DHAP is between 2.33 and 2.5; Therefore, the T6P is more favorable for formation of three carbon glycolytic intermediates. Metabolism of galactose to essential precursors in the TCA cycle requires processing via lower glycolysis, indicating formation of TCA intermediates from galactose is also more favorable via the T6P. ATP production in glycolysis also

Table 2. Net ATP required for each pathway to import and form precursor metabolites glucose-6-P/fructose-6-P (G6P/F6P), G3P, Acetyl-CoA, ribose-5-P (R5P) and erythrose-5-P (E4P).
 (a)
(a)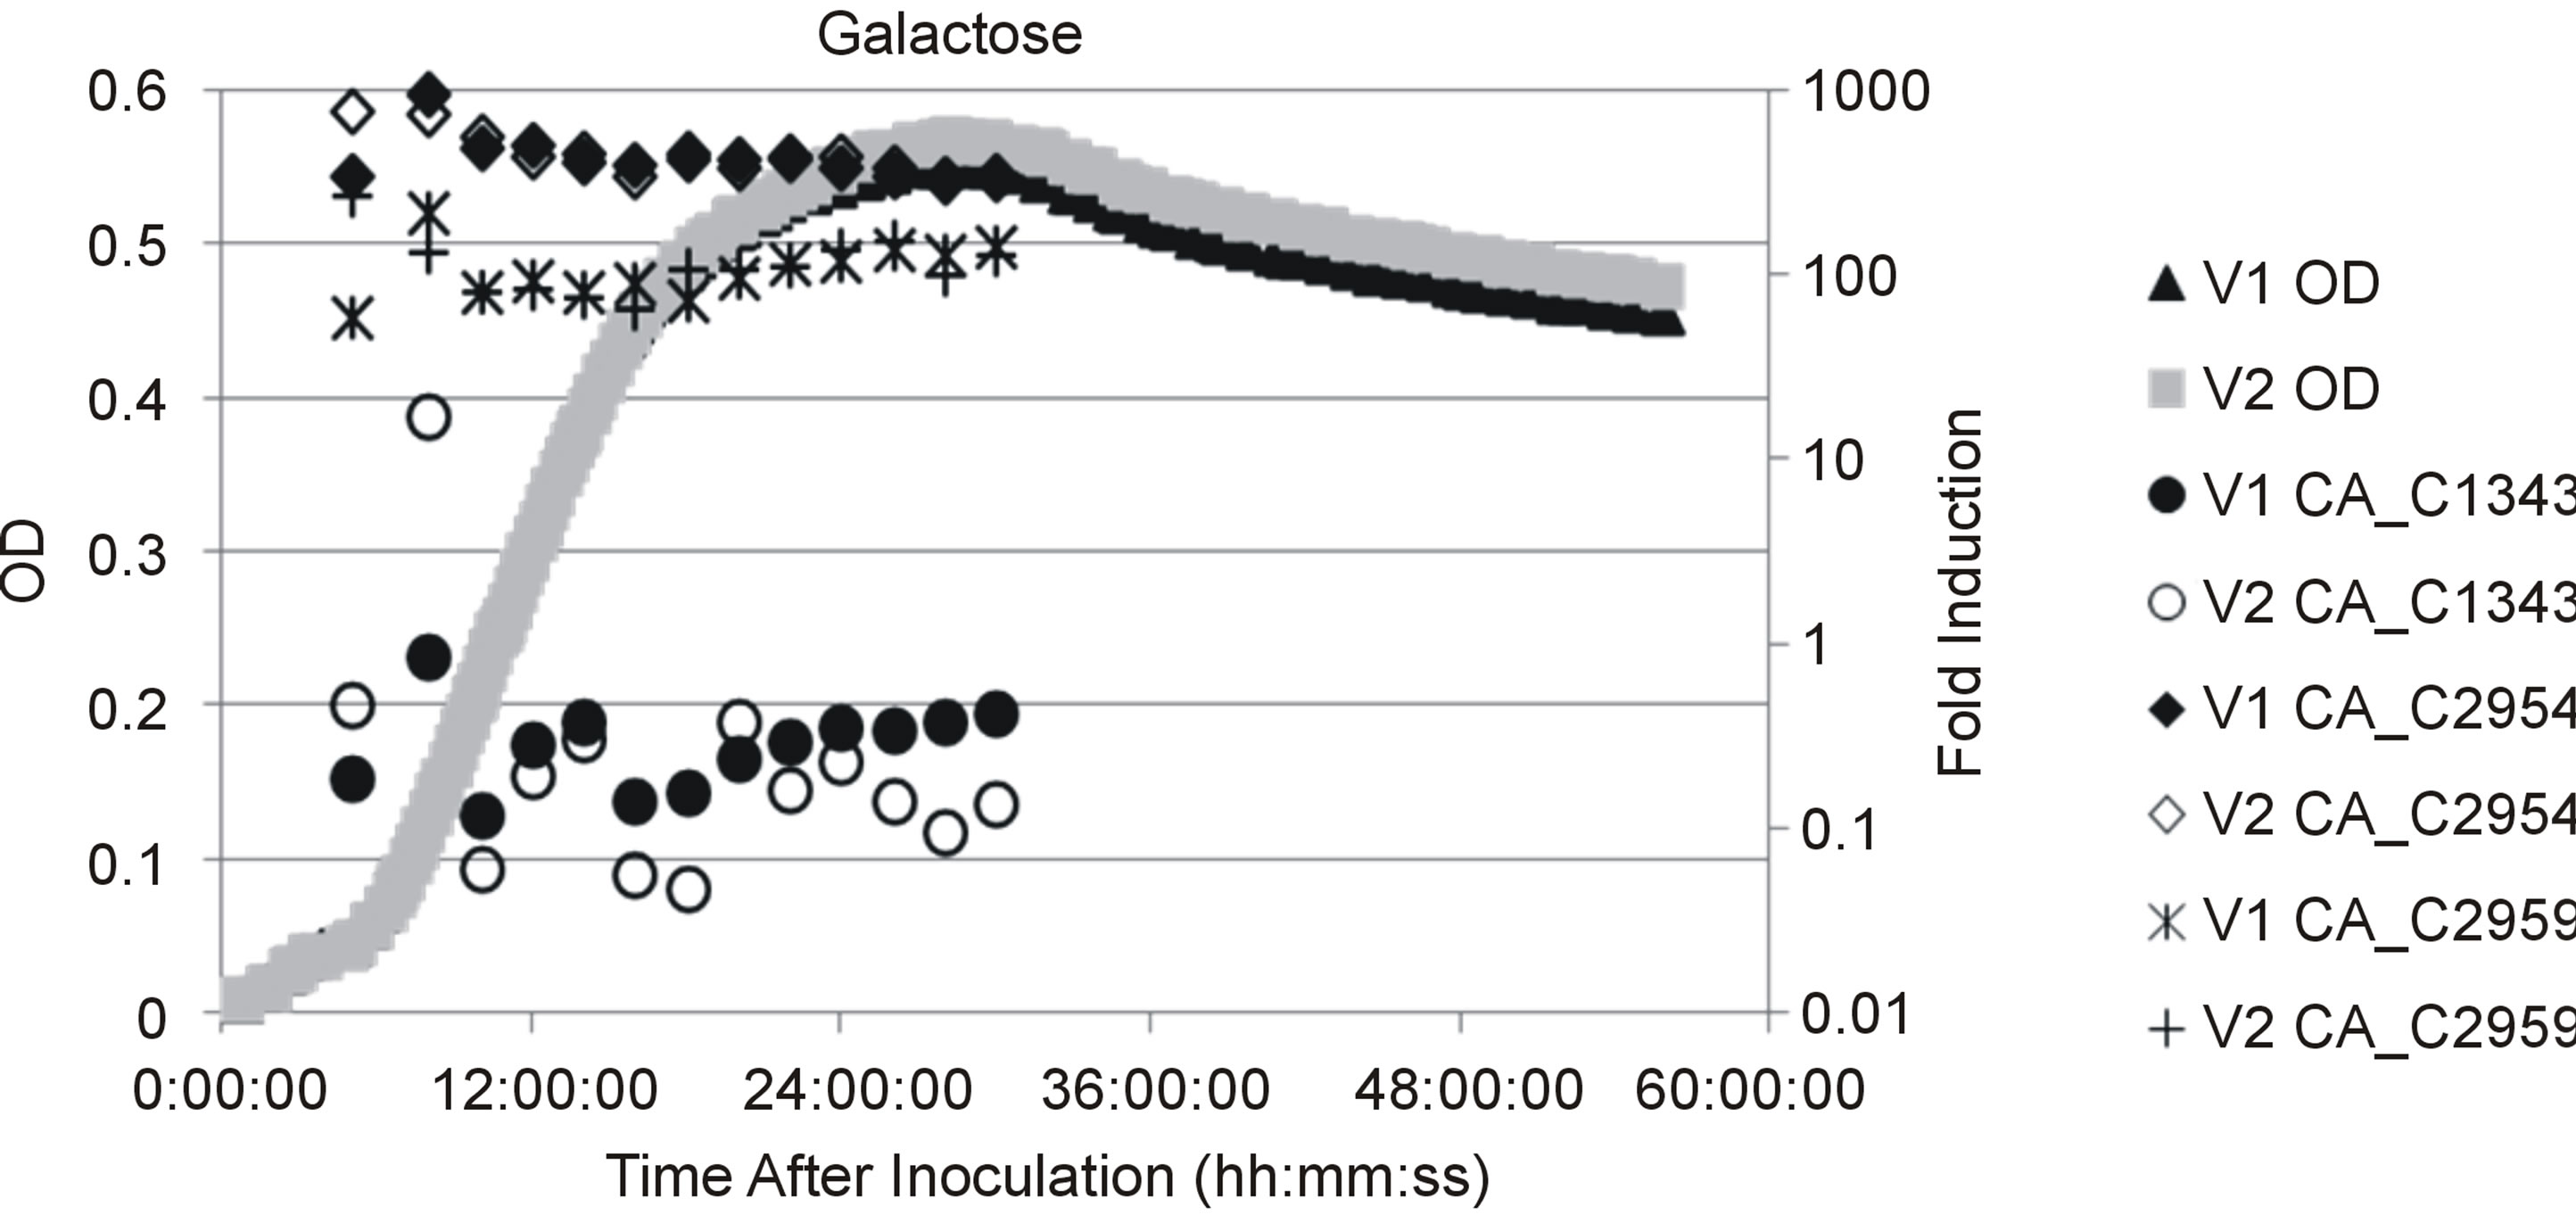 (b)
(b)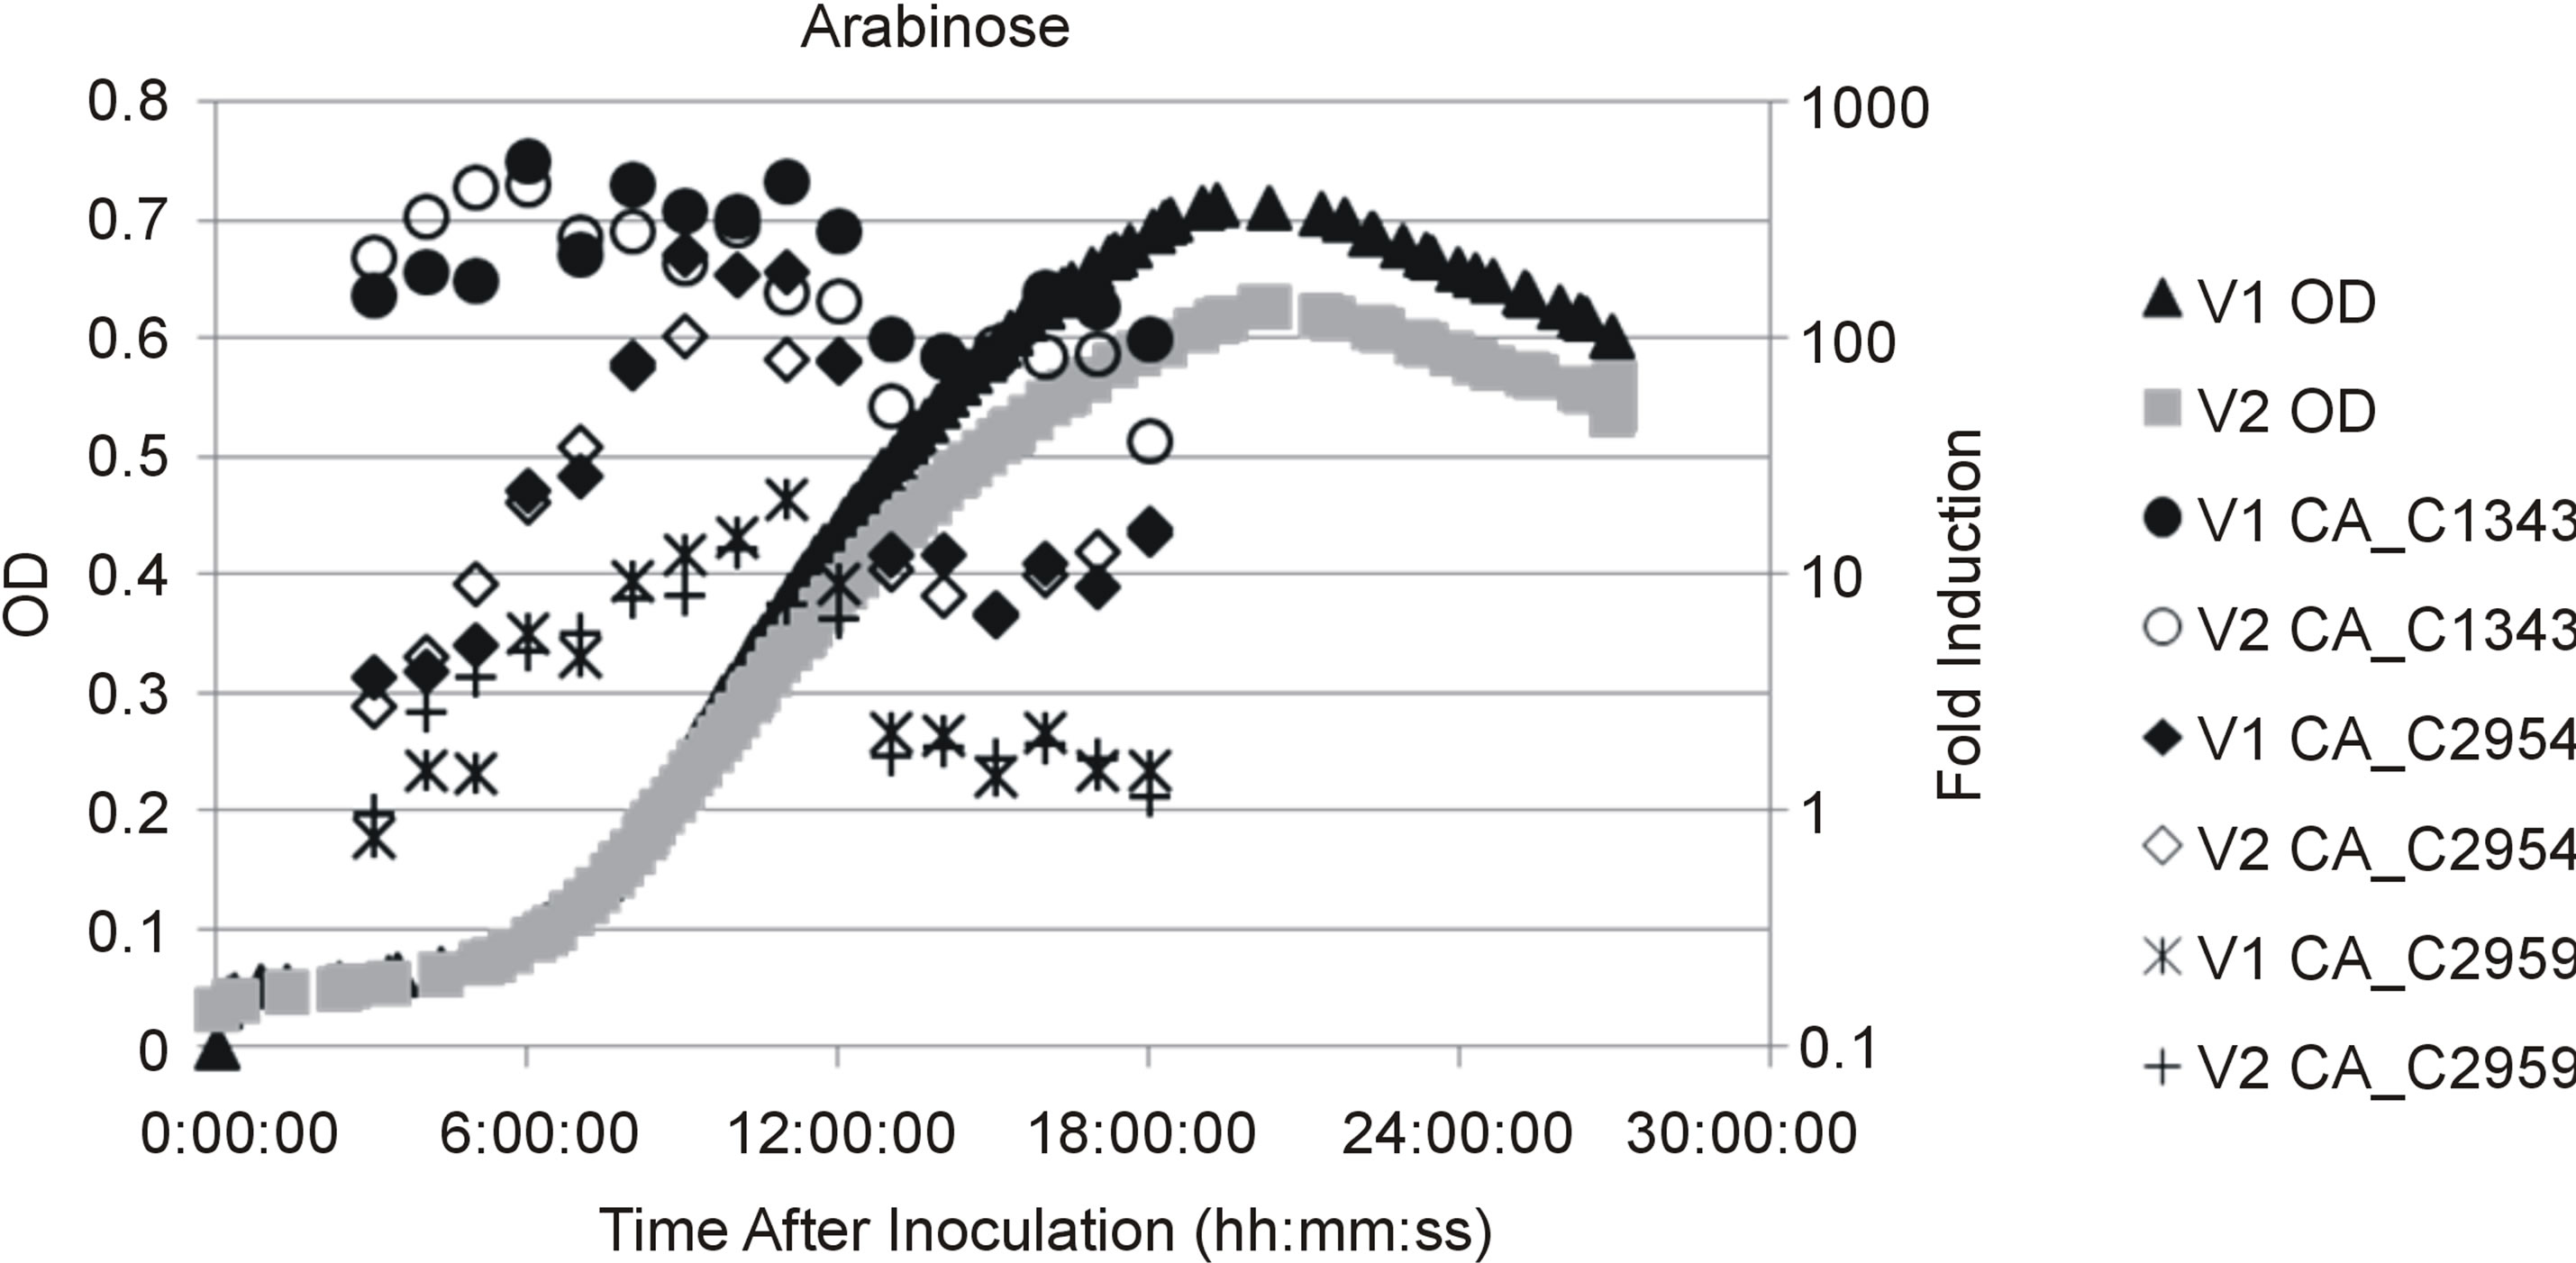 (c)
(c)
Figure 2. (a) Genetic map of galactose utilization operons. Operon predictions were based on Paredes et al. (2004) and are designated as follows: genes that are organized within the same operon are similarly shaded, putative are identified as bent arrows with letters indicationg sigma factors and terminations sites are maked with a vertical line and a T; (b) Scatter plot showing culture optical density (OD) and temporal mRNA expression profile of the genes for galactokinase (CA_C 2959), galactose-6-isomerase (CA_C2954) and phosphoketolase (CA_C1343) during growth on galactose for two fermentation vessels indiceted by V1 and V2. Gene expression levels were compared to cultures harvested during mid-exponential growth on glucose; OD measurements were collected as described in the materials and methods (c) Scatter plot showing OD and gene expression as described in (b) for two fermentation vessels indicated by V1 and V2 during growth on arabinose.
occurs after formation of G3P and DHAP making the T6P a more favorable ATP source. From these results it is clear much of the nutritional and energetic needs can be met by the T6P at a lower ATP cost than the LP.
3.4. Formation of Upper Glycolytic Intermediates Is More Favorable via the LP
The output of the T6P is two three-carbon molecules, G3P and DHAP (see Figure 1). It was shown above that the T6P is more favorable in formation of essential precursors of lower glycolysis and the TCA cycle. To form hexose phosphate precursors of upper glycolysis from G3P and DHAP the cells must perform gluconeogenesis which is an energy intensive process. As shown in Table 2 formation of one hexose-P from galactose using the T6P coupled with gluconeogenesis would cost the cell two ATP equivalents. One in the form of phosphoenoylpyruvate, used for transport and phosphorylation of galactose, and the other in the conversion of tagatose-6-P to tagatose-1,6-P. The carbon-phosphate bonds are conserved during conversion to fructose-1,6-P via G3P and DHAP. Recovery of ATP during dephosphorylation of fructose-1,6-P to fructose-6-P is not possible since reversal of phosphofructokinase is not energetically favorable. The cells must use fructose-1,6-bisphosphatase for this conversion, yielding an orthophosphate instead of an ATP (see Figure 1). In comparison, the output of the LP is glucose-1-P which can be isomerized to glucose-6-P, the first intermediate of glycolysis, making the total expense 1.33 - 1.5 ATP per hexose-P intermediate. Comparing ATP requirements for the two pathways (Table 2) shows generation of hexose-P precursors from galactose is more favorable when the LP is employed. From this and the fact that the T6P is more efficient at forming lower glycolytic intermediates it can be suggested the LP’s primary role is anapleurotic during growth on galactose because it fills the need of a more energetically favorable route to upper glycolytic intermediates.
3.5. Optimal Formation of Pentose Phosphate Pathway Intermediates Requires the LP and T6P
Formation of essential precursor metabolites, erythrose- 4-P and ribose-5-P, located in the pentose phosphate pathway from glycolytic intermediates only requires one enzyme, transketolase. This enzyme converts glyceraldehydes-3-P and fructose-6-P to erythrose-4-P and ribose-5-P. Table 2 shows the ATP required to form erythrose-4-P and ribose-5-P from galactose using only the T6P for galactose metabolism is 1.5 each. Formation of these intermediates is slightly more efficient using solely the LP at a cost of 1.24 - 1.38 ATP per precursor. Optimization of transketolase reactant production using the LP as the fructose-6-P source and the T6P as the glyceradehyde-3-P source should result in the formation of erythrose-4-P and ribose-5-P at a cost of 1.15 - 1.25 ATP each.
4. Conclusions
Redundant pathways are ubiquitous in carbohydrate and central metabolism [28-30]. Metabolic models predict that employment of redundant genes may be drastically altered depending on growth conditions and that the most advantageous utilization of metabolic pathways may change according to growth conditions [31]. Our data indicating different roles for C. acetobutylicum’s two galactose utilization pathways seem to support this in silico prediction. Based upon ATP requirements, both the LP and T6P would be required for optimal formation of essential precursor metabolites during growth on galactose as the sole carbon source. This benefit may outweigh the genetic maintenance costs of the two pathways and may confer a long term advantage to organisms with both pathways. The benefit is especially relevant for fermentative organisms where low ATP yields are common and may explain why most, if not all, organisms containing both pathways described to date are either obligate or facultative anaerobes.
Examination of several S. mutans galactose and lactose utilization mutants in another study led to the proposal of similar roles for the T6P and LP in that organism [5]. The study suggested that the LP provided cell wall precursors and upper glycolytic intermediates but did not examine ATP requirements for formation of metabolic precursors. Another notable difference is that the primary source of intracellular galactose in S. mutans was suspected to be from dephosphorylation of galactose-6-P (from PTS mediated transport) rather than symport mediated transport [5]. If ATP is formed during dephosphorylaion of galactose-6-P, then S. mutans could form upper glycolytic intermediates via the Leloir pathway more efficiently than C. acetobutylicum since the ATP cost per hexose-P would be 1 as compared to 1.25 - 1.33. From this it is clear much still needs to be learned about galactose metabolism in organisms containing both the LP and T6P, especially due to the industrial or medical relevance of the organisms. Further studies using isotope labeling and metabolomics to analyze wild type and galactose utilization mutants should provide physiological evidence supporting or refuting the proposed roles of the LP and T6P in these organisms.
REFERENCES
- T. Lutke-Eversloh and H. Bahl, “Metabolic Engineering of Clostridium acetobutylicum: Recent Advances to Improve Butanol Production,” Current Opinion in Biotechnology, Vol. 22, No. 5, 2011, pp. 634-647. http://dx.doi.org/10.1016/j.copbio.2011.01.011
- P. S. Nigam and A. Singh, “Production of Liquid Biofuels from Renewable Resources,” Progress in Energy and Combustion Science, Vol. 37, No. 1, 2011, pp. 52-68. http://dx.doi.org/10.1016/j.pecs.2010.01.003
- J. Nolling, G. Breton, M. V. Omelchenko, K. S. Makarova, Q. D. Zeng, R. Gibson, H. M. Lee, J. Dubois, D. Y. Qiu, J. Hitti, Y. I. Wolf, R. L. Tatusov, F. Sabathe, L. DoucetteStamm, P. Soucaille, M. J. Daly, G. N. Bennett, E. V. Koonin, D. R. Smith and G. S. C. P. Finishing, “Genome Sequence and Comparative Analysis of the Solvent-Producing Bacterium Clostridium acetobutylicum,” Journal of Bacteriology, Vol. 183, No. 16, 2001, pp. 4823-4838. http://dx.doi.org/10.1128/JB.183.16.4823-4838.2001
- Y. Yu, M. Tangney, H. C. Aass and W. J. Mitchell, “Analysis of the Mechanism and Regulation of Lactose Transport and Metabolism in Clostridium acetobutylicum ATCC 824,” Applied and Environmental Microbiology, Vol. 73, No. 6, 2007, pp. 1842-1850. http://dx.doi.org/10.1128/AEM.02082-06
- L. Zeng, S. Das and R. A. Burne, “Utilization of Lactose and Galactose by Streptococcus mutans: Transport, Toxicity, and Carbon Catabolite Repression,” Journal of Bacteriology, Vol. 192, No. 9, 2010, pp. 2434-2444. http://dx.doi.org/10.1128/JB.01624-09
- C. E. Price, A. Zeyniyev, O. P. Kuipers and J. Kok, “From Meadows to Milk to Mucosa—Adaptation of Streptococcus and Lactococcus Species to Their Nutritional Environments,” FEMS Microbiology Reviews, Vol. 36, No. 5, 2012, pp. 949-971.
- D. L. Bissett and R. L. Anderson, “Lactose and D-Galactose Metabolism in Group N Streptococci: Presence of Enzymes for Both the D-Galactose 1-Phosphate and DTagatose 6-Phosphate Pathways,” Journal of Bacteriology, Vol. 117, No. 1, 1974, pp. 318-320.
- A. R. Neves, W. A. Pool, J. Kok, O. P. Kuipers and H. Santos, “Overview on Sugar Metabolism and Its Control in Lactococcus lactis—The Input from in Vivo NMR,” FEMS Microbiology Reviews, Vol. 29, No. 3, 2005, pp. 531-554.
- D. L. Bissett and R. L. Anderson, “Genetic Evidence for the Physiological Significance of the D-Tagatose 6- Phosphate Pathway of Lactose and D-Galactose Degradation in Staphylococcus aureus,” Journal of Bacteriology, Vol. 119, No. 3, 1974, pp. 698-704.
- K. Bettenbrock and C. A. Alpert, “The Gal Genes for the Leloir Pathway of Lactobacillus casei 64H,” Applied and Environmental Microbiology, Vol. 64, No. 6, 1998, pp. 2013-2019.
- B. M. Chassy and J. Thompson, “Regulation and Characterization of the Galactose-Phosphoenolpyruvate-Dependent Phosphotransferase System in Lactobacillus casei,” Journal of Bacteriology, Vol. 154, No. 3, 1983, pp. 1204- 1214.
- H. M. Holden, I. Rayment and J. B. Thoden, “Structure and Function of Enzymes of the Leloir Pathway for Galactose Metabolism,” Journal of Biological Chemistry, Vol. 278, No. 45, 2003, pp. 43885-43888. http://dx.doi.org/10.1074/jbc.R300025200
- N. A. Gutierrez and I. S. Maddox, “Galactose Transport in Clostridium acetobutylicum P262,” Letters in Applied Microbiology, Vol. 23, No. 2, 1996, pp. 97-100. http://dx.doi.org/10.1111/j.1472-765X.1996.tb00039.x
- M. D. Servinsky, J. T. Kiel, N. F. Dupuy and C. J. Sund, “Transcriptional Analysis of Differential Carbohydrate Utilization by Clostridium acetobutylicum,” Microbiology (SGM), Vol. 156, No. 2010, pp. 3478-3491.
- D. P. Wiesenborn, F. B. Rudolph and E. T. Papoutsakis, “Thiolase from Clostridium-Acetobutylicum Atcc-824 and Its Role in the Synthesis of Acids and Solvents,” Applied and Environmental Microbiology, Vol. 54, No. 11, 1988, pp. 2717-2722.
- S. Rosen and H. Skaletsky, “Primer3 on the WWW for General Users and for Biologist Programmers,” Bioinformatics Methods and Protocols: Methods in Molecular Biology, Vol. 132, 2000, pp. 365-386.
- M. W. Pfaffl, “A New Mathematical Model for Relative Quantification in Real-Time RT-PCR,” Nucleic Acids Research, Vol. 29, No. 9, 2001, p. e45. http://dx.doi.org/10.1093/nar/29.9.e45
- J. Nolling, G. Breton, M. V. Omelchenko, K. S. Makarova, Q. Zeng, R. Gibson, H. M. Lee, J. Dubois, D. Qiu, J. Hitti, Y. I. Wolf, R. L. Tatusov, F. Sabathe, L. Doucette-Stamm, P. Soucaille, M. J. Daly, G. N. Bennett, E. V. Koonin and D. R. Smith, “Genome Sequence and Comparative Analysis of the Solvent-Producing Bacterium Clostridium acetobutylicum,” Journal of Bacteriology, Vol. 183, No. 16, 2001, pp. 4823-4838. http://dx.doi.org/10.1128/JB.183.16.4823-4838.2001
- D. A. Rodionov, A. A. Mironov and M. S. Gelfand, “Transcriptional Regulation of Pentose Utilisation Systems in the Bacillus/Clostridium Group of Bacteria,” FEMS Microbiology Letters, Vol. 205, No. 2, 2001, pp. 305-314. http://dx.doi.org/10.1111/j.1574-6968.2001.tb10965.x
- M. Tangney, A. Galinier, J. Deutscher and W. J. Mitchell, “Analysis of the Elements of Catabolite Repression in Clostridium acetobutylicum ATCC 824,” Journal of Molecular Microbiology and Biotechnology, Vol. 6, No. 1, 2003, pp. 6-11. http://dx.doi.org/10.1159/000073403
- C. Grimmler, C. Held, W. Liebl and A. Ehrenreich, “Transcriptional Analysis of Catabolite Repression in Clostridium acetobutylicum Growing on Mixtures of DGlucose and D-Xylose,” Journal of Biotechnology, Vol. 150, No. 3, 2010, pp. 315-323. http://dx.doi.org/10.1016/j.jbiotec.2010.09.938
- C. Ren, Y. Gu, S. Hu, Y. Wu, P. Wang, Y. Yang, C. Yang, S. Yang and W. Jiang, “Identification and Inactivation of Pleiotropic Regulator CcpA to Eliminate Glucose Repression of Xylose Utilization in Clostridium acetobutylicum,” Metabolic Engineering, Vol. 12, No. 5, 2010, pp. 446-454. http://dx.doi.org/10.1016/j.ymben.2010.05.002
- C. Ren, Y. Gu, Y. Wu, W. Zhang, C. Yang, S. Yang and W. Jiang, “Pleiotropic Functions of Catabolite Control Protein CcpA in Butanol-Producing Clostridium acetobutylicum,” BMC Genomics, Vol. 13, 2012, p. 349. http://dx.doi.org/10.1186/1471-2164-13-349
- G. L. Lorca, Y. J. Chung, R. D. Barabote, W. Weyler, C. H. Schilling and M. H. Saier Jr., “Catabolite Repression and Activation in Bacillus subtilis: Dependency on CcpA, HPr, and HprK,” Journal of Bacteriology, Vol. 187, No. 22, 2005, pp. 7826-7839. http://dx.doi.org/10.1128/JB.187.22.7826-7839.2005
- E. Noor, E. Eden, R. Milo and U. Alon, “Central Carbon Metabolism as a Minimal Biochemical Walk between Precursors for Biomass and Energy,” Molecular Cell, Vol. 39, No. 5, 2010, pp. 809-820. http://dx.doi.org/10.1016/j.molcel.2010.08.031
- H. Grupe and G. Gottschalk, “Physiological Events in Clostridium acetobutylicum during the Shift from Acidogenesis to Solventogenesis in Continuous Culture and Presentation of a Model for Shift Induction,” Applied and Environmental Microbiology, Vol. 58, No. 12, 1992, pp. 3896-3902.
- Q. Al-Awqati, “Proton-translocating ATPases,” Annual Review of Cell Biology, Vol. 2, 1986, pp. 179-199. http://dx.doi.org/10.1146/annurev.cb.02.110186.001143
- S. C. Zeeman, J. Kossmann and A. M. Smith, “Starch: Its Metabolism, Evolution, and Biotechnological Modification in Plants,” Annual Review of Plant Biology, Vol. 61, 2010, pp. 209-234. http://dx.doi.org/10.1146/annurev-arplant-042809-112301
- D. Segura, R. Mahadevan, K. Juarez and D. R. Lovley, “Computational and Experimental Analysis of Redundancy in the Central Metabolism of Geobacter Sulfurreducens,” Plos Computational Biology, Vol. 4, No. 2, 2008, p. e36. http://dx.doi.org/10.1371/journal.pcbi.0040036
- M. Wildermuth, “Genome-Wide Analysis of Bacterial Metabolic Pathways,” Genome Biology, Vol. 1, No. 1, 2000, Reports 016.
- J. Edwards and B. Palsson, “Systems Properties of the Haemophilus influenzae Rd Metabolic Genotype,” Journal of Biological Chemistry, Vol. 274, No. 25, 1999, pp. 17410-17416. http://dx.doi.org/10.1074/jbc.274.25.17410
NOTES
*Conflict of Interest: the authors declare that the research was conducted in the absence of any commercial or financial relationships that could be construed as a potential conflict of interest.
#Corresponding author.

